La Mesa Park neighborhood in Yuma, Arizona (AZ), 85365 detailed profile
Settings
X


Business Search - 14 Million verified businesses
Area: 0.063 square miles
Population: 396
Population density:
| La Mesa Park: | 6,292 people per square mile |
| Yuma: | 924 people per square mile |

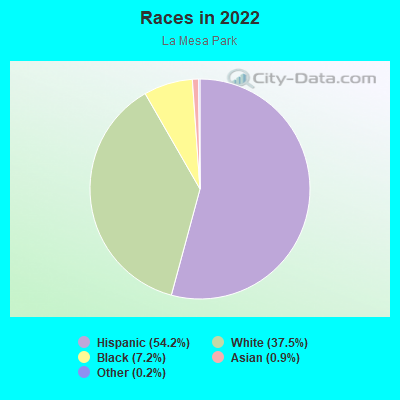
- 23454.2%Hispanic or Latino
- 16237.5%White
- 317.2%Black
- 40.9%Asian
- 10.2%Some other race
Distribution of median household income
![Distribution of median household income]()
- 5Less than $10,000
- 25$10,000 to $19,999
- 27$20,000 to $29,999
- 14$30,000 to $39,999
- 12$40,000 to $49,999
- 21$50,000 to $59,999
- 2$60,000 to $74,999
- 66$75,000 to $99,999
- 2$100,000 to $124,999
- 5$125,000 to $149,999
- 2$150,000 to $199,999
- 1$200,000 or more

Distribution of owner-occupied house/condo value
![Distribution of owner-occupied house/condo value]()
- 56Less than $50,000
- 4$50,000 to $99,999
- 76$100,000 to $149,999
- 15$150,000 to $199,999
- 10$200,000 to $249,999
- 8$250,000 to $299,999
- 4$300,000 to $399,999
- 2$500,000 to $749,999
- 2$1,000,000 or more

Distribution of rent paid by renters
![Distribution of rent paid by renters]()
- 1Less than $100
- 9$100 to $199
- 6$200 to $299
- 2$300 to $399
- 2$400 to $499
- 5$500 to $599
- 3$600 to $699
- 6$700 to $799
- 5$800 to $899
- 8$900 to $999
- 17$1,000 to $1,249
- 4$1,500 to $1,999

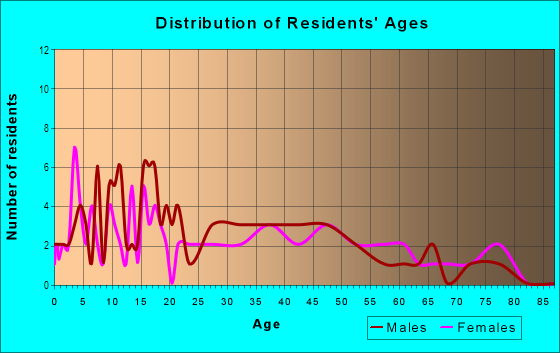
| Males: | 179 |
| Females: | 217 |
Males:
| This neighborhood: | 27.8 years |
| Whole city: | 30.9 years |
| This neighborhood: | 36.1 years |
| Whole city: | 34.5 years |
Average household size:
| La Mesa Park: | 2.3 people |
| Yuma: | 2.5 people |
Percentage of family households:
| La Mesa Park: | 61.6% |
| Yuma: | 50.2% |
| Here: | 66.7% |
| Yuma: | 48.2% |
Percentage of married-couple families with children (among all households):
| La Mesa Park: | 35.3% |
| Yuma: | 27.1% |
Percentage of single-mother households (among all households):
| La Mesa Park: | 2.2% |
| Yuma: | 9.1% |
Percentage of never married males 15 years old and over:
Percentage of never married females 15 years old and over:
| La Mesa Park: | 12.9% |
| Yuma: | 17.2% |
Percentage of never married females 15 years old and over:
| La Mesa Park: | 1.4% |
| city: | 14.0% |
Percentage of people that speak English not well or not at all:
| La Mesa Park: | 7.8% |
| Yuma: | 8.1% |
Percentage of people born in this state:
Percentage of people born in another U.S. state:
Percentage of native residents but born outside the U.S.:
Percentage of foreign born residents:
| Here: | 54.8% |
| Yuma: | 41.5% |
Percentage of people born in another U.S. state:
| La Mesa Park: | 31.5% |
| Yuma: | 36.5% |
Percentage of native residents but born outside the U.S.:
| Here: | 1.0% |
| city: | 2.6% |
Percentage of foreign born residents:
| Here: | 12.6% |
| Yuma: | 19.4% |
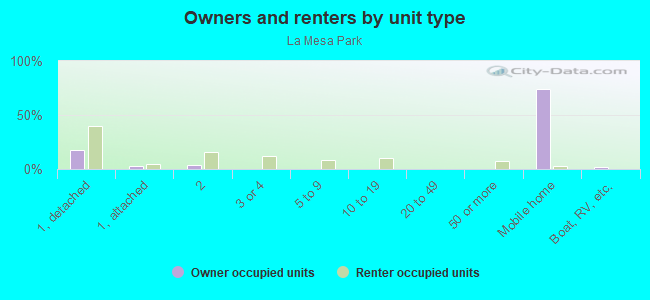
Owner-occupied
Renter-occupied

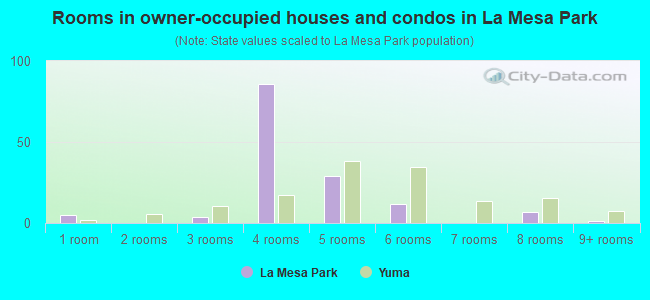
- Rooms in owner-occupied houses and condos in La Mesa Park
- 51 room
- 02 rooms
- 43 rooms
- 864 rooms
- 295 rooms
- 126 rooms
- 07 rooms
- 78 rooms
- 19+ rooms
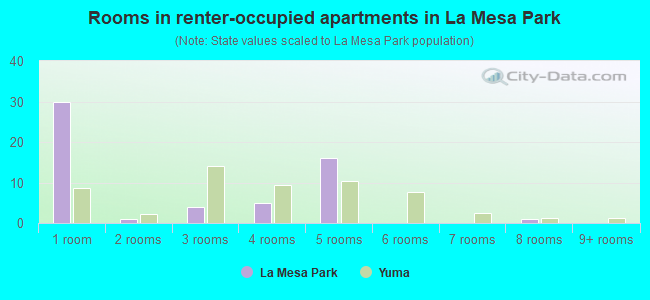
- Rooms in renter-occupied apartments in La Mesa Park
- 301 room
- 12 rooms
- 43 rooms
- 54 rooms
- 165 rooms
- 06 rooms
- 07 rooms
- 18 rooms
- 09+ rooms
Owner-occupied
Renter-occupied
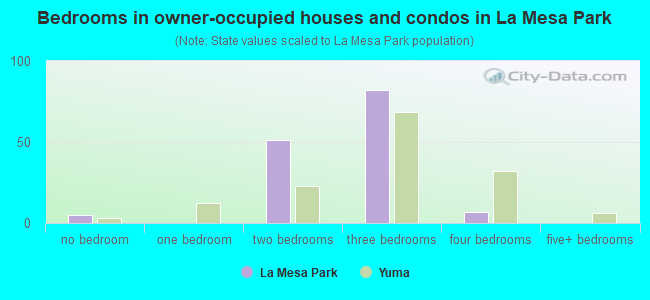
- Bedrooms in owner-occupied houses and condos in La Mesa Park
- 5no bedroom
- 01 bedroom
- 512 bedrooms
- 823 bedrooms
- 74 bedrooms
- 05+ bedrooms
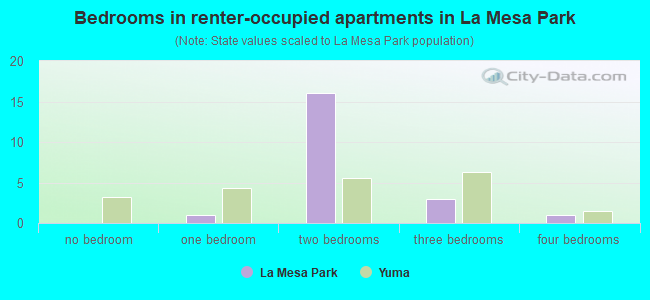
- Bedrooms in renter-occupied apartments in La Mesa Park
- 0no bedroom
- 11 bedroom
- 162 bedrooms
- 33 bedrooms
- 14 bedrooms
- 05+ bedrooms
Average number of cars or other vehicles available in houses/condos:
Average number of cars or other vehicles available in apartments:
| This neighborhood: | 0.1 |
| Yuma: | 2.1 |
Average number of cars or other vehicles available in apartments:
| Here: | 1.1 |
| city: | 1.3 |
Percentage of units with a mortgage:
| La Mesa Park: | 55.3% |
| Yuma: | 59.1% |
Housing prices:
- Average estimated value of detached houses in 2022 (22.8% of all units):
La Mesa Park: $191,598 Yuma: $212,447
- Average estimated value of mobile home in 2022 (77.2% of all units):
La Mesa Park: $92,812 Yuma: $91,509
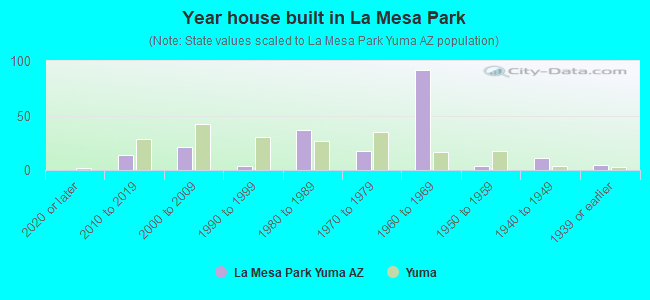
- Year house built in La Mesa Park
- 02020 or later
- 142010 to 2019
- 212000 to 2009
- 41990 to 1999
- 371980 to 1989
- 171970 to 1979
- 921960 to 1969
- 41950 to 1959
- 111940 to 1949
- 51939 or earlier
City-data.com crime index for city in 2020 (higher means more crime):
| City: | 243.7 |
| U.S. average: | 219.5 |
Travel time to work (commute)
![Travel time to work (commute)]()
- 7Less than 5 minutes
- 445 to 9 minutes
- 4310 to 14 minutes
- 2315 to 19 minutes
- 2020 to 24 minutes
- 125 to 29 minutes
- 530 to 34 minutes
- 540 to 44 minutes
- 945 to 59 minutes
- 160 to 89 minutes

Means of transportation to work
![Means of transportation to work]()
- 97.1%173Drove a car alone
- 2.2%4Carpooled
- 1.1%2Bus
- 1.1%2Bicycle
- 0.6%1Worked at home

Time leaving home to go to work
![Time leaving home to go to work]()
- 3312:00 a.m. to 4:59 a.m.
- 15:00 a.m. to 5:29 a.m.
- 105:30 a.m. to 5:59 a.m.
- 126:00 a.m. to 6:29 a.m.
- 146:30 a.m. to 6:59 a.m.
- 187:00 a.m. to 7:29 a.m.
- 247:30 a.m. to 7:59 a.m.
- 138:00 a.m. to 8:29 a.m.
- 28:30 a.m. to 8:59 a.m.
- 19:00 a.m. to 9:59 a.m.
- 710:00 a.m. to 10:59 a.m.
- 111:00 a.m. to 11:59 a.m.
- 612:00 p.m. to 3:59 p.m.
- 64:00 p.m. to 11:59 p.m.

Occupations of males:
- Percentage of males in management occupations (except farmers):
Here: 4.1% city: 7.9%
- Percentage of males in business and financial operations occupations:
Here: 1.1% city: 2.8%
- Percentage of males in architecture and engineering occupations:
Here: 14.4% city: 3.7%
- Percentage of males in education, training, and library occupations:
Here: 3.8% city: 3.4%
- Percentage of males in service occupations:
Here: 5.2% city: 18.5%
- Percentage of males in sales and office occupations:
Here: 54.0% city: 16.9%
- Percentage of males in transportation occupations:
Here: 14.4% city: 9.0%
- Percentage of males in material moving occupations:
Here: 5.3% city: 7.3%
Occupations of females:
- Percentage of females in business and financial operations occupations:
Here: 3.1% city: 3.1%
- Percentage of females in life, physical, and social science occupations:
Here: 6.7% city: 0.5%
- Percentage of females in legal occupations:
Here: 5.2% city: 0.9%
- Percentage of females in education, training, and library occupations:
Here: 69.2% city: 8.8%
- Percentage of females in healthcare practitioners and technical occupations:
Here: 7.6% city: 9.2%
- Percentage of females in service occupations:
Here: 15.3% city: 24.0%
- Percentage of females in sales and office occupations:
Here: 7.7% city: 32.5%
- Percentage of females in farming, fishing, and forestry occupations:
Here: 1.8% city: 0.4%
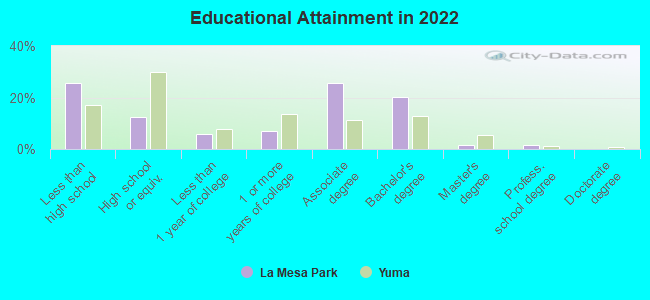
Education in this neighborhood (subdivision or community):
- Percentage of people 3 years and older in K-12 schools:
La Mesa Park: 7.0% Yuma: 18.6%
- Percentage of people 3 years and older in undergraduate colleges:
La Mesa Park: 3.2% Yuma: 4.4%
- Percentage of people 3 years and older in grad. or professional schools:
La Mesa Park: 2.7% Yuma: 0.6%
- Percentage of students K-12 enrolled in private schools:
La Mesa Park: 57.7% Yuma: 14.7%
Percentage of population below poverty level:
| La Mesa Park: | 8.7% |
| Yuma: | 9.8% |
Median year owner moved in (as recorded in 2022):
| La Mesa Park: | 1997 |
| Yuma: | 2015 |
Percentage of married-couple families with both working:
| La Mesa Park: | 82.4% |
| Yuma: | 58.7% |
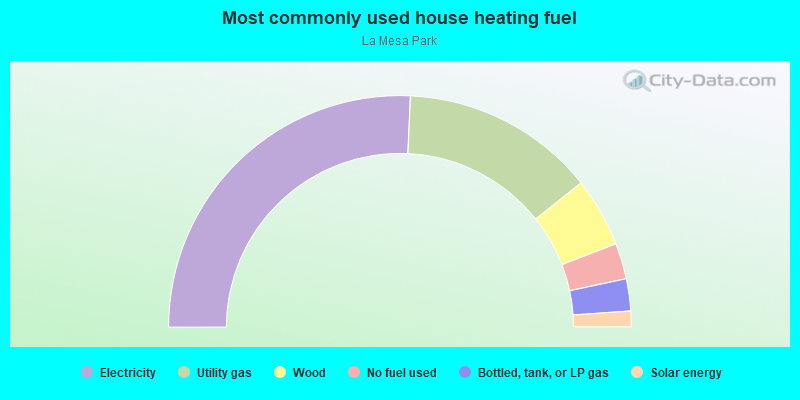
- 51.5%Electricity
- 27.2%Utility gas
- 9.7%Wood
- 5.0%No fuel used
- 4.5%Bottled, tank, or LP gas
- 2.2%Solar energy
Roads and streets:
E 22nd St
Length: 0.23 miles
Directions: E-W, N-S, SE-NW
Address range: 1300 to 1699
Directions: E-W, N-S, SE-NW
Address range: 1300 to 1699
E 23rd St
Length: 0.23 miles
Direction: E-W
Address range: 1300 to 1699
Direction: E-W
Address range: 1300 to 1699
E 22nd Pl
Length: 0.23 miles
Direction: E-W
Address range: 1300 to 1699
Direction: E-W
Address range: 1300 to 1699
E Morrison St
Length: 0.23 miles
Direction: E-W
Address range: 1300 to 1699
Direction: E-W
Address range: 1300 to 1699
E 23rd Pl
Length: 0.23 miles
Direction: E-W
Address range: 1300 to 1699
Direction: E-W
Address range: 1300 to 1699
S Mary Ave
Length: 0.19 miles
Directions: E-W, N-S, SW-NE
Address range: 2200 to 2373
Directions: E-W, N-S, SW-NE
Address range: 2200 to 2373
S Olivia Ave
Length: 0.18 miles
Direction: N-S
Address range: 2200 to 2380
Direction: N-S
Address range: 2200 to 2380