La Bajada neighborhood in Dallas, Texas (TX), 75207, 75212 detailed profile
Settings
X


Business Search - 14 Million verified businesses
Area: 0.565 square miles
Population: 2,806
Population density:
| La Bajada: | 4,968 people per square mile |
| Dallas: | 3,794 people per square mile |

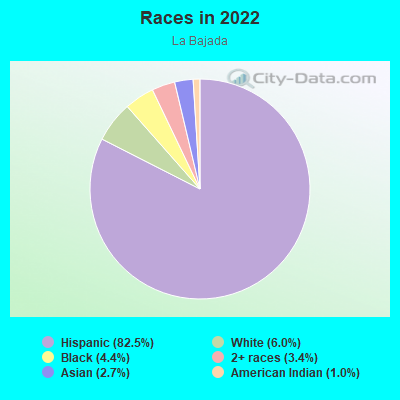
- 2,46482.5%Hispanic or Latino
- 1806.0%White
- 1324.4%Black
- 1023.4%Two or more races
- 802.7%Asian
- 291.0%American Indian
Median household income in 2022:
| La Bajada: | $54,433 |
| Dallas: | $65,400 |
Distribution of median household income
![Distribution of median household income]()
- 65Less than $10,000
- 191$10,000 to $19,999
- 70$20,000 to $29,999
- 156$30,000 to $39,999
- 117$40,000 to $49,999
- 85$50,000 to $59,999
- 95$60,000 to $74,999
- 136$75,000 to $99,999
- 52$100,000 to $124,999
- 102$125,000 to $149,999
- 39$150,000 to $199,999
- 39$200,000 or more

Distribution of owner-occupied house/condo value
![Distribution of owner-occupied house/condo value]()
- 55Less than $50,000
- 117$50,000 to $99,999
- 76$100,000 to $149,999
- 194$150,000 to $199,999
- 40$200,000 to $249,999
- 68$250,000 to $299,999
- 56$300,000 to $399,999
- 32$400,000 to $499,999
- 61$500,000 to $749,999
- 36$750,000 to $999,999
- 17$1,000,000 or more

Distribution of rent paid by renters
![Distribution of rent paid by renters]()
- 28$200 to $299
- 35$500 to $599
- 44$600 to $699
- 7$700 to $799
- 15$800 to $899
- 22$900 to $999
- 120$1,000 to $1,249
- 499$1,250 to $1,499
- 678$1,500 to $1,999
- 243$2,000 or more

Median rent in 2022:
| La Bajada: | $699 |
| Dallas: | $1,208 |
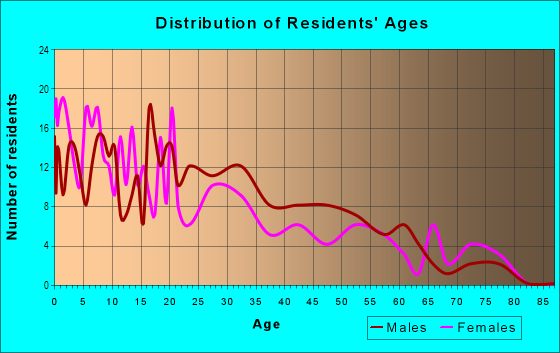
| Males: | 1,593 |
| Females: | 1,212 |
Males:
| This neighborhood: | 26.6 years |
| Whole city: | 32.8 years |
| This neighborhood: | 28.6 years |
| Whole city: | 33.4 years |
Average household size:
| La Bajada: | 3.7 people |
| Dallas: | 2.4 people |
Percentage of family households:
| La Bajada: | 44.0% |
| Dallas: | 42.6% |
| Here: | 35.7% |
| Dallas: | 33.8% |
Percentage of married-couple families with children (among all households):
| La Bajada: | 9.1% |
| Dallas: | 24.8% |
Percentage of single-mother households (among all households):
| La Bajada: | 15.2% |
| Dallas: | 13.3% |
Percentage of never married males 15 years old and over:
Percentage of never married females 15 years old and over:
| La Bajada: | 33.0% |
| Dallas: | 22.1% |
Percentage of never married females 15 years old and over:
| La Bajada: | 19.0% |
| city: | 21.8% |
Percentage of people that speak English not well or not at all:
| La Bajada: | 12.2% |
| Dallas: | 10.7% |
Percentage of people born in this state:
Percentage of people born in another U.S. state:
Percentage of native residents but born outside the U.S.:
Percentage of foreign born residents:
| Here: | 67.8% |
| Dallas: | 52.8% |
Percentage of people born in another U.S. state:
| La Bajada: | 6.1% |
| Dallas: | 22.0% |
Percentage of native residents but born outside the U.S.:
| Here: | 2.1% |
| city: | 1.3% |
Percentage of foreign born residents:
| Here: | 24.1% |
| Dallas: | 23.9% |
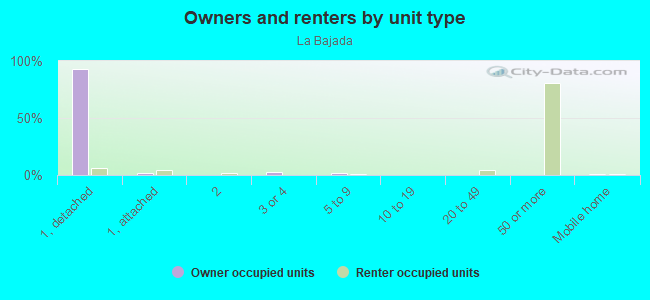
Owner-occupied
Renter-occupied

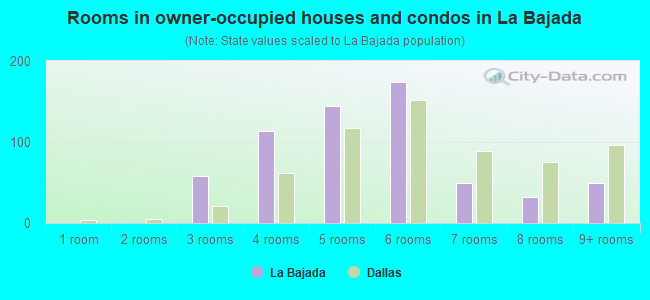
- Rooms in owner-occupied houses and condos in La Bajada
- 01 room
- 02 rooms
- 583 rooms
- 1144 rooms
- 1445 rooms
- 1746 rooms
- 497 rooms
- 328 rooms
- 509+ rooms
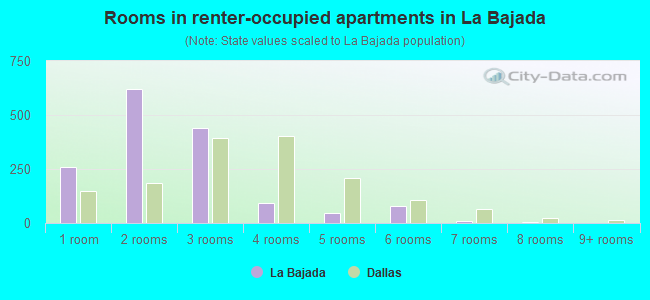
- Rooms in renter-occupied apartments in La Bajada
- 2611 room
- 6212 rooms
- 4393 rooms
- 924 rooms
- 465 rooms
- 786 rooms
- 87 rooms
- 58 rooms
- 09+ rooms
Owner-occupied
Renter-occupied
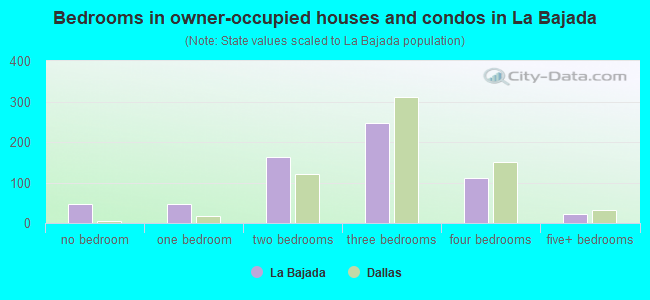
- Bedrooms in owner-occupied houses and condos in La Bajada
- 47no bedroom
- 461 bedroom
- 1622 bedrooms
- 2483 bedrooms
- 1124 bedrooms
- 215+ bedrooms
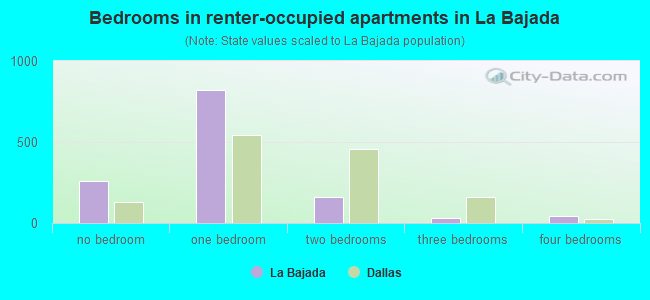
- Bedrooms in renter-occupied apartments in La Bajada
- 261no bedroom
- 8211 bedroom
- 1632 bedrooms
- 283 bedrooms
- 424 bedrooms
- 05+ bedrooms
Average number of cars or other vehicles available in houses/condos:
Average number of cars or other vehicles available in apartments:
| This neighborhood: | 2.3 |
| Dallas: | 2.1 |
Average number of cars or other vehicles available in apartments:
| Here: | 1.6 |
| city: | 1.3 |
Percentage of units with a mortgage:
| La Bajada: | 24.1% |
| Dallas: | 53.9% |
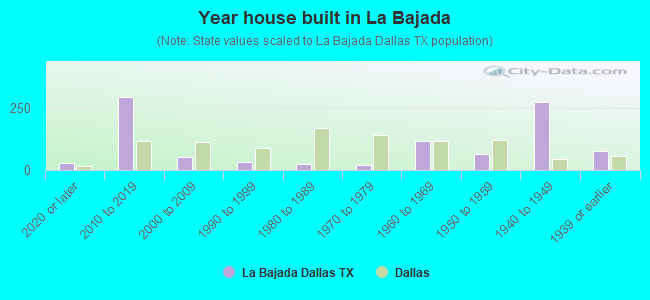
- Year house built in La Bajada
- 292020 or later
- 2912010 to 2019
- 512000 to 2009
- 311990 to 1999
- 241980 to 1989
- 221970 to 1979
- 1161960 to 1969
- 651950 to 1959
- 2741940 to 1949
- 771939 or earlier
City-data.com crime index for city in 2020 (higher means more crime):
| City: | 439.5 |
| U.S. average: | 219.5 |
Travel time to work (commute)
![Travel time to work (commute)]()
- 11Less than 5 minutes
- 265 to 9 minutes
- 6910 to 14 minutes
- 7215 to 19 minutes
- 3620 to 24 minutes
- 2625 to 29 minutes
- 10530 to 34 minutes
- 3335 to 39 minutes
- 2640 to 44 minutes
- 11745 to 59 minutes
- 1360 to 89 minutes
- 490 or more minutes

Means of transportation to work
![Means of transportation to work]()
- 73.7%1,016Drove a car alone
- 17.2%237Carpooled
- 1.3%18Bus
- 1.0%14Bicycle
- 0.1%2Walked
- 8.9%123Worked at home

Time leaving home to go to work
![Time leaving home to go to work]()
- 3012:00 a.m. to 4:59 a.m.
- 225:00 a.m. to 5:29 a.m.
- 225:30 a.m. to 5:59 a.m.
- 576:00 a.m. to 6:29 a.m.
- 216:30 a.m. to 6:59 a.m.
- 1007:00 a.m. to 7:29 a.m.
- 287:30 a.m. to 7:59 a.m.
- 708:00 a.m. to 8:29 a.m.
- 248:30 a.m. to 8:59 a.m.
- 539:00 a.m. to 9:59 a.m.
- 1910:00 a.m. to 10:59 a.m.
- 411:00 a.m. to 11:59 a.m.
- 1312:00 p.m. to 3:59 p.m.
- 114:00 p.m. to 11:59 p.m.

Occupations of males:
- Percentage of males in management occupations (except farmers):
Here: 8.0% city: 10.9%
- Percentage of males in business and financial operations occupations:
Here: 6.6% city: 7.3%
- Percentage of males in computer and mathematical occupations:
Here: 1.1% city: 4.7%
- Percentage of males in community and social services occupations:
Here: 1.6% city: 0.8%
- Percentage of males in education, training, and library occupations:
Here: 1.0% city: 2.3%
- Percentage of males in arts, design, entertainment, sports, and media occupations:
Here: 1.3% city: 2.2%
- Percentage of males in healthcare practitioners and technical occupations:
Here: 6.7% city: 2.7%
- Percentage of males in service occupations:
Here: 6.7% city: 12.3%
- Percentage of males in sales and office occupations:
Here: 24.1% city: 14.9%
- Percentage of males in construction, extraction, and maintenance occupations:
Here: 21.0% city: 15.2%
- Percentage of males in production occupations:
Here: 6.4% city: 5.0%
- Percentage of males in transportation occupations:
Here: 3.1% city: 5.9%
- Percentage of males in material moving occupations:
Here: 5.7% city: 6.2%
Occupations of females:
- Percentage of females in management occupations (except farmers):
Here: 2.7% city: 9.6%
- Percentage of females in business and financial operations occupations:
Here: 4.0% city: 8.4%
- Percentage of females in life, physical, and social science occupations:
Here: 1.2% city: 0.8%
- Percentage of females in community and social services occupations:
Here: 2.7% city: 1.8%
- Percentage of females in education, training, and library occupations:
Here: 9.8% city: 7.1%
- Percentage of females in arts, design, entertainment, sports, and media occupations:
Here: 1.6% city: 2.9%
- Percentage of females in healthcare practitioners and technical occupations:
Here: 5.2% city: 7.7%
- Percentage of females in service occupations:
Here: 32.4% city: 20.5%
- Percentage of females in sales and office occupations:
Here: 36.1% city: 27.7%
- Percentage of females in production occupations:
Here: 1.4% city: 3.6%
- Percentage of females in material moving occupations:
Here: 1.4% city: 3.2%
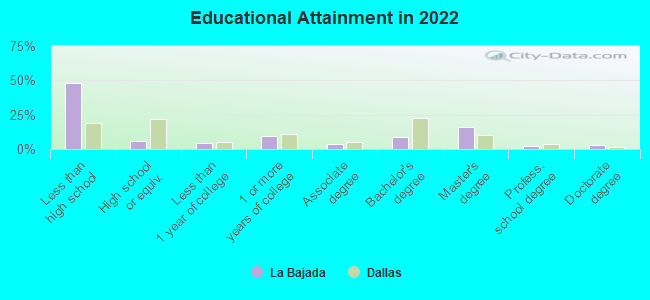
Education in this neighborhood (subdivision or community):
- Percentage of people 3 years and older in K-12 schools:
La Bajada: 32.1% Dallas: 17.3%
- Percentage of people 3 years and older in undergraduate colleges:
La Bajada: 5.9% Dallas: 4.1%
- Percentage of people 3 years and older in grad. or professional schools:
La Bajada: 4.5% Dallas: 1.7%
- Percentage of students K-12 enrolled in private schools:
La Bajada: 5.4% Dallas: 10.8%
Percentage of population below poverty level:
| La Bajada: | 15.7% |
| Dallas: | 17.8% |
Median year owner moved in (as recorded in 2022):
Median year renter moved in (as recorded in 2022):
| La Bajada: | 2000 |
| Dallas: | 2010 |
Median year renter moved in (as recorded in 2022):
| La Bajada: | 2017 |
| Dallas: | 2020 |
Percentage of married-couple families with both working:
| La Bajada: | 211.6% |
| Dallas: | 58.3% |
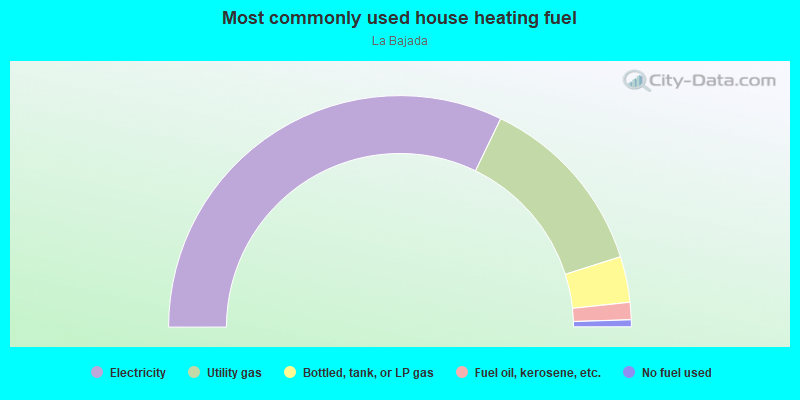
- 64.4%Electricity
- 25.9%Utility gas
- 6.4%Bottled, tank, or LP gas
- 2.4%Fuel oil, kerosene, etc.
- 1.0%No fuel used
Roads and streets:
Sylvan Ave
Length: 0.91 miles
Directions: N-S, SE-NW, SW-NE
Address range: 2700 to 3699
Directions: N-S, SE-NW, SW-NE
Address range: 2700 to 3699
Perimeter Rd
Length: 0.90 miles
Direction: SE-NW
Direction: SE-NW
Singleton Blvd
Length: 0.86 miles
Directions: E-W, SE-NW
Address range: 100 to 809
Directions: E-W, SE-NW
Address range: 100 to 809
Topeka Ave
Length: 0.78 miles
Directions: N-S, SE-NW, SW-NE
Address range: 2800 to 3499
Directions: N-S, SE-NW, SW-NE
Address range: 2800 to 3499
Canada Dr
Length: 0.76 miles
Direction: SE-NW
Address range: 200 to 799
Direction: SE-NW
Address range: 200 to 799
Pueblo St
Length: 0.50 miles
Direction: E-W
Address range: 300 to 799
Direction: E-W
Address range: 300 to 799
Bedford St
Length: 0.45 miles
Direction: E-W
Address range: 300 to 699
Direction: E-W
Address range: 300 to 699
Bataan St
Length: 0.44 miles
Directions: N-S, SW-NE
Address range: 2900 to 3399
Directions: N-S, SW-NE
Address range: 2900 to 3399
Coronet Blvd
Length: 0.41 miles
Directions: E-W, N-S, SW-NE
Address range: 3300 to 3399
Directions: E-W, N-S, SW-NE
Address range: 3300 to 3399
Parvia Ave
Length: 0.41 miles
Directions: N-S, SE-NW
Address range: 2900 to 3399
Directions: N-S, SE-NW
Address range: 2900 to 3399
Toronto St
Length: 0.40 miles
Direction: E-W
Address range: 300 to 599
Direction: E-W
Address range: 300 to 599
Herbert St
Length: 0.37 miles
Direction: N-S
Address range: 2900 to 3399
Direction: N-S
Address range: 2900 to 3399
Continental Ave
Length: 0.31 miles
Directions: E-W, SW-NE
Directions: E-W, SW-NE
N Beckley Ave
Length: 0.23 miles
Directions: E-W, SE-NW, SW-NE
Address range: 2950 to 3099
Directions: E-W, SE-NW, SW-NE
Address range: 2950 to 3099
Beeville St
Length: 0.21 miles
Direction: N-S
Address range: 2900 to 3239
Direction: N-S
Address range: 2900 to 3239
Gulden Ln
Length: 0.19 miles
Direction: N-S
Address range: 3000 to 3199
Direction: N-S
Address range: 3000 to 3199
Pastor St
Length: 0.18 miles
Direction: N-S
Address range: 2900 to 3199
Direction: N-S
Address range: 2900 to 3199
Wake St
Length: 0.15 miles
Direction: N-S
Address range: 3200 to 3399
Direction: N-S
Address range: 3200 to 3399
Brantley St
Length: 0.14 miles
Direction: N-S
Address range: 3300 to 3399
Direction: N-S
Address range: 3300 to 3399
Guam St
Length: 0.12 miles
Direction: E-W
Address range: 300 to 399
Direction: E-W
Address range: 300 to 399
Delta St
Length: 0.11 miles
Direction: E-W
Address range: 400 to 499
Direction: E-W
Address range: 400 to 499
Nomas St
Length: 0.11 miles
Directions: E-W, SE-NW
Address range: 400 to 599
Directions: E-W, SE-NW
Address range: 400 to 599
Mc Broom St
Length: 0.08 miles
Direction: E-W
Address range: 700 to 799
Direction: E-W
Address range: 700 to 799
Morris St
Length: 0.07 miles
Direction: E-W
Address range: 700 to 799
Direction: E-W
Address range: 700 to 799
McPherson St
Length: 0.07 miles
Direction: N-S
Address range: 2722 to 2899
Direction: N-S
Address range: 2722 to 2899
Fairfield St
Length: 0.07 miles
Direction: E-W
Address range: 500 to 599
Direction: E-W
Address range: 500 to 599
Amonette St
Length: 0.06 miles
Direction: N-S
Address range: 2900 to 2999
Direction: N-S
Address range: 2900 to 2999
Other features:
Trinity Riv
Length: 1.08 miles
Directions: E-W, N-S, SE-NW
Directions: E-W, N-S, SE-NW