Koreatown neighborhood in Garden Grove, California (CA), 92841, 92844 detailed profile
Settings
X

Business Search - 14 Million verified businesses
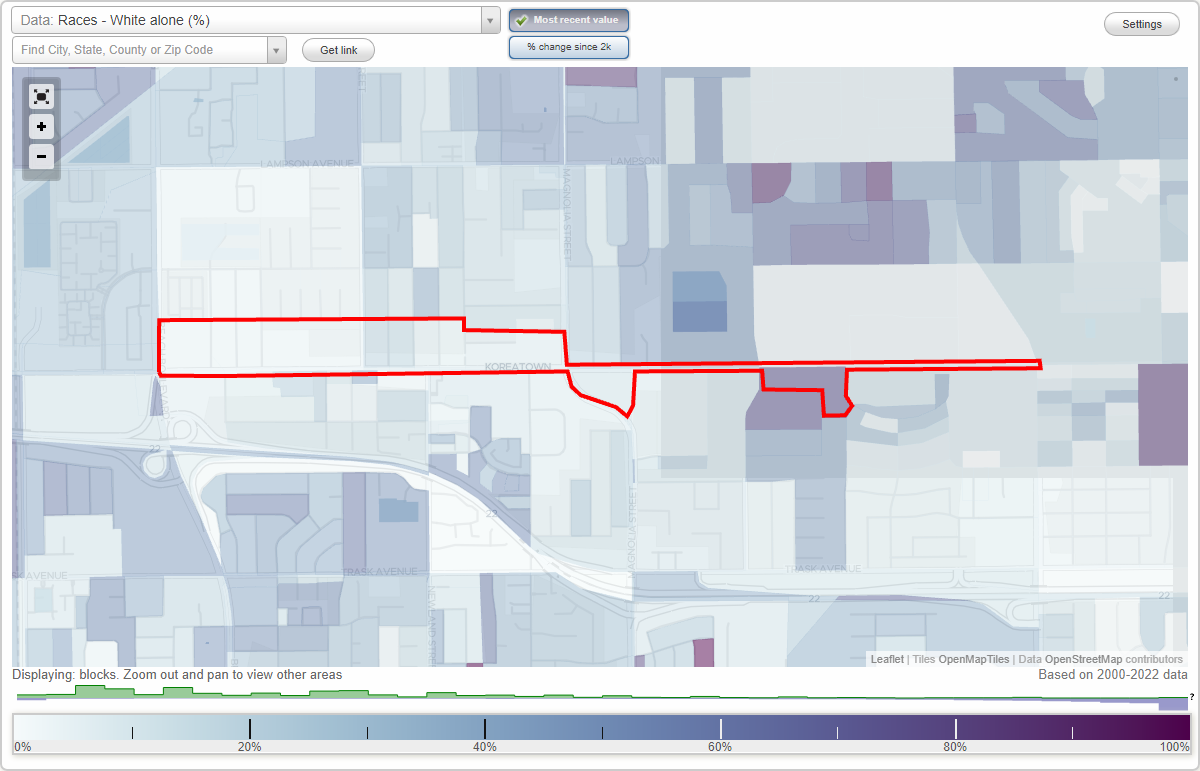
Area: 0.176 square miles
Population: 2,610
Population density:
| Koreatown: | 14,858 people per square mile |
| Garden Grove: | 9,391 people per square mile |

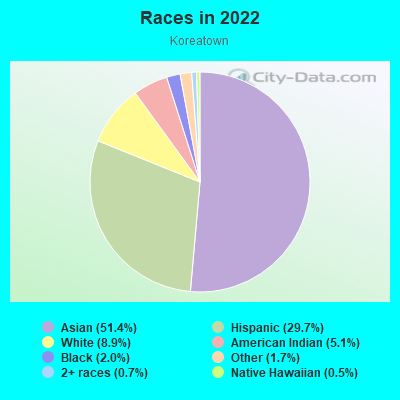
- 1,47451.4%Asian
- 85129.7%Hispanic or Latino
- 2558.9%White
- 1455.1%American Indian
- 562.0%Black
- 501.7%Some other race
- 210.7%Two or more races
- 130.5%Native Hawaiian and Other
Pacific Islander
Distribution of median household income
![Distribution of median household income]()
- 87Less than $10,000
- 69$10,000 to $19,999
- 78$20,000 to $29,999
- 48$30,000 to $39,999
- 61$40,000 to $49,999
- 47$50,000 to $59,999
- 137$60,000 to $74,999
- 71$75,000 to $99,999
- 57$100,000 to $124,999
- 20$125,000 to $149,999
- 89$150,000 to $199,999
- 63$200,000 or more

Distribution of owner-occupied house/condo value
![Distribution of owner-occupied house/condo value]()
- 45Less than $50,000
- 90$50,000 to $99,999
- 23$100,000 to $149,999
- 36$150,000 to $199,999
- 5$200,000 to $249,999
- 7$250,000 to $299,999
- 17$300,000 to $399,999
- 65$400,000 to $499,999
- 135$500,000 to $749,999
- 59$750,000 to $999,999
- 29$1,000,000 or more

Distribution of rent paid by renters
![Distribution of rent paid by renters]()
- 3$100 to $199
- 46$200 to $299
- 34$300 to $399
- 28$400 to $499
- 43$500 to $599
- 21$600 to $699
- 33$700 to $799
- 13$800 to $899
- 6$900 to $999
- 84$1,000 to $1,249
- 70$1,250 to $1,499
- 218$1,500 to $1,999
- 232$2,000 or more

Median rent in 2022:
| Koreatown: | $1,798 |
| Garden Grove: | $1,873 |
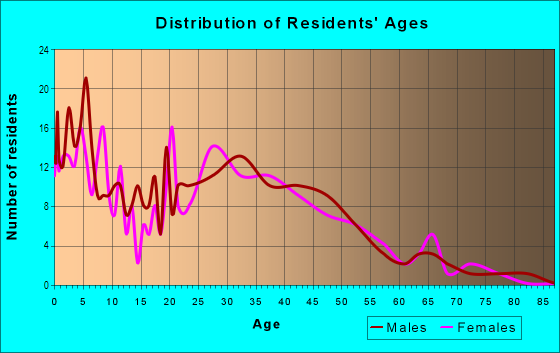
| Males: | 1,179 |
| Females: | 1,430 |
Males:
| This neighborhood: | 41.4 years |
| Whole city: | 38.0 years |
| This neighborhood: | 41.6 years |
| Whole city: | 41.0 years |
Average household size:
| Koreatown: | 3.2 people |
| Garden Grove: | 3.4 people |
Percentage of family households:
| Koreatown: | 55.0% |
| Garden Grove: | 51.1% |
| Here: | 50.8% |
| Garden Grove: | 51.4% |
Percentage of married-couple families with children (among all households):
| Koreatown: | 22.0% |
| Garden Grove: | 20.9% |
Percentage of single-mother households (among all households):
| Koreatown: | 7.5% |
| Garden Grove: | 6.8% |
Percentage of never married males 15 years old and over:
Percentage of never married females 15 years old and over:
| Koreatown: | 19.6% |
| Garden Grove: | 21.6% |
Percentage of never married females 15 years old and over:
| Koreatown: | 21.6% |
| city: | 16.3% |
Percentage of people that speak English not well or not at all:
| Koreatown: | 24.9% |
| Garden Grove: | 19.7% |
Percentage of people born in this state:
Percentage of people born in another U.S. state:
Percentage of native residents but born outside the U.S.:
Percentage of foreign born residents:
| Here: | 41.1% |
| Garden Grove: | 48.0% |
Percentage of people born in another U.S. state:
| Koreatown: | 5.4% |
| Garden Grove: | 5.9% |
Percentage of native residents but born outside the U.S.:
| Here: | 1.8% |
| city: | 1.5% |
Percentage of foreign born residents:
| Here: | 51.6% |
| Garden Grove: | 44.6% |
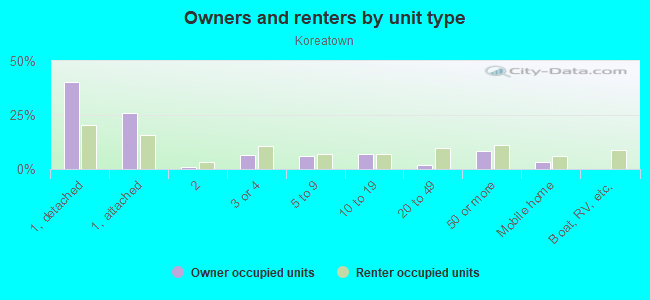
Owner-occupied
Renter-occupied

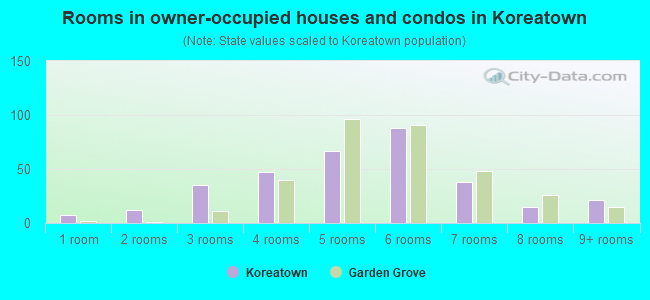
- Rooms in owner-occupied houses and condos in Koreatown
- 71 room
- 122 rooms
- 353 rooms
- 474 rooms
- 675 rooms
- 886 rooms
- 387 rooms
- 158 rooms
- 219+ rooms
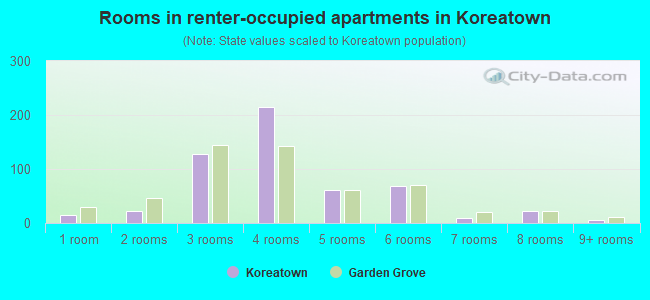
- Rooms in renter-occupied apartments in Koreatown
- 141 room
- 232 rooms
- 1283 rooms
- 2144 rooms
- 625 rooms
- 686 rooms
- 107 rooms
- 238 rooms
- 69+ rooms
Owner-occupied
Renter-occupied
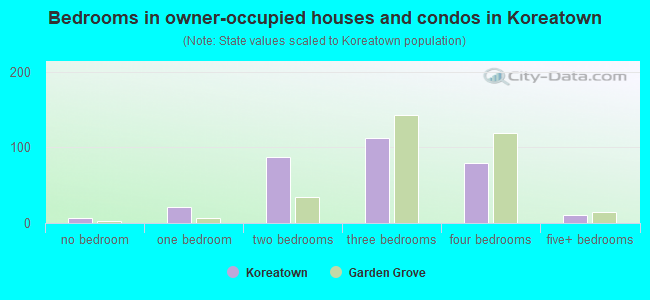
- Bedrooms in owner-occupied houses and condos in Koreatown
- 7no bedroom
- 211 bedroom
- 882 bedrooms
- 1133 bedrooms
- 794 bedrooms
- 115+ bedrooms
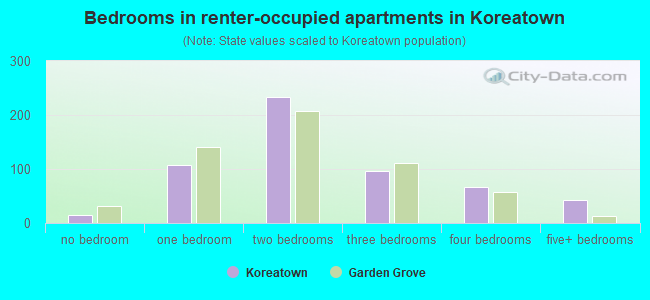
- Bedrooms in renter-occupied apartments in Koreatown
- 14no bedroom
- 1071 bedroom
- 2332 bedrooms
- 963 bedrooms
- 664 bedrooms
- 425+ bedrooms
Average number of cars or other vehicles available in houses/condos:
Average number of cars or other vehicles available in apartments:
| This neighborhood: | |
| Garden Grove: |
Average number of cars or other vehicles available in apartments:
| Here: | 1.9 |
| city: | 1.9 |
Percentage of units with a mortgage:
| Koreatown: | 57.8% |
| Garden Grove: | 62.4% |
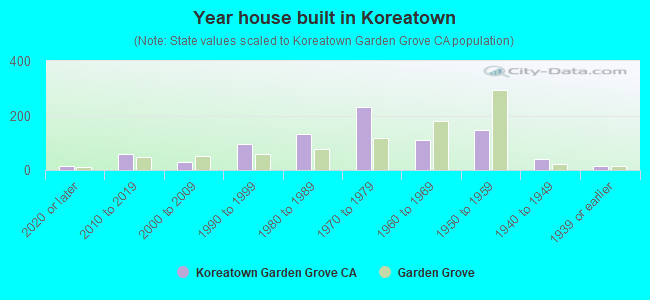
- Year house built in Koreatown
- 142020 or later
- 602010 to 2019
- 312000 to 2009
- 951990 to 1999
- 1311980 to 1989
- 2301970 to 1979
- 1101960 to 1969
- 1481950 to 1959
- 411940 to 1949
- 131939 or earlier
City-data.com crime index for city in 2020 (higher means more crime):
| City: | 205.1 |
| U.S. average: | 219.5 |
Travel time to work (commute)
![Travel time to work (commute)]()
- 6Less than 5 minutes
- 435 to 9 minutes
- 8210 to 14 minutes
- 9815 to 19 minutes
- 14220 to 24 minutes
- 6525 to 29 minutes
- 25530 to 34 minutes
- 2335 to 39 minutes
- 4740 to 44 minutes
- 15145 to 59 minutes
- 8360 to 89 minutes
- 2790 or more minutes

Means of transportation to work
![Means of transportation to work]()
- 78.6%904Drove a car alone
- 15.4%177Carpooled
- 3.8%44Bus
- 2.5%29Motorcycle
- 1.5%17Bicycle
- 0.3%4Walked
- 0.9%10Other means
- 2.1%24Worked at home

Time leaving home to go to work
![Time leaving home to go to work]()
- 7112:00 a.m. to 4:59 a.m.
- 555:00 a.m. to 5:29 a.m.
- 635:30 a.m. to 5:59 a.m.
- 896:00 a.m. to 6:29 a.m.
- 426:30 a.m. to 6:59 a.m.
- 1457:00 a.m. to 7:29 a.m.
- 1037:30 a.m. to 7:59 a.m.
- 1118:00 a.m. to 8:29 a.m.
- 428:30 a.m. to 8:59 a.m.
- 1219:00 a.m. to 9:59 a.m.
- 2710:00 a.m. to 10:59 a.m.
- 1411:00 a.m. to 11:59 a.m.
- 8412:00 p.m. to 3:59 p.m.
- 384:00 p.m. to 11:59 p.m.

Occupations of males:
- Percentage of males in management occupations (except farmers):
Here: 7.1% city: 9.2%
- Percentage of males in business and financial operations occupations:
Here: 4.4% city: 3.5%
- Percentage of males in computer and mathematical occupations:
Here: 2.2% city: 4.6%
- Percentage of males in architecture and engineering occupations:
Here: 4.5% city: 3.9%
- Percentage of males in education, training, and library occupations:
Here: 1.3% city: 2.1%
- Percentage of males in healthcare practitioners and technical occupations:
Here: 2.9% city: 2.1%
- Percentage of males in service occupations:
Here: 15.8% city: 16.3%
- Percentage of males in sales and office occupations:
Here: 16.7% city: 16.3%
- Percentage of males in construction, extraction, and maintenance occupations:
Here: 9.6% city: 9.9%
- Percentage of males in production occupations:
Here: 16.4% city: 13.3%
- Percentage of males in transportation occupations:
Here: 9.1% city: 5.4%
- Percentage of males in material moving occupations:
Here: 4.0% city: 4.4%
Occupations of females:
- Percentage of females in management occupations (except farmers):
Here: 6.7% city: 6.6%
- Percentage of females in business and financial operations occupations:
Here: 4.5% city: 6.4%
- Percentage of females in computer and mathematical occupations:
Here: 1.6% city: 1.7%
- Percentage of females in architecture and engineering occupations:
Here: 1.8% city: 1.4%
- Percentage of females in education, training, and library occupations:
Here: 6.8% city: 6.3%
- Percentage of females in arts, design, entertainment, sports, and media occupations:
Here: 3.0% city: 2.1%
- Percentage of females in healthcare practitioners and technical occupations:
Here: 3.7% city: 6.5%
- Percentage of females in service occupations:
Here: 29.5% city: 27.0%
- Percentage of females in sales and office occupations:
Here: 26.7% city: 26.7%
- Percentage of females in farming, fishing, and forestry occupations:
Here: 1.1% city: 0.4%
- Percentage of females in production occupations:
Here: 13.9% city: 8.6%
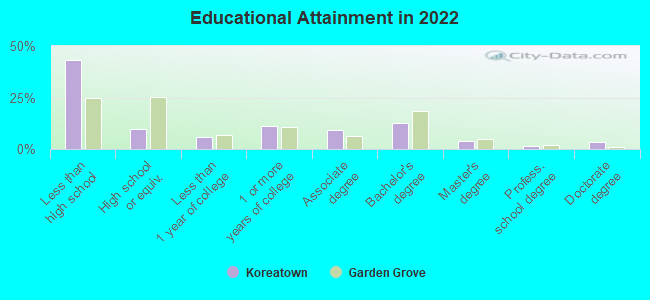
Education in this neighborhood (subdivision or community):
- Percentage of people 3 years and older in K-12 schools:
Koreatown: 19.6% Garden Grove: 15.3%
- Percentage of people 3 years and older in undergraduate colleges:
Koreatown: 7.4% Garden Grove: 6.5%
- Percentage of people 3 years and older in grad. or professional schools:
Koreatown: 2.3% Garden Grove: 1.8%
- Percentage of students K-12 enrolled in private schools:
Koreatown: 16.5% Garden Grove: 4.3%
Percentage of population below poverty level:
| Koreatown: | 12.8% |
| Garden Grove: | 11.3% |
Median year renter moved in (as recorded in 2022):
| Koreatown: | 2014 |
| Garden Grove: | 2018 |
Percentage of married-couple families with both working:
| Koreatown: | 67.4% |
| Garden Grove: | 70.1% |
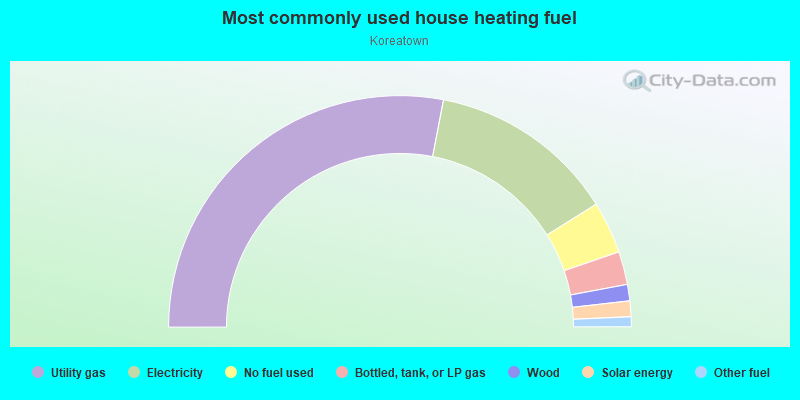
- 56.1%Utility gas
- 26.2%Electricity
- 7.3%No fuel used
- 4.6%Bottled, tank, or LP gas
- 2.3%Wood
- 2.2%Solar energy
- 1.4%Other fuel
Roads and streets:
W Garden Grove Blvd (Garden Grove Blvd)
Length: 2.44 miles
Directions: E-W, N-S
Address range: 8100 to 10166
Directions: E-W, N-S
Address range: 8100 to 10166
Galway St
Length: 0.10 miles
Directions: N-S, SE-NW
Address range: 13000 to 13092
Directions: N-S, SE-NW
Address range: 13000 to 13092
Cannery St
Length: 0.10 miles
Direction: N-S
Address range: 13000 to 13099
Direction: N-S
Address range: 13000 to 13099
Josephine St
Length: 0.10 miles
Direction: N-S
Address range: 12900 to 12999
Direction: N-S
Address range: 12900 to 12999
Stevens Ln
Length: 0.08 miles
Direction: N-S
Address range: 13000 to 13199
Direction: N-S
Address range: 13000 to 13199
Coast St
Length: 0.06 miles
Direction: SE-NW
Address range: 12950 to 12999
Direction: SE-NW
Address range: 12950 to 12999
Court St
Length: 0.04 miles
Direction: N-S
Address range: 12900 to 12999
Direction: N-S
Address range: 12900 to 12999