Knights Bridge neighborhood in San Jose, California (CA), 95132 detailed profile
Settings
X

Business Search - 14 Million verified businesses
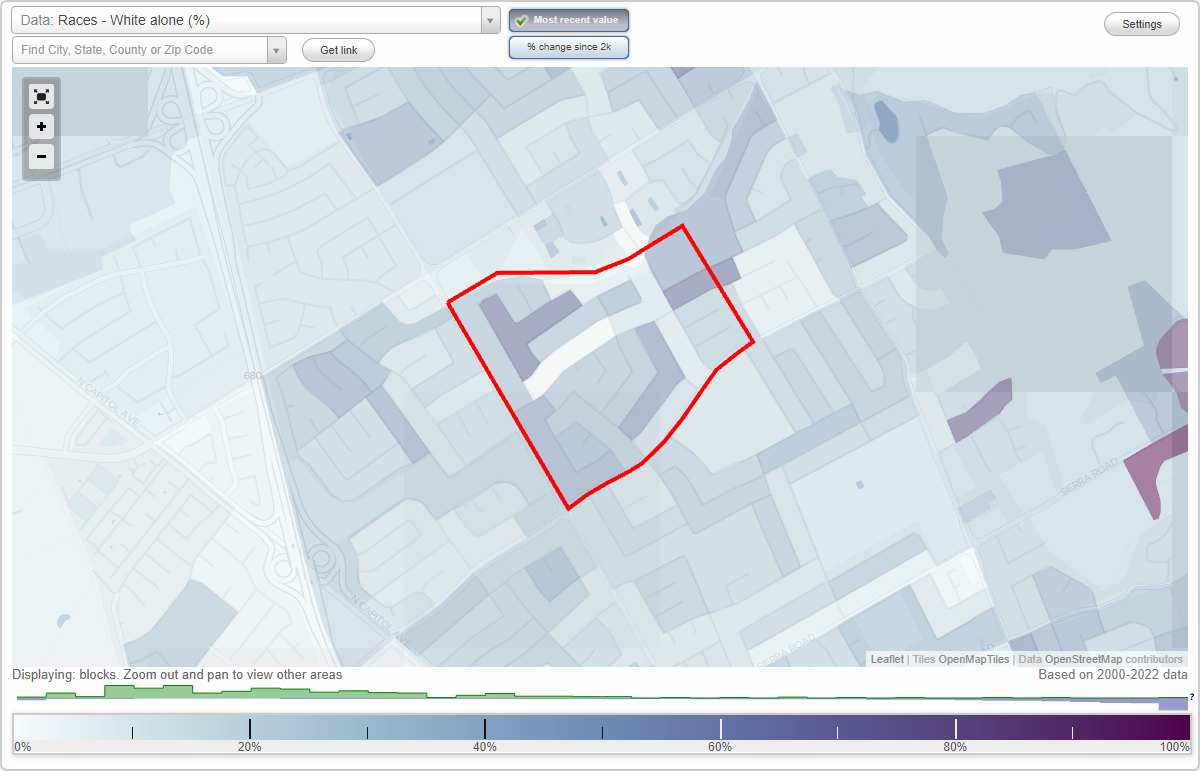
Area: 0.256 square miles
Population: 2,835
Population density:
| Knights Bridge: | 11,087 people per square mile |
| San Jose: | 5,554 people per square mile |

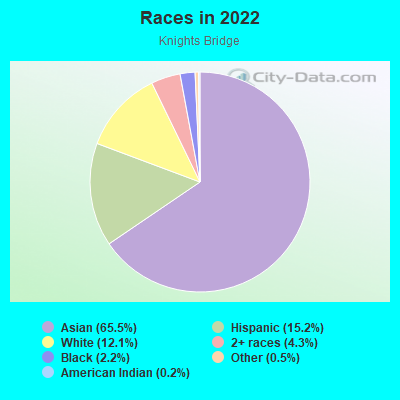
- 1,90165.5%Asian
- 44115.2%Hispanic or Latino
- 35112.1%White
- 1264.3%Two or more races
- 632.2%Black
- 150.5%Some other race
- 70.2%American Indian
Median household income in 2022:
| Knights Bridge: | $170,030 |
| San Jose: | $133,835 |
Distribution of median household income
![Distribution of median household income]()
- 45Less than $10,000
- 40$10,000 to $19,999
- 50$20,000 to $29,999
- 20$30,000 to $39,999
- 71$40,000 to $49,999
- 27$50,000 to $59,999
- 17$60,000 to $74,999
- 54$75,000 to $99,999
- 135$100,000 to $124,999
- 48$125,000 to $149,999
- 165$150,000 to $199,999
- 334$200,000 or more

Distribution of owner-occupied house/condo value
![Distribution of owner-occupied house/condo value]()
- 27Less than $50,000
- 49$100,000 to $149,999
- 27$400,000 to $499,999
- 38$500,000 to $749,999
- 126$750,000 to $999,999
- 531$1,000,000 or more

Distribution of rent paid by renters
![Distribution of rent paid by renters]()
- 20$400 to $499
- 23$1,250 to $1,499
- 47$1,500 to $1,999
- 142$2,000 or more

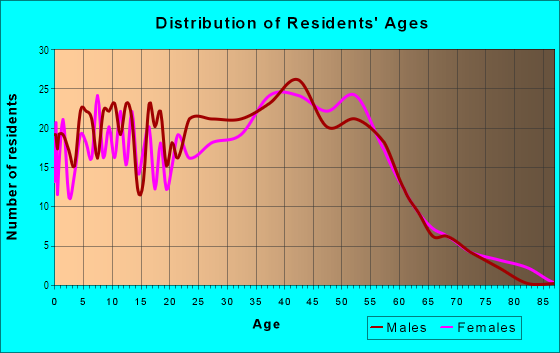
| Males: | 1,545 |
| Females: | 1,290 |
Males:
| This neighborhood: | 40.1 years |
| Whole city: | 37.6 years |
| This neighborhood: | 46.0 years |
| Whole city: | 39.1 years |
Average household size:
| Knights Bridge: | 3.7 people |
| San Jose: | 2.9 people |
Percentage of family households:
| Knights Bridge: | 71.3% |
| San Jose: | 49.9% |
| Here: | 80.2% |
| San Jose: | 53.0% |
Percentage of married-couple families with children (among all households):
| Knights Bridge: | 26.7% |
| San Jose: | 25.8% |
Percentage of single-mother households (among all households):
| Knights Bridge: | 2.5% |
| San Jose: | 5.2% |
Percentage of never married males 15 years old and over:
Percentage of never married females 15 years old and over:
| Knights Bridge: | 21.8% |
| San Jose: | 20.9% |
Percentage of never married females 15 years old and over:
| Knights Bridge: | 11.5% |
| city: | 16.7% |
Percentage of people that speak English not well or not at all:
| Knights Bridge: | 5.7% |
| San Jose: | 11.4% |
Percentage of people born in this state:
Percentage of people born in another U.S. state:
Percentage of native residents but born outside the U.S.:
Percentage of foreign born residents:
| Here: | 36.9% |
| San Jose: | 46.1% |
Percentage of people born in another U.S. state:
| Knights Bridge: | 7.3% |
| San Jose: | 10.4% |
Percentage of native residents but born outside the U.S.:
| Here: | 0.9% |
| city: | 1.7% |
Percentage of foreign born residents:
| Here: | 54.8% |
| San Jose: | 41.8% |
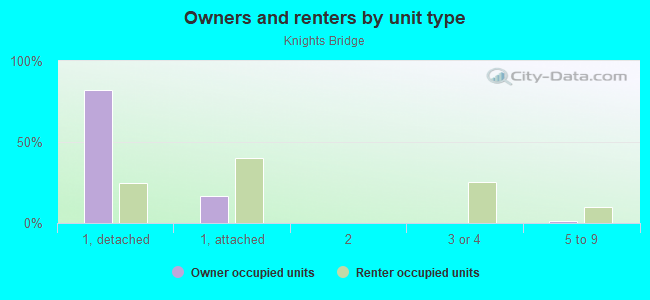
Owner-occupied
Renter-occupied

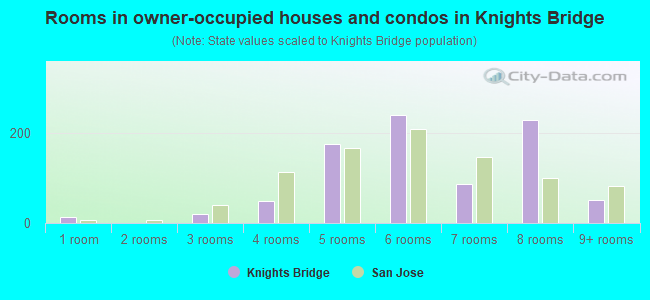
- Rooms in owner-occupied houses and condos in Knights Bridge
- 141 room
- 02 rooms
- 203 rooms
- 484 rooms
- 1745 rooms
- 2396 rooms
- 877 rooms
- 2298 rooms
- 519+ rooms
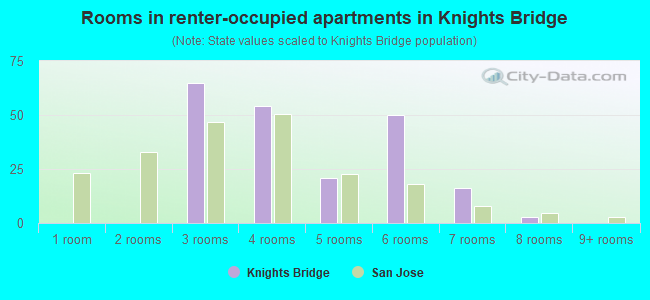
- Rooms in renter-occupied apartments in Knights Bridge
- 01 room
- 02 rooms
- 653 rooms
- 544 rooms
- 215 rooms
- 506 rooms
- 167 rooms
- 38 rooms
- 09+ rooms
Owner-occupied
Renter-occupied
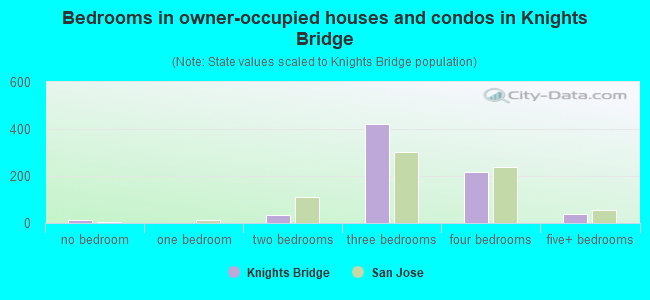
- Bedrooms in owner-occupied houses and condos in Knights Bridge
- 14no bedroom
- 21 bedroom
- 362 bedrooms
- 4203 bedrooms
- 2164 bedrooms
- 395+ bedrooms
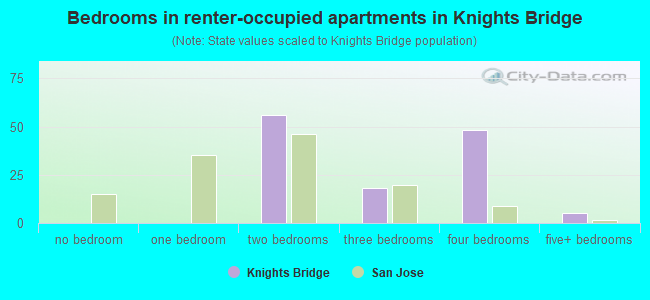
- Bedrooms in renter-occupied apartments in Knights Bridge
- 0no bedroom
- 01 bedroom
- 562 bedrooms
- 183 bedrooms
- 484 bedrooms
- 55+ bedrooms
Average number of cars or other vehicles available in houses/condos:
Average number of cars or other vehicles available in apartments:
| This neighborhood: | 1.6 |
| San Jose: | 2.3 |
Average number of cars or other vehicles available in apartments:
| Here: | 3.4 |
| city: | 1.6 |
Percentage of units with a mortgage:
| Knights Bridge: | 79.7% |
| San Jose: | 66.9% |
Average estimated value of detached houses in 2022 (75.1% of all units):
| Knights Bridge: | $1,223,538 |
| San Jose: | $1,532,815 |
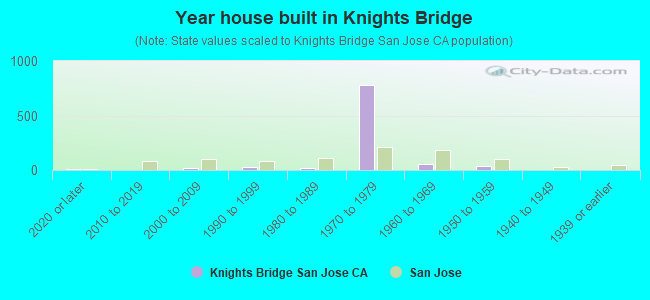
- Year house built in Knights Bridge
- 112020 or later
- 02010 to 2019
- 222000 to 2009
- 291990 to 1999
- 191980 to 1989
- 7801970 to 1979
- 551960 to 1969
- 371950 to 1959
- 21940 to 1949
- 01939 or earlier
City-data.com crime index for city in 2020 (higher means more crime):
| City: | 268.4 |
| U.S. average: | 219.5 |
Travel time to work (commute)
![Travel time to work (commute)]()
- 71Less than 5 minutes
- 215 to 9 minutes
- 11410 to 14 minutes
- 12615 to 19 minutes
- 25420 to 24 minutes
- 9525 to 29 minutes
- 23930 to 34 minutes
- 4335 to 39 minutes
- 9440 to 44 minutes
- 11745 to 59 minutes
- 5060 to 89 minutes
- 2090 or more minutes

Means of transportation to work
![Means of transportation to work]()
- 71.5%1,134Drove a car alone
- 11.0%174Carpooled
- 0.9%14Bus
- 3.0%47Subway or elevated rail
- 0.1%2Long-distance train or commuter rail
- 2.2%35Light rail, streetcar or trolley
- 2.3%37Walked
- 3.5%55Other means
- 13.0%206Worked at home

Time leaving home to go to work
![Time leaving home to go to work]()
- 2612:00 a.m. to 4:59 a.m.
- 215:00 a.m. to 5:29 a.m.
- 475:30 a.m. to 5:59 a.m.
- 766:00 a.m. to 6:29 a.m.
- 956:30 a.m. to 6:59 a.m.
- 927:00 a.m. to 7:29 a.m.
- 907:30 a.m. to 7:59 a.m.
- 2378:00 a.m. to 8:29 a.m.
- 1528:30 a.m. to 8:59 a.m.
- 1689:00 a.m. to 9:59 a.m.
- 2110:00 a.m. to 10:59 a.m.
- 9111:00 a.m. to 11:59 a.m.
- 7012:00 p.m. to 3:59 p.m.
- 394:00 p.m. to 11:59 p.m.

Occupations of males:
- Percentage of males in management occupations (except farmers):
Here: 11.7% city: 13.0%
- Percentage of males in business and financial operations occupations:
Here: 1.3% city: 4.6%
- Percentage of males in computer and mathematical occupations:
Here: 13.9% city: 13.6%
- Percentage of males in architecture and engineering occupations:
Here: 24.4% city: 10.2%
- Percentage of males in education, training, and library occupations:
Here: 3.8% city: 2.8%
- Percentage of males in arts, design, entertainment, sports, and media occupations:
Here: 1.1% city: 1.8%
- Percentage of males in service occupations:
Here: 9.1% city: 12.7%
- Percentage of males in sales and office occupations:
Here: 11.4% city: 12.8%
- Percentage of males in construction, extraction, and maintenance occupations:
Here: 2.1% city: 7.8%
- Percentage of males in production occupations:
Here: 3.5% city: 5.5%
- Percentage of males in transportation occupations:
Here: 2.9% city: 3.6%
Occupations of females:
- Percentage of females in management occupations (except farmers):
Here: 3.7% city: 11.0%
- Percentage of females in business and financial operations occupations:
Here: 6.7% city: 8.6%
- Percentage of females in computer and mathematical occupations:
Here: 13.5% city: 5.4%
- Percentage of females in architecture and engineering occupations:
Here: 9.9% city: 2.8%
- Percentage of females in life, physical, and social science occupations:
Here: 5.2% city: 1.7%
- Percentage of females in education, training, and library occupations:
Here: 6.1% city: 8.1%
- Percentage of females in healthcare practitioners and technical occupations:
Here: 6.5% city: 6.8%
- Percentage of females in service occupations:
Here: 25.6% city: 21.7%
- Percentage of females in sales and office occupations:
Here: 14.1% city: 22.0%
- Percentage of females in production occupations:
Here: 7.6% city: 4.0%
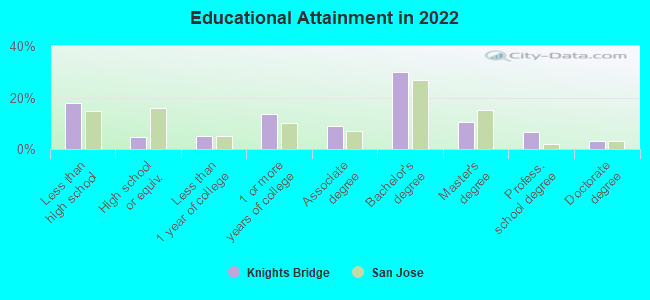
Education in this neighborhood (subdivision or community):
- Percentage of people 3 years and older in K-12 schools:
Knights Bridge: 17.9% San Jose: 16.1%
- Percentage of people 3 years and older in undergraduate colleges:
Knights Bridge: 12.1% San Jose: 6.5%
- Percentage of people 3 years and older in grad. or professional schools:
Knights Bridge: 1.7% San Jose: 2.0%
- Percentage of students K-12 enrolled in private schools:
Knights Bridge: 33.7% San Jose: 14.9%
Percentage of population below poverty level:
| Knights Bridge: | 6.4% |
| San Jose: | 9.0% |
Median year owner moved in (as recorded in 2022):
| Knights Bridge: | 2007 |
| San Jose: | 2008 |
Percentage of married-couple families with both working:
| Knights Bridge: | 73.7% |
| San Jose: | 72.5% |
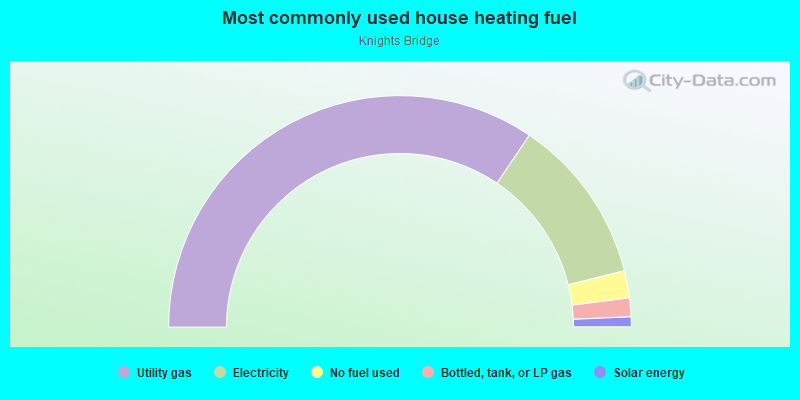
- 68.9%Utility gas
- 23.3%Electricity
- 3.8%No fuel used
- 2.6%Bottled, tank, or LP gas
- 1.4%Solar energy
Roads and streets:
Hostetter Rd
Length: 0.58 miles
Direction: SW-NE
Address range: 2936 to 3190
Direction: SW-NE
Address range: 2936 to 3190
Knights Bridge Rd
Length: 0.47 miles
Directions: E-W, SW-NE
Address range: 2951 to 3149
Directions: E-W, SW-NE
Address range: 2951 to 3149
Balmoral Dr
Length: 0.47 miles
Directions: E-W, N-S, SE-NW, SW-NE
Address range: 3000 to 3199
Directions: E-W, N-S, SE-NW, SW-NE
Address range: 3000 to 3199
Melchester Dr
Length: 0.40 miles
Directions: E-W, N-S, SE-NW, SW-NE
Address range: 3000 to 3199
Directions: E-W, N-S, SE-NW, SW-NE
Address range: 3000 to 3199
Baronscourt Way
Length: 0.38 miles
Directions: E-W, SE-NW, SW-NE
Address range: 3000 to 3199
Directions: E-W, SE-NW, SW-NE
Address range: 3000 to 3199
Westberry Dr
Length: 0.37 miles
Directions: E-W, N-S, SE-NW, SW-NE
Address range: 2600 to 2899
Directions: E-W, N-S, SE-NW, SW-NE
Address range: 2600 to 2899
Messina Dr
Length: 0.34 miles
Directions: N-S, SE-NW
Address range: 1600 to 1865
Directions: N-S, SE-NW
Address range: 1600 to 1865
Castlegate Dr
Length: 0.34 miles
Directions: N-S, SE-NW, SW-NE
Address range: 1700 to 1899
Directions: N-S, SE-NW, SW-NE
Address range: 1700 to 1899
Westhaven Dr
Length: 0.30 miles
Directions: N-S, SE-NW, SW-NE
Address range: 1600 to 1799
Directions: N-S, SE-NW, SW-NE
Address range: 1600 to 1799
St Andrews Pl
Length: 0.28 miles
Directions: N-S, SE-NW, SW-NE
Address range: 1800 to 1899
Directions: N-S, SE-NW, SW-NE
Address range: 1800 to 1899
Queens Crossing Dr
Length: 0.27 miles
Directions: E-W, SE-NW
Address range: 1600 to 1799
Directions: E-W, SE-NW
Address range: 1600 to 1799
Wickham Rd
Length: 0.26 miles
Directions: E-W, SE-NW, SW-NE
Address range: 1600 to 1799
Directions: E-W, SE-NW, SW-NE
Address range: 1600 to 1799
Chippenham Dr
Length: 0.22 miles
Direction: SW-NE
Address range: 3000 to 3099
Direction: SW-NE
Address range: 3000 to 3099
Locksley Park Dr
Length: 0.22 miles
Direction: SE-NW
Address range: 1600 to 1799
Direction: SE-NW
Address range: 1600 to 1799
Isadora Dr
Length: 0.16 miles
Directions: E-W, SW-NE
Directions: E-W, SW-NE
Victor Ct
Length: 0.12 miles
Direction: SW-NE
Address range: 3200 to 3299
Direction: SW-NE
Address range: 3200 to 3299
Stephanie Ct
Length: 0.11 miles
Direction: SW-NE
Address range: 3200 to 3299
Direction: SW-NE
Address range: 3200 to 3299
Queenstown Dr
Length: 0.10 miles
Directions: N-S, SE-NW, SW-NE
Address range: 1700 to 1799
Directions: N-S, SE-NW, SW-NE
Address range: 1700 to 1799
Montford Ct
Length: 0.07 miles
Direction: SE-NW
Address range: 1800 to 1899
Direction: SE-NW
Address range: 1800 to 1899
Bentley Dr
Length: 0.05 miles
Direction: SE-NW
Address range: 1800 to 1899
Direction: SE-NW
Address range: 1800 to 1899
Charnwood Ct
Length: 0.04 miles
Direction: SE-NW
Address range: 1800 to 1899
Direction: SE-NW
Address range: 1800 to 1899
Wickham Ct
Length: 0.03 miles
Direction: SW-NE
Address range: 1700 to 1799
Direction: SW-NE
Address range: 1700 to 1799
Knights Bridge Ct
Length: 0.02 miles
Direction: SE-NW
Direction: SE-NW
Other features:
Berryessa Crk
Length: 0.52 miles
Directions: E-W, N-S, SW-NE
Directions: E-W, N-S, SW-NE