Kelview Heights neighborhood in Midland, Texas (TX), 79705 detailed profile
Settings
X


Business Search - 14 Million verified businesses
Area: 0.185 square miles
Population: 1,581
Population density:
| Kelview Heights: | 8,525 people per square mile |
| Midland: | 2,018 people per square mile |

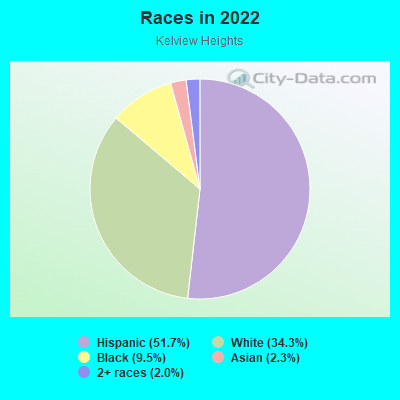
- 88951.7%Hispanic or Latino
- 59134.3%White
- 1649.5%Black
- 402.3%Asian
- 342.0%Two or more races
- 10.06%American Indian
- 10.06%Native Hawaiian and Other
Pacific Islander - 10.06%Some other race
Distribution of median household income
![Distribution of median household income]()
- 340Less than $10,000
- 158$10,000 to $19,999
- 71$20,000 to $29,999
- 117$30,000 to $39,999
- 38$40,000 to $49,999
- 12$50,000 to $59,999
- 23$60,000 to $74,999
- 47$75,000 to $99,999
- 71$100,000 to $124,999
- 50$125,000 to $149,999
- 119$150,000 to $199,999
- 152$200,000 or more

Distribution of owner-occupied house/condo value
![Distribution of owner-occupied house/condo value]()
- 14Less than $50,000
- 107$50,000 to $99,999
- 13$100,000 to $149,999
- 18$150,000 to $199,999
- 63$200,000 to $249,999
- 73$250,000 to $299,999
- 178$300,000 to $399,999
- 6$400,000 to $499,999
- 13$500,000 to $749,999
- 6$750,000 to $999,999
- 65$1,000,000 or more

Distribution of rent paid by renters
![Distribution of rent paid by renters]()
- 112$100 to $199
- 70$200 to $299
- 39$300 to $399
- 33$600 to $699
- 186$700 to $799
- 55$800 to $899
- 46$900 to $999
- 223$1,000 to $1,249
- 18$1,250 to $1,499
- 246$1,500 to $1,999
- 22$2,000 or more

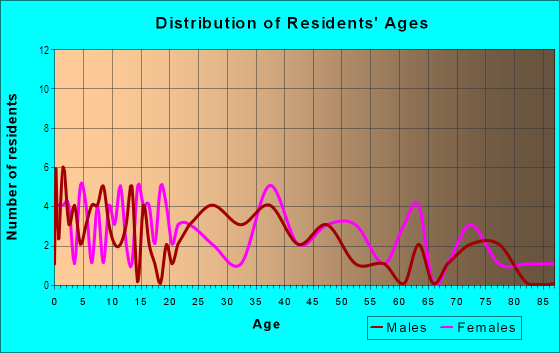
| Males: | 1,062 |
| Females: | 519 |
Males:
| This neighborhood: | 28.9 years |
| Whole city: | 32.3 years |
| This neighborhood: | 35.2 years |
| Whole city: | 33.3 years |
Average household size:
| Kelview Heights: | 2.4 people |
| Midland: | 2.4 people |
Percentage of family households:
| Kelview Heights: | 40.8% |
| Midland: | 52.0% |
| Here: | 22.7% |
| Midland: | 46.4% |
Percentage of married-couple families with children (among all households):
| Kelview Heights: | 15.6% |
| Midland: | 30.9% |
Percentage of single-mother households (among all households):
| Kelview Heights: | 66.0% |
| Midland: | 8.1% |
Percentage of never married males 15 years old and over:
Percentage of never married females 15 years old and over:
| Kelview Heights: | 39.0% |
| Midland: | 15.2% |
Percentage of never married females 15 years old and over:
| Kelview Heights: | 27.8% |
| city: | 14.9% |
Percentage of people that speak English not well or not at all:
| Kelview Heights: | 0.6% |
| Midland: | 5.7% |
Percentage of people born in this state:
Percentage of people born in another U.S. state:
Percentage of native residents but born outside the U.S.:
Percentage of foreign born residents:
| Here: | 78.8% |
| Midland: | 69.5% |
Percentage of people born in another U.S. state:
| Kelview Heights: | 10.0% |
| Midland: | 18.2% |
Percentage of native residents but born outside the U.S.:
| Here: | 0.9% |
| city: | 1.2% |
Percentage of foreign born residents:
| Here: | 10.3% |
| Midland: | 11.2% |
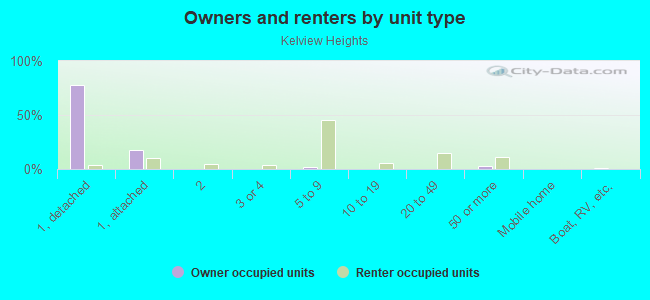
Owner-occupied
Renter-occupied

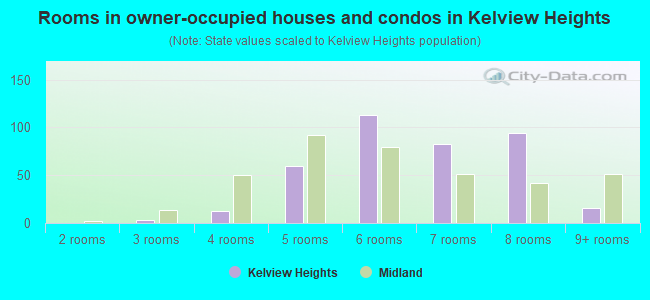
- Rooms in owner-occupied houses and condos in Kelview Heights
- 11 room
- 02 rooms
- 33 rooms
- 134 rooms
- 605 rooms
- 1136 rooms
- 837 rooms
- 948 rooms
- 169+ rooms
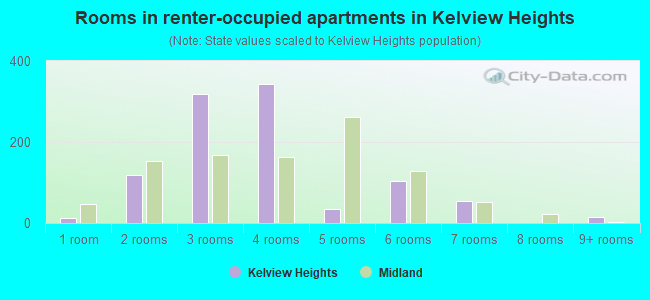
- Rooms in renter-occupied apartments in Kelview Heights
- 131 room
- 1182 rooms
- 3193 rooms
- 3434 rooms
- 355 rooms
- 1036 rooms
- 547 rooms
- 08 rooms
- 149+ rooms
Owner-occupied
Renter-occupied
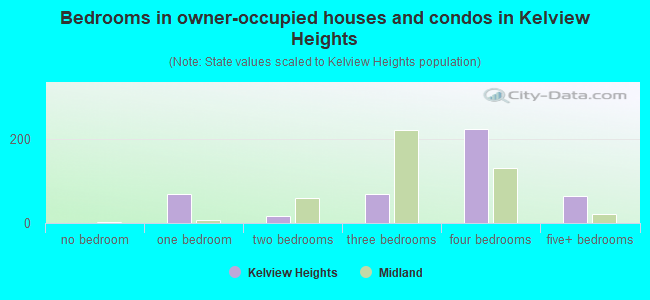
- Bedrooms in owner-occupied houses and condos in Kelview Heights
- 1no bedroom
- 691 bedroom
- 172 bedrooms
- 683 bedrooms
- 2244 bedrooms
- 645+ bedrooms
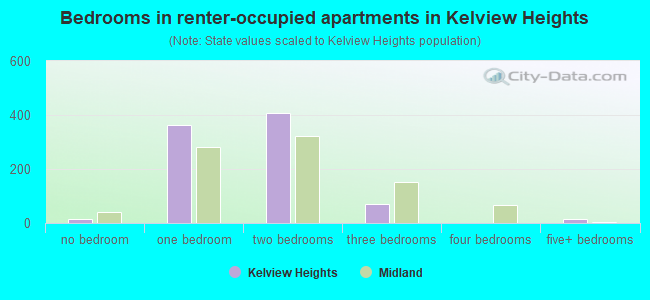
- Bedrooms in renter-occupied apartments in Kelview Heights
- 13no bedroom
- 3641 bedroom
- 4082 bedrooms
- 693 bedrooms
- 04 bedrooms
- 145+ bedrooms
Average number of cars or other vehicles available in houses/condos:
Average number of cars or other vehicles available in apartments:
| This neighborhood: | 2.3 |
| Midland: | 2.1 |
Average number of cars or other vehicles available in apartments:
| Here: | 3.6 |
| city: | 1.4 |
Percentage of units with a mortgage:
| Kelview Heights: | 79.8% |
| Midland: | 58.2% |
Average estimated value of detached houses in 2022 (47.2% of all units):
| Kelview Heights: | $565,302 |
| Texas: | $369,058 |
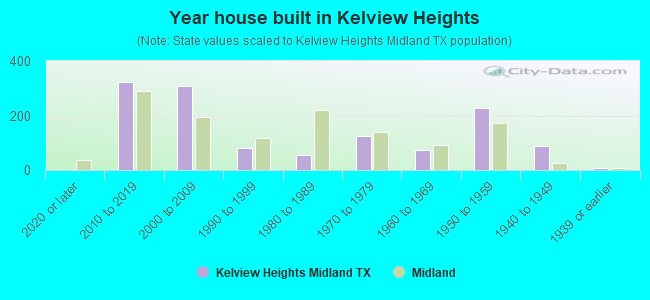
- Year house built in Kelview Heights
- 02020 or later
- 3222010 to 2019
- 3092000 to 2009
- 801990 to 1999
- 561980 to 1989
- 1231970 to 1979
- 741960 to 1969
- 2261950 to 1959
- 891940 to 1949
- 71939 or earlier
City-data.com crime index for city in 2020 (higher means more crime):
| City: | 223.8 |
| U.S. average: | 219.5 |
Travel time to work (commute)
![Travel time to work (commute)]()
- 17Less than 5 minutes
- 755 to 9 minutes
- 15910 to 14 minutes
- 9215 to 19 minutes
- 16120 to 24 minutes
- 325 to 29 minutes
- 9130 to 34 minutes
- 835 to 39 minutes
- 2040 to 44 minutes
- 16345 to 59 minutes
- 160 to 89 minutes
- 590 or more minutes

Means of transportation to work
![Means of transportation to work]()
- 84.2%743Drove a car alone
- 5.9%52Carpooled
- 0.1%1Bus
- 1.2%11Walked
- 9.7%86Worked at home

Time leaving home to go to work
![Time leaving home to go to work]()
- 2112:00 a.m. to 4:59 a.m.
- 25:00 a.m. to 5:29 a.m.
- 405:30 a.m. to 5:59 a.m.
- 446:00 a.m. to 6:29 a.m.
- 846:30 a.m. to 6:59 a.m.
- 577:00 a.m. to 7:29 a.m.
- 1137:30 a.m. to 7:59 a.m.
- 1148:00 a.m. to 8:29 a.m.
- 488:30 a.m. to 8:59 a.m.
- 509:00 a.m. to 9:59 a.m.
- 2110:00 a.m. to 10:59 a.m.
- 3912:00 p.m. to 3:59 p.m.
- 114:00 p.m. to 11:59 p.m.

Occupations of males:
- Percentage of males in management occupations (except farmers):
Here: 12.0% city: 14.6%
- Percentage of males in architecture and engineering occupations:
Here: 4.8% city: 7.5%
- Percentage of males in life, physical, and social science occupations:
Here: 2.2% city: 1.9%
- Percentage of males in community and social services occupations:
Here: 1.2% city: 0.8%
- Percentage of males in legal occupations:
Here: 1.2% city: 1.2%
- Percentage of males in healthcare practitioners and technical occupations:
Here: 3.4% city: 1.2%
- Percentage of males in service occupations:
Here: 14.3% city: 9.5%
- Percentage of males in sales and office occupations:
Here: 22.5% city: 14.8%
- Percentage of males in construction, extraction, and maintenance occupations:
Here: 10.9% city: 15.1%
- Percentage of males in production occupations:
Here: 2.7% city: 7.5%
- Percentage of males in transportation occupations:
Here: 10.6% city: 5.1%
- Percentage of males in material moving occupations:
Here: 8.8% city: 4.8%
Occupations of females:
- Percentage of females in management occupations (except farmers):
Here: 2.5% city: 11.6%
- Percentage of females in business and financial operations occupations:
Here: 5.1% city: 6.9%
- Percentage of females in architecture and engineering occupations:
Here: 11.7% city: 1.8%
- Percentage of females in community and social services occupations:
Here: 1.4% city: 1.7%
- Percentage of females in education, training, and library occupations:
Here: 27.5% city: 11.2%
- Percentage of females in arts, design, entertainment, sports, and media occupations:
Here: 10.8% city: 1.7%
- Percentage of females in healthcare practitioners and technical occupations:
Here: 1.5% city: 6.8%
- Percentage of females in service occupations:
Here: 16.4% city: 16.8%
- Percentage of females in sales and office occupations:
Here: 41.9% city: 33.2%
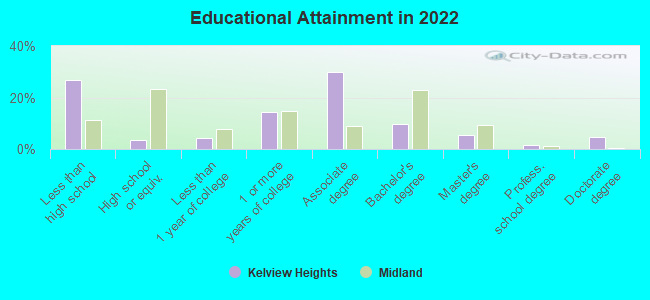
Education in this neighborhood (subdivision or community):
- Percentage of people 3 years and older in K-12 schools:
Kelview Heights: 33.1% Midland: 22.4%
- Percentage of people 3 years and older in undergraduate colleges:
Kelview Heights: 7.8% Midland: 3.0%
- Percentage of people 3 years and older in grad. or professional schools:
Kelview Heights: 8.8% Midland: 1.8%
- Percentage of students K-12 enrolled in private schools:
Kelview Heights: 60.9% Midland: 16.2%
Percentage of population below poverty level:
| Kelview Heights: | 18.8% |
| Midland: | 11.7% |
Median year owner moved in (as recorded in 2022):
| Kelview Heights: | 2006 |
| Midland: | 2015 |
Percentage of married-couple families with both working:
| Kelview Heights: | 56.9% |
| Midland: | 63.2% |
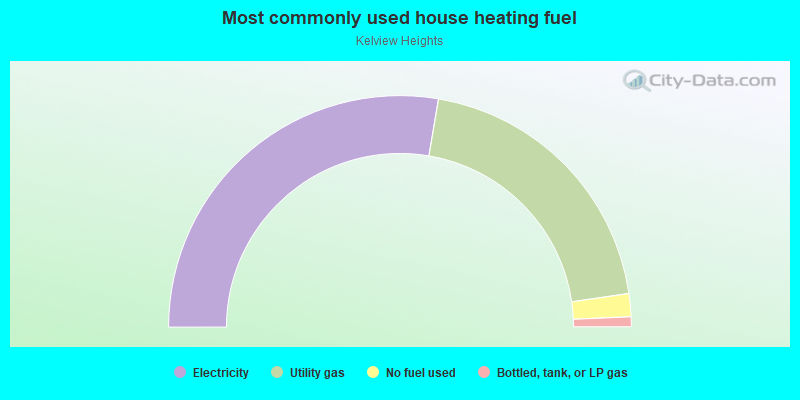
- 55.3%Electricity
- 40.0%Utility gas
- 3.2%No fuel used
- 1.4%Bottled, tank, or LP gas
Highways in this neighborhood:
State Hwy 349 (N Big Spring St)
Length: 0.59 miles
Direction: N-S
Address range: 2300 to 3199
Direction: N-S
Address range: 2300 to 3199
Roads and streets:
Loma Dr
Length: 0.60 miles
Direction: N-S
Address range: 2130 to 3199
Direction: N-S
Address range: 2130 to 3199
W Shandon Ave
Length: 0.27 miles
Direction: E-W
Address range: 300 to 499
Direction: E-W
Address range: 300 to 499
W Scharbauer Dr
Length: 0.24 miles
Directions: E-W, SW-NE
Directions: E-W, SW-NE
W Spruce Ave
Length: 0.09 miles
Directions: E-W, SW-NE
Address range: 300 to 399
Directions: E-W, SW-NE
Address range: 300 to 399
W Dormard Ave
Length: 0.09 miles
Directions: E-W, SE-NW, SW-NE
Address range: 300 to 399
Directions: E-W, SE-NW, SW-NE
Address range: 300 to 399
Neely Ave
Length: 0.09 miles
Direction: E-W
Address range: 300 to 399
Direction: E-W
Address range: 300 to 399
Alta Ave
Length: 0.09 miles
Direction: E-W
Address range: 300 to 399
Direction: E-W
Address range: 300 to 399
W Pecan Ave
Length: 0.09 miles
Direction: E-W
Address range: 300 to 399
Direction: E-W
Address range: 300 to 399
W Pine Ave
Length: 0.09 miles
Direction: E-W
Address range: 300 to 399
Direction: E-W
Address range: 300 to 399
W Dengar Ave
Length: 0.09 miles
Direction: E-W
Address range: 300 to 399
Direction: E-W
Address range: 300 to 399