Jurupa Industrial Park neighborhood in Fontana, California (CA), 92335, 92337 detailed profile
Settings
X

Business Search - 14 Million verified businesses
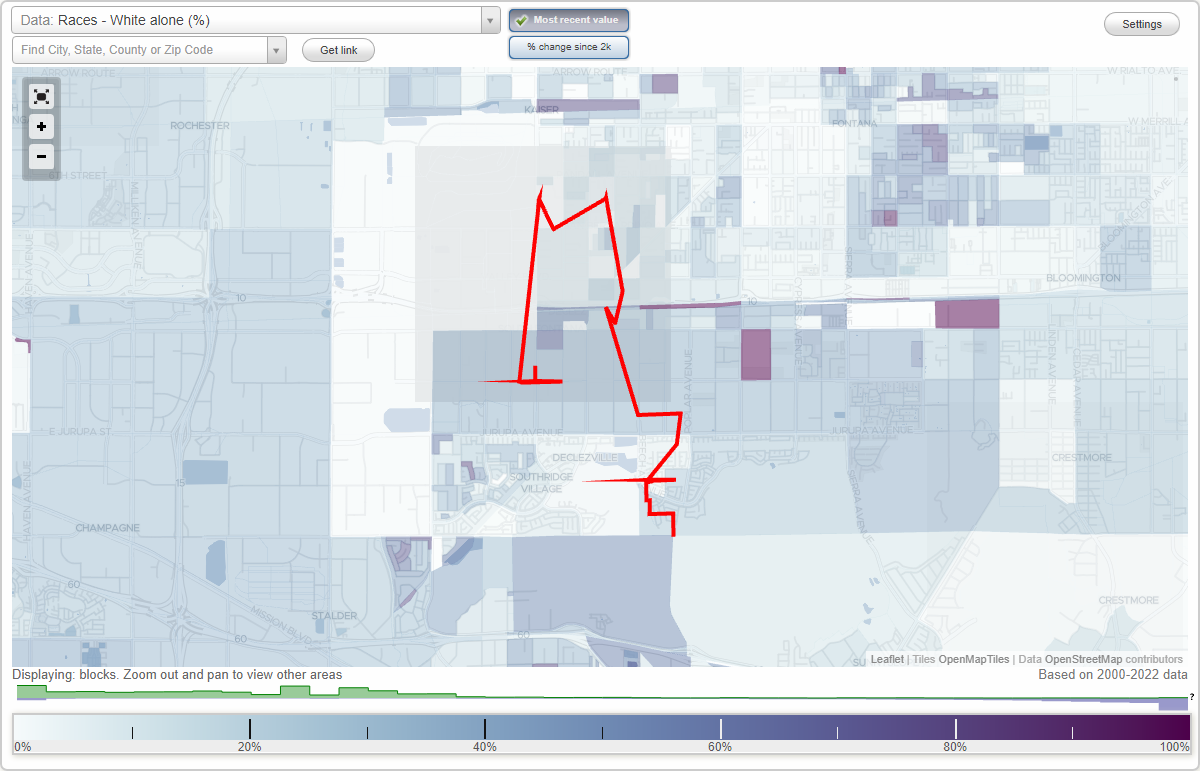
Area: 2.026 square miles
Population: 662
Population density:
| Jurupa Industrial Park: | 327 people per square mile |
| Fontana: | 5,882 people per square mile |

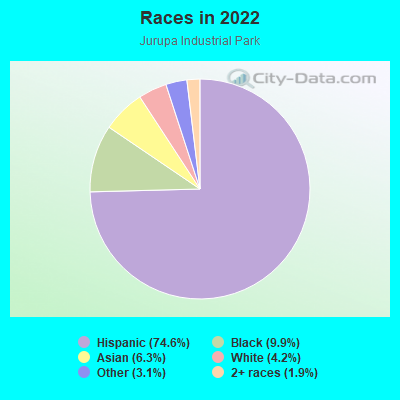
- 60174.6%Hispanic or Latino
- 809.9%Black
- 516.3%Asian
- 344.2%White
- 253.1%Some other race
- 151.9%Two or more races
Distribution of median household income
![Distribution of median household income]()
- 6Less than $10,000
- 36$10,000 to $19,999
- 19$20,000 to $29,999
- 24$30,000 to $39,999
- 7$40,000 to $49,999
- 12$50,000 to $59,999
- 12$60,000 to $74,999
- 35$75,000 to $99,999
- 70$100,000 to $124,999
- 9$125,000 to $149,999
- 24$150,000 to $199,999
- 11$200,000 or more

Distribution of owner-occupied house/condo value
![Distribution of owner-occupied house/condo value]()
- 9Less than $50,000
- 74$50,000 to $99,999
- 17$100,000 to $149,999
- 10$300,000 to $399,999
- 44$400,000 to $499,999
- 23$500,000 to $749,999
- 14$750,000 to $999,999
- 15$1,000,000 or more

Distribution of rent paid by renters
![Distribution of rent paid by renters]()
- 63$600 to $699
- 11$700 to $799
- 13$800 to $899
- 7$900 to $999
- 15$1,000 to $1,249
- 44$1,250 to $1,499
- 8$1,500 to $1,999
- 66$2,000 or more

Median rent in 2022:
| Jurupa Industrial Park: | $534 |
| Fontana: | $1,500 |
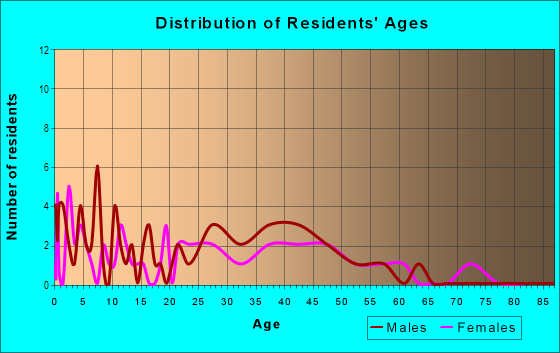
| Males: | 316 |
| Females: | 346 |
Males:
| This neighborhood: | 31.4 years |
| Whole city: | 33.0 years |
| This neighborhood: | 24.8 years |
| Whole city: | 34.9 years |
Average household size:
| Jurupa Industrial Park: | 4.2 people |
| Fontana: | 3.7 people |
Percentage of family households:
| Jurupa Industrial Park: | 78.4% |
| Fontana: | 66.1% |
| Here: | 50.3% |
| Fontana: | 61.8% |
Percentage of married-couple families with children (among all households):
| Jurupa Industrial Park: | 13.5% |
| Fontana: | 20.7% |
Percentage of single-mother households (among all households):
| Jurupa Industrial Park: | 8.6% |
| Fontana: | 3.7% |
Percentage of never married males 15 years old and over:
Percentage of never married females 15 years old and over:
| Jurupa Industrial Park: | 17.3% |
| Fontana: | 24.0% |
Percentage of never married females 15 years old and over:
| Jurupa Industrial Park: | 27.9% |
| city: | 17.8% |
Percentage of people that speak English not well or not at all:
| Jurupa Industrial Park: | 13.4% |
| Fontana: | 10.7% |
Percentage of people born in this state:
Percentage of people born in another U.S. state:
Percentage of native residents but born outside the U.S.:
Percentage of foreign born residents:
| Here: | 66.6% |
| Fontana: | 63.9% |
Percentage of people born in another U.S. state:
| Jurupa Industrial Park: | 2.3% |
| Fontana: | 6.1% |
Percentage of native residents but born outside the U.S.:
| Here: | 1.0% |
| city: | 1.0% |
Percentage of foreign born residents:
| Here: | 30.1% |
| Fontana: | 29.1% |
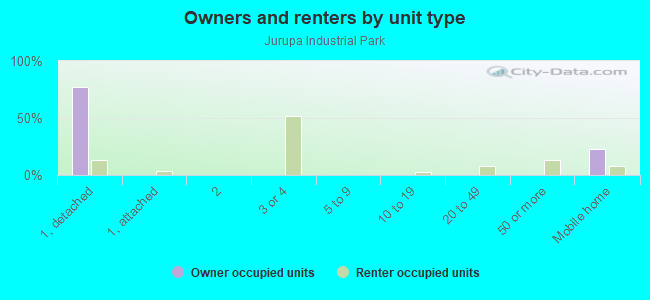
Owner-occupied
Renter-occupied

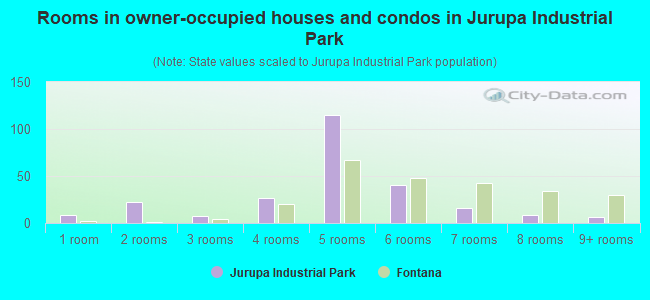
- Rooms in owner-occupied houses and condos in Jurupa Industrial Park
- 81 room
- 222 rooms
- 73 rooms
- 274 rooms
- 1155 rooms
- 406 rooms
- 167 rooms
- 88 rooms
- 69+ rooms
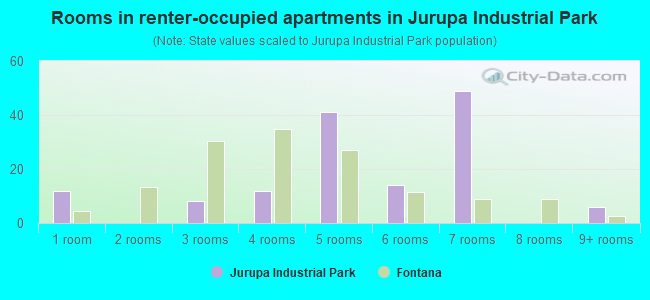
- Rooms in renter-occupied apartments in Jurupa Industrial Park
- 121 room
- 02 rooms
- 83 rooms
- 124 rooms
- 415 rooms
- 146 rooms
- 497 rooms
- 08 rooms
- 69+ rooms
Owner-occupied
Renter-occupied
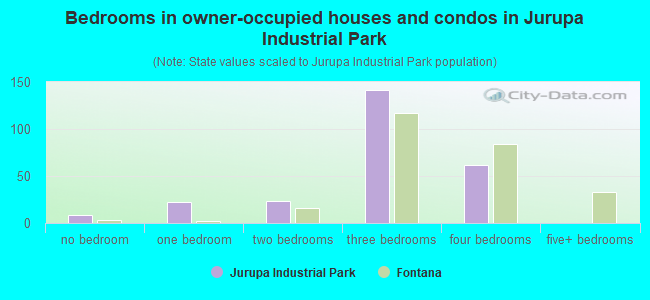
- Bedrooms in owner-occupied houses and condos in Jurupa Industrial Park
- 8no bedroom
- 221 bedroom
- 232 bedrooms
- 1413 bedrooms
- 624 bedrooms
- 05+ bedrooms
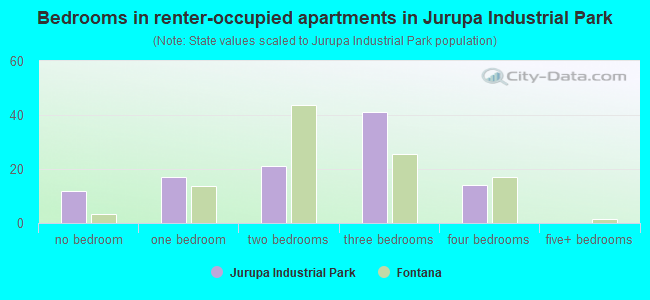
- Bedrooms in renter-occupied apartments in Jurupa Industrial Park
- 12no bedroom
- 171 bedroom
- 212 bedrooms
- 413 bedrooms
- 144 bedrooms
- 05+ bedrooms
Average number of cars or other vehicles available in houses/condos:
Average number of cars or other vehicles available in apartments:
| This neighborhood: | 2.8 |
| Fontana: | 2.7 |
Average number of cars or other vehicles available in apartments:
| Here: | 2.1 |
| city: | 2.1 |
Percentage of units with a mortgage:
| Jurupa Industrial Park: | 56.1% |
| Fontana: | 76.9% |
Housing prices:
- Average estimated value of detached houses in 2022 (67.1% of all units):
Jurupa Industrial Park: $642,881 California: $988,808
- Average estimated value of mobile home in 2022 (22.4% of all units):
Jurupa Industrial Park: $299,253 California: $184,506
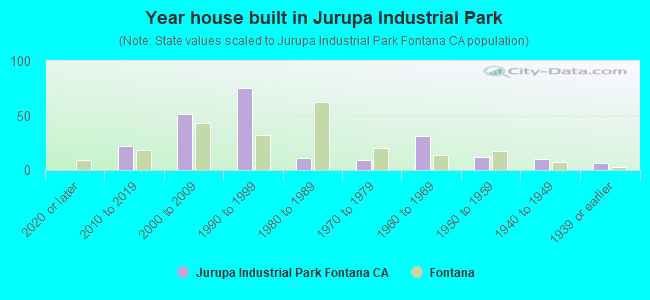
- Year house built in Jurupa Industrial Park
- 02020 or later
- 222010 to 2019
- 512000 to 2009
- 751990 to 1999
- 111980 to 1989
- 91970 to 1979
- 311960 to 1969
- 121950 to 1959
- 101940 to 1949
- 61939 or earlier
City-data.com crime index for city in 2020 (higher means more crime):
| City: | 162.4 |
| U.S. average: | 219.5 |
Travel time to work (commute)
![Travel time to work (commute)]()
- 885 to 9 minutes
- 21710 to 14 minutes
- 21815 to 19 minutes
- 20620 to 24 minutes
- 5825 to 29 minutes
- 14930 to 34 minutes
- 2835 to 39 minutes
- 6540 to 44 minutes
- 545 to 59 minutes
- 9160 to 89 minutes
- 12190 or more minutes

Means of transportation to work
![Means of transportation to work]()
- 71.1%212Drove a car alone
- 47.6%142Carpooled
- 3.0%9Bus
- 1.7%5Bicycle
- 7.7%23Walked
- 4.7%14Other means
- 15.4%46Worked at home

Time leaving home to go to work
![Time leaving home to go to work]()
- 21712:00 a.m. to 4:59 a.m.
- 1525:00 a.m. to 5:29 a.m.
- 505:30 a.m. to 5:59 a.m.
- 1016:00 a.m. to 6:29 a.m.
- 786:30 a.m. to 6:59 a.m.
- 467:00 a.m. to 7:29 a.m.
- 1497:30 a.m. to 7:59 a.m.
- 1538:00 a.m. to 8:29 a.m.
- 518:30 a.m. to 8:59 a.m.
- 279:00 a.m. to 9:59 a.m.
- 2410:00 a.m. to 10:59 a.m.
- 1311:00 a.m. to 11:59 a.m.
- 6212:00 p.m. to 3:59 p.m.
- 1834:00 p.m. to 11:59 p.m.

Occupations of males:
- Percentage of males in management occupations (except farmers):
Here: 6.6% city: 8.4%
- Percentage of males in computer and mathematical occupations:
Here: 2.8% city: 1.8%
- Percentage of males in community and social services occupations:
Here: 2.5% city: 1.0%
- Percentage of males in education, training, and library occupations:
Here: 2.2% city: 2.4%
- Percentage of males in arts, design, entertainment, sports, and media occupations:
Here: 1.6% city: 1.2%
- Percentage of males in healthcare practitioners and technical occupations:
Here: 2.7% city: 2.4%
- Percentage of males in service occupations:
Here: 19.8% city: 12.1%
- Percentage of males in sales and office occupations:
Here: 11.5% city: 14.7%
- Percentage of males in construction, extraction, and maintenance occupations:
Here: 11.2% city: 11.4%
- Percentage of males in production occupations:
Here: 20.6% city: 8.1%
- Percentage of males in transportation occupations:
Here: 5.5% city: 11.3%
- Percentage of males in material moving occupations:
Here: 14.2% city: 14.1%
Occupations of females:
- Percentage of females in management occupations (except farmers):
Here: 3.2% city: 7.4%
- Percentage of females in business and financial operations occupations:
Here: 9.5% city: 5.5%
- Percentage of females in community and social services occupations:
Here: 1.3% city: 3.3%
- Percentage of females in education, training, and library occupations:
Here: 16.9% city: 5.8%
- Percentage of females in healthcare practitioners and technical occupations:
Here: 4.5% city: 8.8%
- Percentage of females in service occupations:
Here: 30.9% city: 20.7%
- Percentage of females in sales and office occupations:
Here: 23.1% city: 29.9%
- Percentage of females in production occupations:
Here: 8.6% city: 3.4%
- Percentage of females in transportation occupations:
Here: 26.5% city: 1.0%
- Percentage of females in material moving occupations:
Here: 18.1% city: 9.9%
Percentage of people 16-64 in Armed Forces:
| Jurupa Industrial Park: | 0.4% |
| Fontana: | 0.2% |
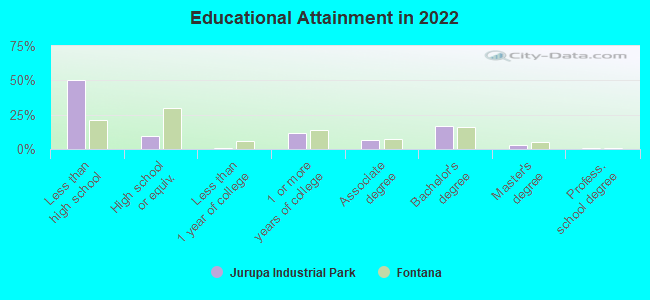
Education in this neighborhood (subdivision or community):
- Percentage of people 3 years and older in K-12 schools:
Jurupa Industrial Park: 35.1% Fontana: 19.9%
- Percentage of people 3 years and older in undergraduate colleges:
Jurupa Industrial Park: 11.7% Fontana: 7.2%
- Percentage of people 3 years and older in grad. or professional schools:
Jurupa Industrial Park: 2.7% Fontana: 1.6%
- Percentage of students K-12 enrolled in private schools:
Jurupa Industrial Park: 2.3% Fontana: 3.5%
Percentage of population below poverty level:
| Jurupa Industrial Park: | 15.1% |
| Fontana: | 8.5% |
Median year owner moved in (as recorded in 2022):
Median year renter moved in (as recorded in 2022):
| Jurupa Industrial Park: | 2008 |
| Fontana: | 2011 |
Median year renter moved in (as recorded in 2022):
| Jurupa Industrial Park: | 2016 |
| Fontana: | 2017 |
Percentage of married-couple families with both working:
| Jurupa Industrial Park: | 44.0% |
| Fontana: | 58.9% |
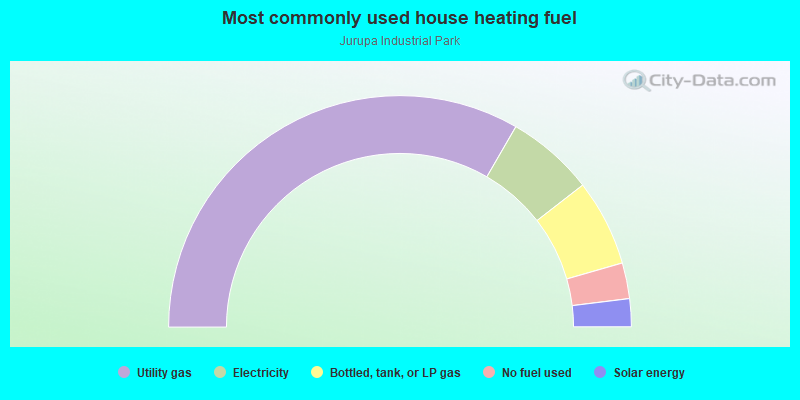
- 66.7%Utility gas
- 12.3%Electricity
- 12.1%Bottled, tank, or LP gas
- 5.0%No fuel used
- 3.9%Solar energy
Limited-access highways (interstate or state) in this neighborhood:
San Bernardino Fwy (I- 10)
Length: 0.13 miles
Direction: E-W
Direction: E-W
Roads and streets:
Slover Ave
Length: 2.11 miles
Direction: E-W
Address range: 14500 to 15899
Direction: E-W
Address range: 14500 to 15899
Santa Ana Ave
Length: 2.06 miles
Direction: E-W
Address range: 14500 to 15899
Direction: E-W
Address range: 14500 to 15899
Elm Ave
Length: 1.02 miles
Direction: N-S
Address range: 10500 to 11299
Direction: N-S
Address range: 10500 to 11299
Beech Ave
Length: 0.88 miles
Direction: N-S
Address range: 10500 to 11199
Direction: N-S
Address range: 10500 to 11199
Poplar Ave
Length: 0.70 miles
Direction: N-S
Address range: 10500 to 11099
Direction: N-S
Address range: 10500 to 11099
Redwood Ave
Length: 0.50 miles
Direction: N-S
Address range: 10500 to 10899
Direction: N-S
Address range: 10500 to 10899
Hemlock Ave
Length: 0.50 miles
Direction: N-S
Address range: 10500 to 10899
Direction: N-S
Address range: 10500 to 10899
Live Oak Ave
Length: 0.50 miles
Direction: N-S
Address range: 10500 to 10899
Direction: N-S
Address range: 10500 to 10899
Cherry Ave
Length: 0.50 miles
Direction: N-S
Address range: 10500 to 10899
Direction: N-S
Address range: 10500 to 10899
Aliso Dr
Length: 0.31 miles
Direction: E-W
Address range: 14500 to 14599
Direction: E-W
Address range: 14500 to 14599
Manila St
Length: 0.31 miles
Direction: E-W
Address range: 15300 to 15499
Direction: E-W
Address range: 15300 to 15499
Valley Blvd
Length: 0.30 miles
Direction: E-W
Address range: 14300 to 14499
Direction: E-W
Address range: 14300 to 14499
Almond Ave
Length: 0.30 miles
Direction: N-S
Address range: 10100 to 10345
Direction: N-S
Address range: 10100 to 10345
I 10 Fwy E
Length: 0.16 miles
Direction: E-W
Direction: E-W
Sultana Ave
Length: 0.04 miles
Direction: N-S
Address range: 10650 to 10699
Direction: N-S
Address range: 10650 to 10699
Railroad features:
Burlington Northern Santa Fe Rlwy
Length: 1.34 miles
Directions: E-W, N-S, SE-NW
Directions: E-W, N-S, SE-NW
Union Pacific RR (Amtrak RR)
Length: 0.11 miles
Direction: E-W
Direction: E-W