Joseph neighborhood in Campbell, California (CA), 95008, 95124 detailed profile
Settings
X

Business Search - 14 Million verified businesses
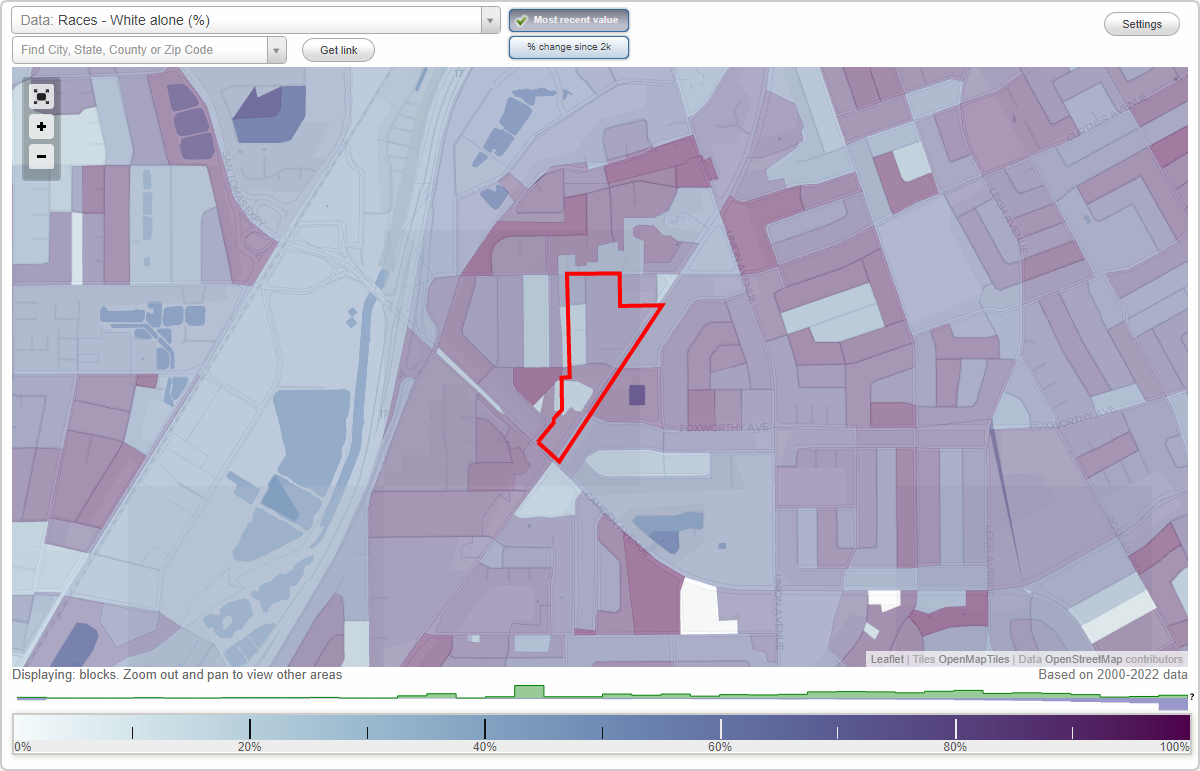
Area: 0.052 square miles
Population: 609
Population density:
| Joseph: | 11,603 people per square mile |
| Campbell: | 7,753 people per square mile |

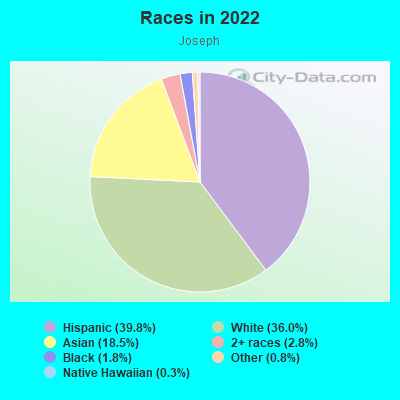
- 24139.8%Hispanic or Latino
- 21836.0%White
- 11218.5%Asian
- 172.8%Two or more races
- 111.8%Black
- 50.8%Some other race
- 20.3%Native Hawaiian and Other
Pacific Islander
Median household income in 2022:
| Joseph: | $132,881 |
| Campbell: | $141,794 |
Distribution of median household income
![Distribution of median household income]()
- 12Less than $10,000
- 26$10,000 to $19,999
- 9$20,000 to $29,999
- 23$30,000 to $39,999
- 17$40,000 to $49,999
- 14$50,000 to $59,999
- 12$60,000 to $74,999
- 37$75,000 to $99,999
- 9$100,000 to $124,999
- 14$125,000 to $149,999
- 54$150,000 to $199,999
- 56$200,000 or more

Distribution of owner-occupied house/condo value
![Distribution of owner-occupied house/condo value]()
- 2$50,000 to $99,999
- 2$300,000 to $399,999
- 14$500,000 to $749,999
- 13$750,000 to $999,999
- 52$1,000,000 or more

Distribution of rent paid by renters
![Distribution of rent paid by renters]()
- 9$300 to $399
- 2$700 to $799
- 2$900 to $999
- 14$1,000 to $1,249
- 18$1,250 to $1,499
- 29$1,500 to $1,999
- 100$2,000 or more

Median rent in 2022:
| Joseph: | $2,359 |
| Campbell: | $2,001 |
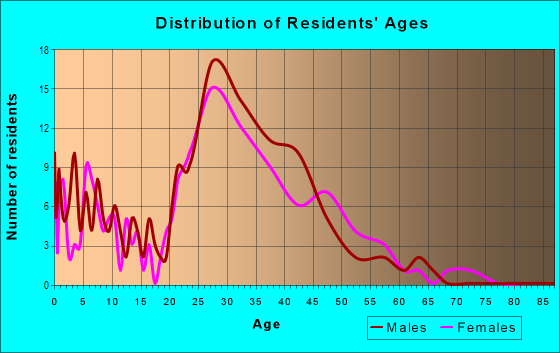
| Males: | 329 |
| Females: | 280 |
Males:
| This neighborhood: | 36.3 years |
| Whole city: | 38.6 years |
| This neighborhood: | 38.7 years |
| Whole city: | 40.0 years |
Average household size:
| Joseph: | 2.7 people |
| Campbell: | 2.5 people |
Percentage of family households:
| Joseph: | 63.6% |
| Campbell: | 50.9% |
| Here: | 50.3% |
| Campbell: | 50.4% |
Percentage of married-couple families with children (among all households):
| Joseph: | 26.9% |
| Campbell: | 31.4% |
Percentage of single-mother households (among all households):
| Joseph: | 5.1% |
| Campbell: | 5.4% |
Percentage of never married males 15 years old and over:
Percentage of never married females 15 years old and over:
| Joseph: | 22.8% |
| Campbell: | 16.6% |
Percentage of never married females 15 years old and over:
| Joseph: | 9.9% |
| city: | 15.8% |
Percentage of people that speak English not well or not at all:
| Joseph: | 3.6% |
| Campbell: | 5.3% |
Percentage of people born in this state:
Percentage of people born in another U.S. state:
Percentage of native residents but born outside the U.S.:
Percentage of foreign born residents:
| Here: | 57.4% |
| Campbell: | 51.3% |
Percentage of people born in another U.S. state:
| Joseph: | 19.2% |
| Campbell: | 16.6% |
Percentage of native residents but born outside the U.S.:
| Here: | 0.8% |
| city: | 1.1% |
Percentage of foreign born residents:
| Here: | 22.6% |
| Campbell: | 31.1% |
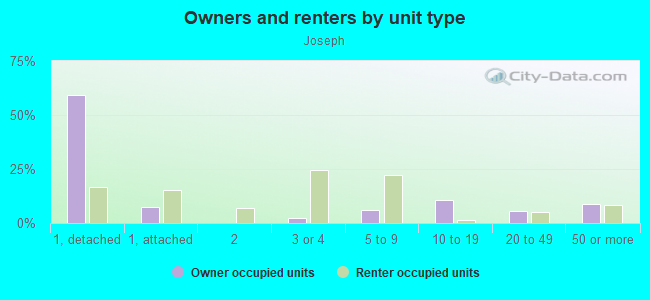
Owner-occupied
Renter-occupied

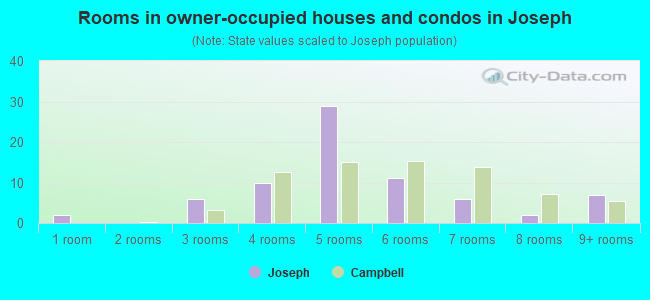
- Rooms in owner-occupied houses and condos in Joseph
- 21 room
- 02 rooms
- 63 rooms
- 104 rooms
- 295 rooms
- 116 rooms
- 67 rooms
- 28 rooms
- 79+ rooms
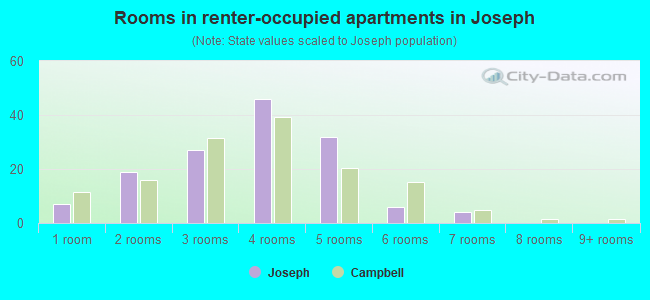
- Rooms in renter-occupied apartments in Joseph
- 71 room
- 192 rooms
- 273 rooms
- 464 rooms
- 325 rooms
- 66 rooms
- 47 rooms
- 08 rooms
- 09+ rooms
Owner-occupied
Renter-occupied
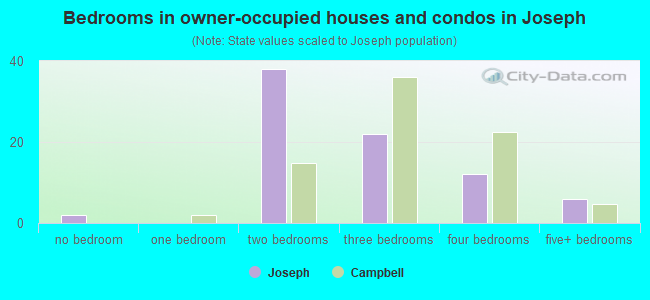
- Bedrooms in owner-occupied houses and condos in Joseph
- 2no bedroom
- 01 bedroom
- 382 bedrooms
- 223 bedrooms
- 124 bedrooms
- 65+ bedrooms
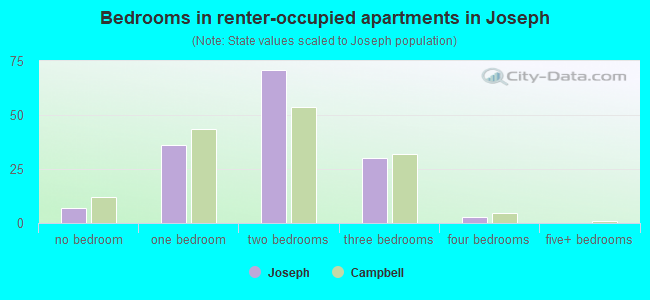
- Bedrooms in renter-occupied apartments in Joseph
- 7no bedroom
- 361 bedroom
- 712 bedrooms
- 303 bedrooms
- 34 bedrooms
- 05+ bedrooms
Average number of cars or other vehicles available in houses/condos:
Average number of cars or other vehicles available in apartments:
| This neighborhood: | 2.0 |
| Campbell: | 2.2 |
Average number of cars or other vehicles available in apartments:
| Here: | 1.9 |
| city: | 1.6 |
Percentage of units with a mortgage:
| Joseph: | 85.8% |
| Campbell: | 68.8% |
Housing prices:
- Average estimated value of detached houses in 2022 (32.2% of all units):
Joseph: $1,572,771 Campbell: $1,768,898
- Average estimated value of townhouses or other attached units in 2022 (6.9% of all units):
This neighborhood: $5,029,121 city: $1,144,684
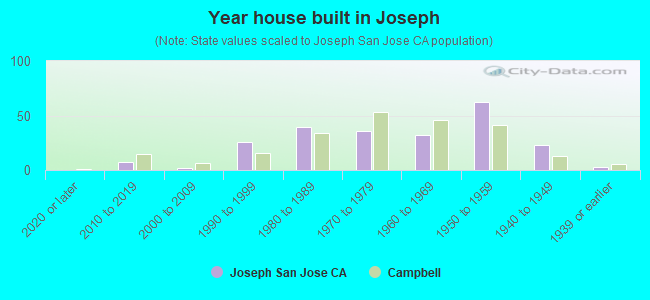
- Year house built in Joseph
- 02020 or later
- 72010 to 2019
- 22000 to 2009
- 261990 to 1999
- 391980 to 1989
- 361970 to 1979
- 321960 to 1969
- 621950 to 1959
- 231940 to 1949
- 31939 or earlier
City-data.com crime index for city in 2020 (higher means more crime):
| City: | 246.0 |
| U.S. average: | 219.5 |
Travel time to work (commute)
![Travel time to work (commute)]()
- 3Less than 5 minutes
- 235 to 9 minutes
- 3610 to 14 minutes
- 6515 to 19 minutes
- 3920 to 24 minutes
- 1425 to 29 minutes
- 5230 to 34 minutes
- 735 to 39 minutes
- 840 to 44 minutes
- 3745 to 59 minutes
- 1760 to 89 minutes
- 690 or more minutes

Means of transportation to work
![Means of transportation to work]()
- 72.2%273Drove a car alone
- 12.2%46Carpooled
- 0.3%1Bus
- 1.6%6Long-distance train or commuter rail
- 2.1%8Motorcycle
- 1.3%5Bicycle
- 1.9%7Walked
- 2.4%9Other means
- 7.7%29Worked at home

Time leaving home to go to work
![Time leaving home to go to work]()
- 1212:00 a.m. to 4:59 a.m.
- 55:00 a.m. to 5:29 a.m.
- 75:30 a.m. to 5:59 a.m.
- 56:00 a.m. to 6:29 a.m.
- 116:30 a.m. to 6:59 a.m.
- 297:00 a.m. to 7:29 a.m.
- 317:30 a.m. to 7:59 a.m.
- 608:00 a.m. to 8:29 a.m.
- 328:30 a.m. to 8:59 a.m.
- 399:00 a.m. to 9:59 a.m.
- 2010:00 a.m. to 10:59 a.m.
- 411:00 a.m. to 11:59 a.m.
- 2512:00 p.m. to 3:59 p.m.
- 194:00 p.m. to 11:59 p.m.

Occupations of males:
- Percentage of males in management occupations (except farmers):
Here: 3.3% city: 17.3%
- Percentage of males in business and financial operations occupations:
Here: 6.4% city: 6.0%
- Percentage of males in computer and mathematical occupations:
Here: 8.6% city: 13.7%
- Percentage of males in architecture and engineering occupations:
Here: 13.9% city: 10.9%
- Percentage of males in life, physical, and social science occupations:
Here: 5.3% city: 1.5%
- Percentage of males in education, training, and library occupations:
Here: 4.5% city: 2.6%
- Percentage of males in arts, design, entertainment, sports, and media occupations:
Here: 6.0% city: 3.7%
- Percentage of males in healthcare practitioners and technical occupations:
Here: 1.4% city: 2.1%
- Percentage of males in service occupations:
Here: 8.8% city: 9.6%
- Percentage of males in sales and office occupations:
Here: 15.5% city: 13.2%
- Percentage of males in construction, extraction, and maintenance occupations:
Here: 9.5% city: 7.7%
- Percentage of males in production occupations:
Here: 1.0% city: 3.0%
- Percentage of males in transportation occupations:
Here: 4.0% city: 1.8%
- Percentage of males in material moving occupations:
Here: 3.0% city: 3.4%
Occupations of females:
- Percentage of females in management occupations (except farmers):
Here: 14.5% city: 15.9%
- Percentage of females in business and financial operations occupations:
Here: 3.7% city: 9.1%
- Percentage of females in architecture and engineering occupations:
Here: 7.4% city: 3.7%
- Percentage of females in community and social services occupations:
Here: 2.1% city: 4.1%
- Percentage of females in education, training, and library occupations:
Here: 4.7% city: 9.6%
- Percentage of females in arts, design, entertainment, sports, and media occupations:
Here: 2.2% city: 2.6%
- Percentage of females in healthcare practitioners and technical occupations:
Here: 8.1% city: 5.7%
- Percentage of females in service occupations:
Here: 16.9% city: 13.1%
- Percentage of females in sales and office occupations:
Here: 24.3% city: 24.6%
- Percentage of females in production occupations:
Here: 10.0% city: 0.6%
- Percentage of females in transportation occupations:
Here: 5.5% city: 0.8%
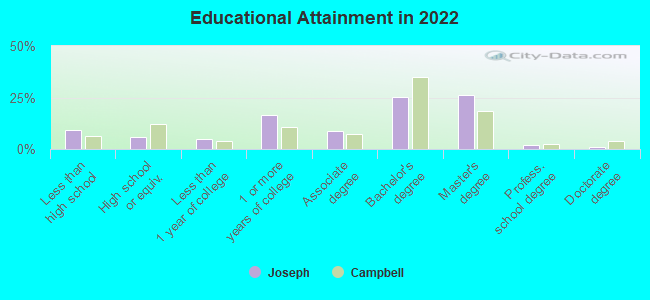
Education in this neighborhood (subdivision or community):
- Percentage of people 3 years and older in K-12 schools:
Joseph: 13.3% Campbell: 16.1%
- Percentage of people 3 years and older in undergraduate colleges:
Joseph: 5.4% Campbell: 4.5%
- Percentage of people 3 years and older in grad. or professional schools:
Joseph: 2.3% Campbell: 0.9%
- Percentage of students K-12 enrolled in private schools:
Joseph: 11.7% Campbell: 17.5%
Percentage of population below poverty level:
| Joseph: | 6.3% |
| Campbell: | 5.6% |
Median year owner moved in (as recorded in 2022):
Median year renter moved in (as recorded in 2022):
| Joseph: | 2010 |
| Campbell: | 2007 |
Median year renter moved in (as recorded in 2022):
| Joseph: | 2015 |
| Campbell: | 2016 |
Percentage of married-couple families with both working:
| Joseph: | 86.7% |
| Campbell: | 72.5% |
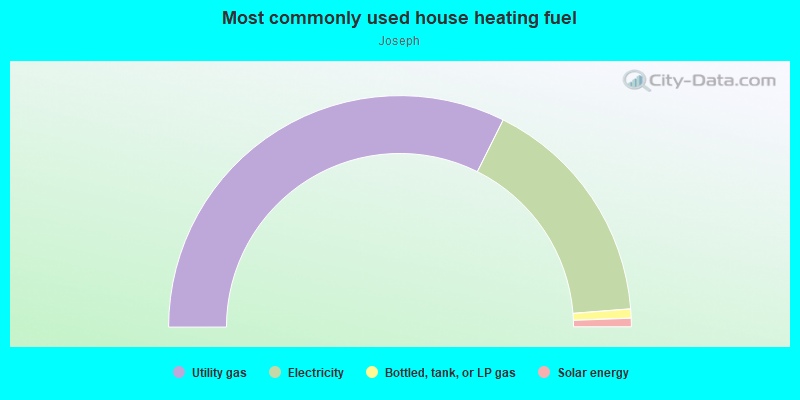
- 64.8%Utility gas
- 32.8%Electricity
- 1.3%Bottled, tank, or LP gas
- 1.2%Solar energy
Roads and streets:
Joseph Ave
Length: 0.21 miles
Direction: N-S
Address range: 2700 to 2899
Direction: N-S
Address range: 2700 to 2899
S Bascom Ave
Length: 0.19 miles
Direction: SW-NE
Address range: 2800 to 2999
Direction: SW-NE
Address range: 2800 to 2999
Shamrock Dr
Length: 0.09 miles
Directions: E-W, SE-NW
Address range: 2200 to 2231
Directions: E-W, SE-NW
Address range: 2200 to 2231
Fazeli Ct
Length: 0.07 miles
Direction: E-W
Address range: 2200 to 2299
Direction: E-W
Address range: 2200 to 2299
Curtner Ave
Length: 0.06 miles
Direction: E-W
Address range: 561 to 2220
Direction: E-W
Address range: 561 to 2220
Tomasina Ct
Length: 0.03 miles
Direction: E-W
Address range: 2200 to 2299
Direction: E-W
Address range: 2200 to 2299
Angela Ct
Length: 0.03 miles
Direction: E-W
Address range: 2200 to 2299
Direction: E-W
Address range: 2200 to 2299