Johnson neighborhood in Buffalo, New York (NY), 14211, 14212 detailed profile
Settings
X


Business Search - 14 Million verified businesses
Area: 0.172 square miles
Population: 1,480
Population density:
| Johnson: | 8,580 people per square mile |
| Buffalo: | 6,808 people per square mile |

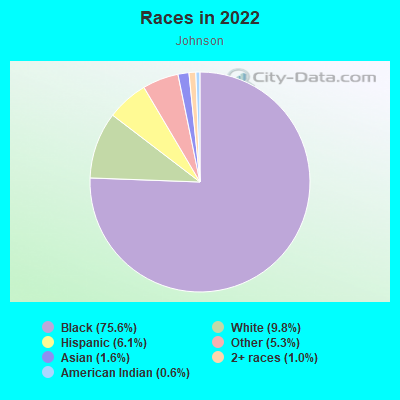
- 1,20875.6%Black
- 1579.8%White
- 976.1%Hispanic or Latino
- 855.3%Some other race
- 261.6%Asian
- 161.0%Two or more races
- 90.6%American Indian

Distribution of median household income
![Distribution of median household income]()
- 153Less than $10,000
- 242$10,000 to $19,999
- 141$20,000 to $29,999
- 66$30,000 to $39,999
- 46$40,000 to $49,999
- 127$50,000 to $59,999
- 53$60,000 to $74,999
- 98$75,000 to $99,999
- 34$100,000 to $124,999
- 44$125,000 to $149,999
- 147$150,000 to $199,999
- 30$200,000 or more

Distribution of owner-occupied house/condo value
![Distribution of owner-occupied house/condo value]()
- 195Less than $50,000
- 151$50,000 to $99,999
- 38$100,000 to $149,999
- 203$150,000 to $199,999
- 48$200,000 to $249,999
- 33$250,000 to $299,999
- 3$300,000 to $399,999
- 27$400,000 to $499,999
- 83$500,000 to $749,999
- 13$1,000,000 or more

Distribution of rent paid by renters
![Distribution of rent paid by renters]()
- 193Less than $100
- 296$100 to $199
- 400$200 to $299
- 75$300 to $399
- 18$400 to $499
- 110$500 to $599
- 147$600 to $699
- 20$700 to $799
- 60$800 to $899
- 47$900 to $999
- 41$1,000 to $1,249
- 27$1,250 to $1,499
- 176$1,500 to $1,999
- 73$2,000 or more

| Males: | 715 |
| Females: | 764 |
Males:
| This neighborhood: | 44.8 years |
| Whole city: | 34.6 years |
| This neighborhood: | 53.4 years |
| Whole city: | 35.0 years |
Average household size:
| Johnson: | 2.1 people |
| Buffalo: | 2.2 people |
Percentage of family households:
| Johnson: | 19.6% |
| Buffalo: | 35.8% |
| Here: | 15.5% |
| Buffalo: | 24.5% |
Percentage of married-couple families with children (among all households):
| Johnson: | 44.7% |
| Buffalo: | 22.3% |
Percentage of single-mother households (among all households):
| Johnson: | 35.6% |
| Buffalo: | 17.8% |
Percentage of never married males 15 years old and over:
Percentage of never married females 15 years old and over:
| Johnson: | 18.2% |
| Buffalo: | 25.6% |
Percentage of never married females 15 years old and over:
| Johnson: | 25.2% |
| city: | 26.3% |
Percentage of people that speak English not well or not at all:
| Johnson: | 0.0% |
| Buffalo: | 4.0% |
Percentage of people born in this state:
Percentage of people born in another U.S. state:
Percentage of native residents but born outside the U.S.:
Percentage of foreign born residents:
| Here: | 74.9% |
| Buffalo: | 75.1% |
Percentage of people born in another U.S. state:
| Johnson: | 14.9% |
| Buffalo: | 10.9% |
Percentage of native residents but born outside the U.S.:
| Here: | 0.5% |
| city: | 3.9% |
Percentage of foreign born residents:
| Here: | 9.6% |
| Buffalo: | 10.0% |
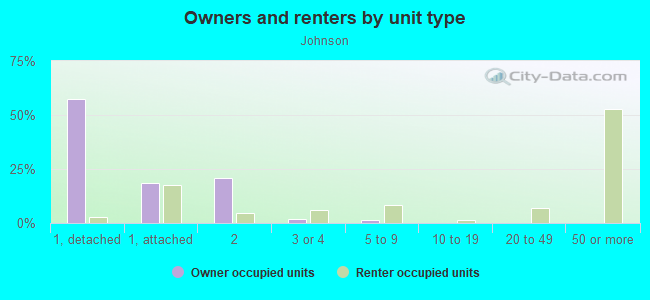
Owner-occupied
Renter-occupied

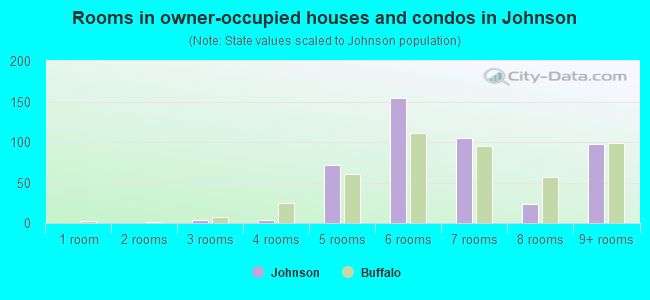
- Rooms in owner-occupied houses and condos in Johnson
- 01 room
- 02 rooms
- 43 rooms
- 44 rooms
- 725 rooms
- 1546 rooms
- 1057 rooms
- 238 rooms
- 989+ rooms
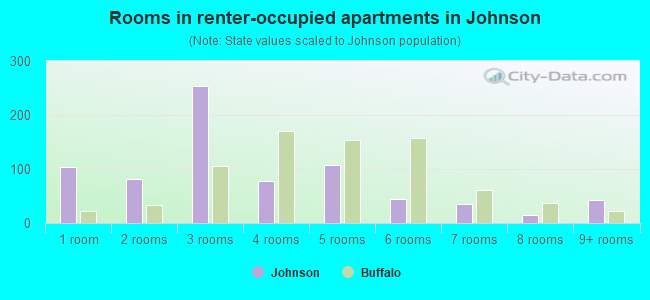
- Rooms in renter-occupied apartments in Johnson
- 1031 room
- 812 rooms
- 2533 rooms
- 784 rooms
- 1075 rooms
- 456 rooms
- 367 rooms
- 158 rooms
- 439+ rooms
Owner-occupied
Renter-occupied
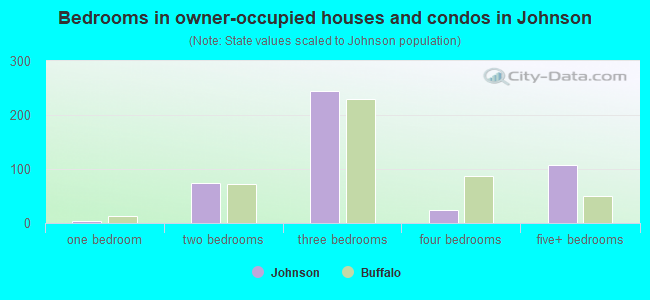
- Bedrooms in owner-occupied houses and condos in Johnson
- 0no bedroom
- 31 bedroom
- 752 bedrooms
- 2453 bedrooms
- 244 bedrooms
- 1075+ bedrooms
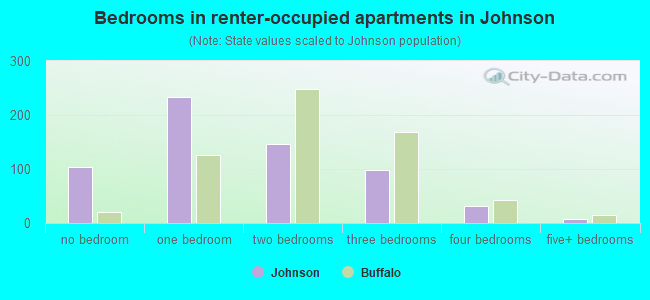
- Bedrooms in renter-occupied apartments in Johnson
- 103no bedroom
- 2341 bedroom
- 1462 bedrooms
- 993 bedrooms
- 324 bedrooms
- 75+ bedrooms
Average number of cars or other vehicles available in houses/condos:
Average number of cars or other vehicles available in apartments:
| This neighborhood: | 0.4 |
| Buffalo: | 1.5 |
Average number of cars or other vehicles available in apartments:
| Here: | 1.5 |
| city: | 0.9 |
Percentage of units with a mortgage:
| Johnson: | 39.8% |
| Buffalo: | 48.3% |
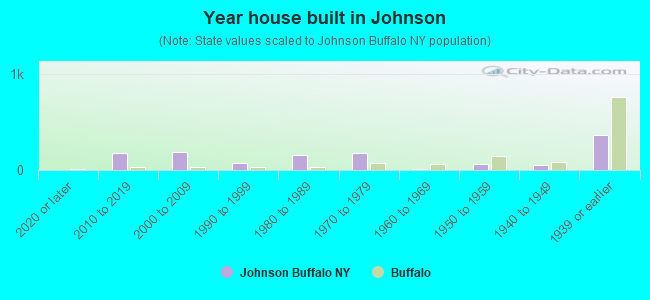
- Year house built in Johnson
- 02020 or later
- 1822010 to 2019
- 1862000 to 2009
- 771990 to 1999
- 1561980 to 1989
- 1771970 to 1979
- 91960 to 1969
- 591950 to 1959
- 481940 to 1949
- 3671939 or earlier
City-data.com crime index for city in 2020 (higher means more crime):
| City: | 441.3 |
| U.S. average: | 219.5 |
Travel time to work (commute)
![Travel time to work (commute)]()
- 13Less than 5 minutes
- 655 to 9 minutes
- 5610 to 14 minutes
- 4115 to 19 minutes
- 4720 to 24 minutes
- 1525 to 29 minutes
- 1530 to 34 minutes
- 1235 to 39 minutes
- 540 to 44 minutes
- 1545 to 59 minutes
- 460 to 89 minutes

Means of transportation to work
![Means of transportation to work]()
- 52.6%268Drove a car alone
- 13.2%67Carpooled
- 5.9%30Bus
- 8.6%44Subway or elevated rail
- 11.0%56Taxi
- 2.0%10Bicycle
- 19.4%99Walked
- 5.3%27Other means
- 18.3%93Worked at home

Time leaving home to go to work
![Time leaving home to go to work]()
- 1412:00 a.m. to 4:59 a.m.
- 105:00 a.m. to 5:29 a.m.
- 55:30 a.m. to 5:59 a.m.
- 196:00 a.m. to 6:29 a.m.
- 186:30 a.m. to 6:59 a.m.
- 97:00 a.m. to 7:29 a.m.
- 477:30 a.m. to 7:59 a.m.
- 388:00 a.m. to 8:29 a.m.
- 188:30 a.m. to 8:59 a.m.
- 259:00 a.m. to 9:59 a.m.
- 1310:00 a.m. to 10:59 a.m.
- 2811:00 a.m. to 11:59 a.m.
- 2812:00 p.m. to 3:59 p.m.
- 144:00 p.m. to 11:59 p.m.

Occupations of males:
- Percentage of males in management occupations (except farmers):
Here: 12.3% city: 8.7%
- Percentage of males in business and financial operations occupations:
Here: 1.6% city: 4.0%
- Percentage of males in computer and mathematical occupations:
Here: 2.5% city: 3.5%
- Percentage of males in architecture and engineering occupations:
Here: 3.9% city: 2.9%
- Percentage of males in community and social services occupations:
Here: 10.5% city: 1.9%
- Percentage of males in education, training, and library occupations:
Here: 4.3% city: 4.7%
- Percentage of males in arts, design, entertainment, sports, and media occupations:
Here: 1.2% city: 1.7%
- Percentage of males in service occupations:
Here: 34.6% city: 21.5%
- Percentage of males in sales and office occupations:
Here: 24.4% city: 15.9%
- Percentage of males in construction, extraction, and maintenance occupations:
Here: 4.4% city: 5.6%
- Percentage of males in production occupations:
Here: 1.8% city: 7.3%
- Percentage of males in transportation occupations:
Here: 2.1% city: 5.1%
- Percentage of males in material moving occupations:
Here: 3.6% city: 7.6%
Occupations of females:
- Percentage of females in management occupations (except farmers):
Here: 8.6% city: 7.4%
- Percentage of females in business and financial operations occupations:
Here: 14.3% city: 5.0%
- Percentage of females in community and social services occupations:
Here: 3.5% city: 3.5%
- Percentage of females in education, training, and library occupations:
Here: 2.4% city: 10.9%
- Percentage of females in healthcare practitioners and technical occupations:
Here: 13.8% city: 8.0%
- Percentage of females in service occupations:
Here: 33.8% city: 26.7%
- Percentage of females in sales and office occupations:
Here: 15.0% city: 25.5%
- Percentage of females in production occupations:
Here: 5.1% city: 3.4%
- Percentage of females in material moving occupations:
Here: 5.4% city: 2.0%
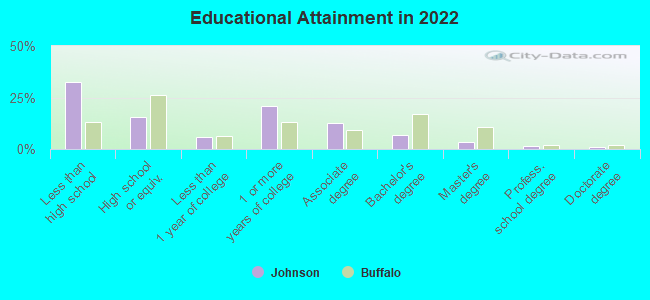
Education in this neighborhood (subdivision or community):
- Percentage of people 3 years and older in K-12 schools:
Johnson: 35.6% Buffalo: 16.7%
- Percentage of people 3 years and older in undergraduate colleges:
Johnson: 3.6% Buffalo: 6.6%
- Percentage of people 3 years and older in grad. or professional schools:
Johnson: 2.7% Buffalo: 2.5%
- Percentage of students K-12 enrolled in private schools:
Johnson: 1.9% Buffalo: 11.8%
Percentage of population below poverty level:
| Johnson: | 30.6% |
| Buffalo: | 23.6% |
Median year owner moved in (as recorded in 2022):
Median year renter moved in (as recorded in 2022):
| Johnson: | 1992 |
| Buffalo: | 2008 |
Median year renter moved in (as recorded in 2022):
| Johnson: | 2017 |
| Buffalo: | 2019 |
Percentage of married-couple families with both working:
| Johnson: | 84.7% |
| Buffalo: | 64.1% |
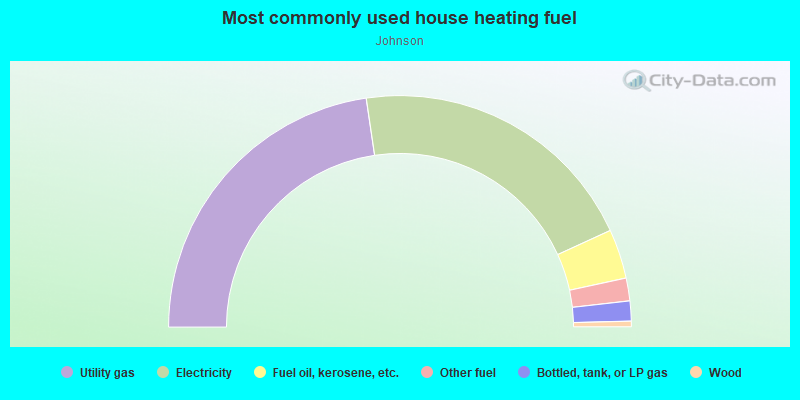
- 45.4%Utility gas
- 41.0%Electricity
- 6.9%Fuel oil, kerosene, etc.
- 3.2%Other fuel
- 2.8%Bottled, tank, or LP gas
- 0.8%Wood
Roads and streets:
Sycamore St
Length: 0.48 miles
Direction: E-W
Address range: 473 to 645
Direction: E-W
Address range: 473 to 645
Broadway (Broadway St)
Length: 0.43 miles
Direction: E-W
Address range: 571 to 734
Direction: E-W
Address range: 571 to 734
Adams St
Length: 0.41 miles
Direction: N-S
Address range: 368 to 599
Direction: N-S
Address range: 368 to 599
Monroe St
Length: 0.40 miles
Direction: N-S
Address range: 347 to 575
Direction: N-S
Address range: 347 to 575
Madison St
Length: 0.37 miles
Direction: N-S
Address range: 330 to 599
Direction: N-S
Address range: 330 to 599
Sherman St
Length: 0.27 miles
Direction: N-S
Address range: 270 to 426
Direction: N-S
Address range: 270 to 426
Johnson St
Length: 0.26 miles
Direction: N-S
Address range: 1 to 140
Direction: N-S
Address range: 1 to 140
Grey St
Length: 0.25 miles
Direction: N-S
Address range: 1 to 127
Direction: N-S
Address range: 1 to 127
Beckwith St
Length: 0.19 miles
Direction: E-W
Address range: 1 to 99
Direction: E-W
Address range: 1 to 99
Brown St
Length: 0.15 miles
Direction: SW-NE
Address range: 29 to 99
Direction: SW-NE
Address range: 29 to 99