John S. Park neighborhood in Las Vegas, Nevada (NV), 89101, 89104 detailed profile
Settings
X


Business Search - 14 Million verified businesses
Area: 0.389 square miles
Population: 2,243
Population density:
| John S. Park: | 5,761 people per square mile |
| Las Vegas: | 5,792 people per square mile |

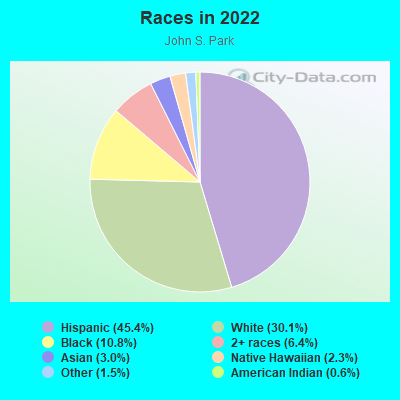
- 1,05945.4%Hispanic or Latino
- 70430.1%White
- 25210.8%Black
- 1496.4%Two or more races
- 693.0%Asian
- 532.3%Native Hawaiian and Other
Pacific Islander - 341.5%Some other race
- 150.6%American Indian
Median household income in 2022:
| John S. Park: | $62,729 |
| Las Vegas: | $68,905 |
Distribution of median household income
![Distribution of median household income]()
- 61Less than $10,000
- 264$10,000 to $19,999
- 100$20,000 to $29,999
- 130$30,000 to $39,999
- 58$40,000 to $49,999
- 68$50,000 to $59,999
- 127$60,000 to $74,999
- 77$75,000 to $99,999
- 160$100,000 to $124,999
- 42$125,000 to $149,999
- 29$150,000 to $199,999
- 70$200,000 or more

Distribution of owner-occupied house/condo value
![Distribution of owner-occupied house/condo value]()
- 41Less than $50,000
- 41$50,000 to $99,999
- 35$100,000 to $149,999
- 51$150,000 to $199,999
- 77$200,000 to $249,999
- 75$250,000 to $299,999
- 161$300,000 to $399,999
- 71$400,000 to $499,999
- 40$500,000 to $749,999
- 22$1,000,000 or more

Distribution of rent paid by renters
![Distribution of rent paid by renters]()
- 28Less than $100
- 17$100 to $199
- 9$200 to $299
- 25$300 to $399
- 20$400 to $499
- 56$500 to $599
- 122$600 to $699
- 193$700 to $799
- 78$800 to $899
- 61$900 to $999
- 157$1,000 to $1,249
- 77$1,250 to $1,499
- 137$1,500 to $1,999
- 20$2,000 or more

Median rent in 2022:
| John S. Park: | $1,273 |
| Las Vegas: | $1,277 |
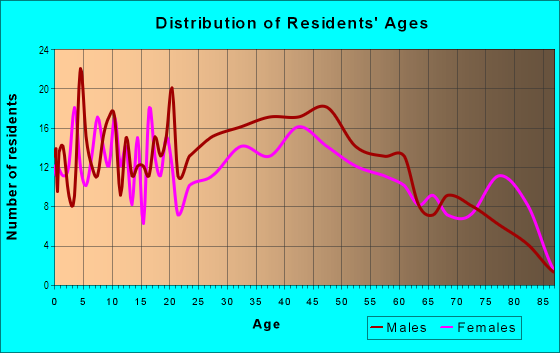
| Males: | 1,157 |
| Females: | 1,085 |
Males:
| This neighborhood: | 40.8 years |
| Whole city: | 38.4 years |
| This neighborhood: | 42.5 years |
| Whole city: | 38.9 years |
Average household size:
| John S. Park: | 2.4 people |
| Las Vegas: | 2.7 people |
Percentage of family households:
| John S. Park: | 40.3% |
| Las Vegas: | 45.8% |
| Here: | 32.3% |
| Las Vegas: | 40.9% |
Percentage of married-couple families with children (among all households):
| John S. Park: | 15.6% |
| Las Vegas: | 23.4% |
Percentage of single-mother households (among all households):
| John S. Park: | 13.7% |
| Las Vegas: | 10.1% |
Percentage of never married males 15 years old and over:
Percentage of never married females 15 years old and over:
| John S. Park: | 23.3% |
| Las Vegas: | 19.7% |
Percentage of never married females 15 years old and over:
| John S. Park: | 20.4% |
| city: | 17.0% |
Percentage of people that speak English not well or not at all:
| John S. Park: | 12.2% |
| Las Vegas: | 7.0% |
Percentage of people born in this state:
Percentage of people born in another U.S. state:
Percentage of native residents but born outside the U.S.:
Percentage of foreign born residents:
| Here: | 23.1% |
| Las Vegas: | 27.3% |
Percentage of people born in another U.S. state:
| John S. Park: | 42.3% |
| Las Vegas: | 49.8% |
Percentage of native residents but born outside the U.S.:
| Here: | 2.6% |
| city: | 1.9% |
Percentage of foreign born residents:
| Here: | 32.0% |
| Las Vegas: | 21.0% |
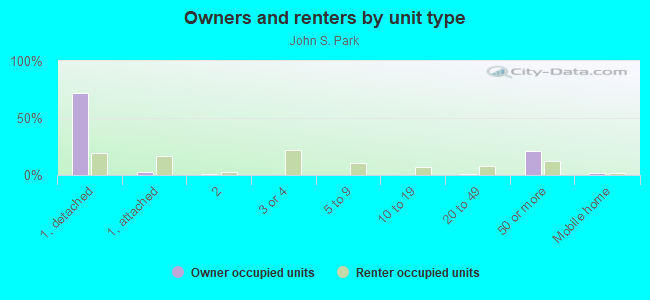
Owner-occupied
Renter-occupied

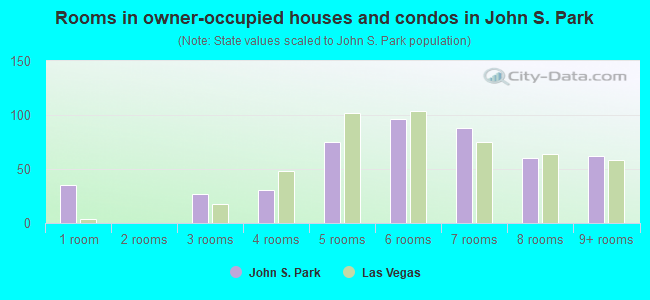
- Rooms in owner-occupied houses and condos in John S. Park
- 351 room
- 02 rooms
- 273 rooms
- 314 rooms
- 755 rooms
- 966 rooms
- 887 rooms
- 608 rooms
- 629+ rooms
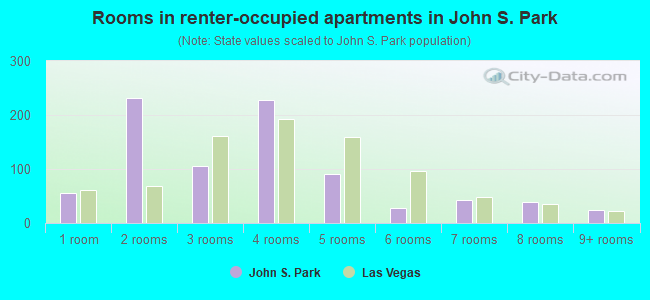
- Rooms in renter-occupied apartments in John S. Park
- 561 room
- 2322 rooms
- 1063 rooms
- 2284 rooms
- 915 rooms
- 276 rooms
- 427 rooms
- 398 rooms
- 249+ rooms
Owner-occupied
Renter-occupied
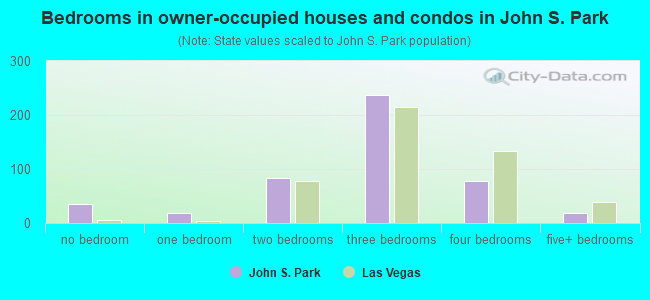
- Bedrooms in owner-occupied houses and condos in John S. Park
- 35no bedroom
- 191 bedroom
- 832 bedrooms
- 2373 bedrooms
- 784 bedrooms
- 185+ bedrooms
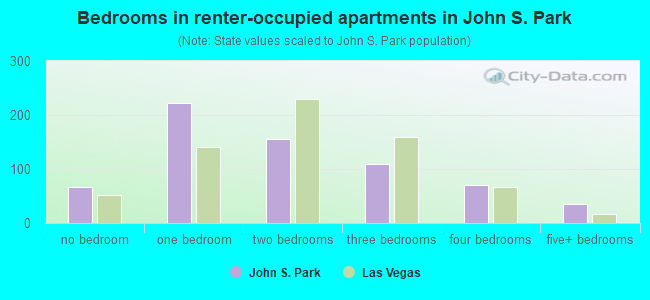
- Bedrooms in renter-occupied apartments in John S. Park
- 67no bedroom
- 2221 bedroom
- 1552 bedrooms
- 1093 bedrooms
- 714 bedrooms
- 365+ bedrooms
Average number of cars or other vehicles available in houses/condos:
Average number of cars or other vehicles available in apartments:
| This neighborhood: | |
| Las Vegas: |
Average number of cars or other vehicles available in apartments:
| Here: | 0.9 |
| city: | 1.3 |
Percentage of units with a mortgage:
| John S. Park: | 56.0% |
| Las Vegas: | 69.3% |
Average estimated value of detached houses in 2022 (64.7% of all units):
| John S. Park: | $273,059 |
| Nevada: | $549,327 |
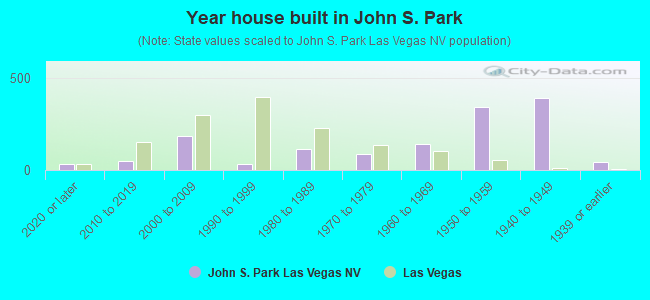
- Year house built in John S. Park
- 352020 or later
- 492010 to 2019
- 1842000 to 2009
- 311990 to 1999
- 1141980 to 1989
- 891970 to 1979
- 1391960 to 1969
- 3411950 to 1959
- 3901940 to 1949
- 411939 or earlier
City-data.com crime index for city in 2020 (higher means more crime):
| City: | 280.7 |
| U.S. average: | 219.5 |
Travel time to work (commute)
![Travel time to work (commute)]()
- 15Less than 5 minutes
- 635 to 9 minutes
- 10810 to 14 minutes
- 16415 to 19 minutes
- 13720 to 24 minutes
- 5725 to 29 minutes
- 14130 to 34 minutes
- 1135 to 39 minutes
- 1640 to 44 minutes
- 7245 to 59 minutes
- 5760 to 89 minutes
- 1690 or more minutes

Means of transportation to work
![Means of transportation to work]()
- 54.3%644Drove a car alone
- 9.1%108Carpooled
- 5.6%66Bus
- 1.7%20Subway or elevated rail
- 0.2%2Taxi
- 2.2%26Motorcycle
- 4.1%49Bicycle
- 8.3%99Walked
- 5.5%65Other means
- 15.1%179Worked at home

Time leaving home to go to work
![Time leaving home to go to work]()
- 3912:00 a.m. to 4:59 a.m.
- 555:00 a.m. to 5:29 a.m.
- 315:30 a.m. to 5:59 a.m.
- 626:00 a.m. to 6:29 a.m.
- 736:30 a.m. to 6:59 a.m.
- 617:00 a.m. to 7:29 a.m.
- 597:30 a.m. to 7:59 a.m.
- 988:00 a.m. to 8:29 a.m.
- 368:30 a.m. to 8:59 a.m.
- 489:00 a.m. to 9:59 a.m.
- 4910:00 a.m. to 10:59 a.m.
- 511:00 a.m. to 11:59 a.m.
- 8812:00 p.m. to 3:59 p.m.
- 1354:00 p.m. to 11:59 p.m.

Occupations of males:
- Percentage of males in management occupations (except farmers):
Here: 9.3% city: 9.6%
- Percentage of males in life, physical, and social science occupations:
Here: 1.8% city: 0.3%
- Percentage of males in legal occupations:
Here: 2.1% city: 0.9%
- Percentage of males in education, training, and library occupations:
Here: 5.8% city: 2.5%
- Percentage of males in arts, design, entertainment, sports, and media occupations:
Here: 8.0% city: 2.5%
- Percentage of males in service occupations:
Here: 36.7% city: 23.3%
- Percentage of males in sales and office occupations:
Here: 15.4% city: 16.6%
- Percentage of males in construction, extraction, and maintenance occupations:
Here: 3.4% city: 10.6%
- Percentage of males in production occupations:
Here: 2.4% city: 3.3%
- Percentage of males in transportation occupations:
Here: 4.0% city: 6.6%
- Percentage of males in material moving occupations:
Here: 5.8% city: 5.4%
Occupations of females:
- Percentage of females in management occupations (except farmers):
Here: 6.4% city: 8.5%
- Percentage of females in computer and mathematical occupations:
Here: 1.8% city: 1.1%
- Percentage of females in community and social services occupations:
Here: 2.3% city: 1.9%
- Percentage of females in legal occupations:
Here: 1.8% city: 1.5%
- Percentage of females in education, training, and library occupations:
Here: 9.2% city: 8.0%
- Percentage of females in arts, design, entertainment, sports, and media occupations:
Here: 6.4% city: 1.8%
- Percentage of females in healthcare practitioners and technical occupations:
Here: 6.1% city: 7.4%
- Percentage of females in service occupations:
Here: 24.5% city: 26.5%
- Percentage of females in sales and office occupations:
Here: 39.7% city: 30.5%
- Percentage of females in production occupations:
Here: 2.2% city: 1.8%
Percentage of people 16-64 in Armed Forces:
| John S. Park: | 0.1% |
| Las Vegas: | 1.0% |
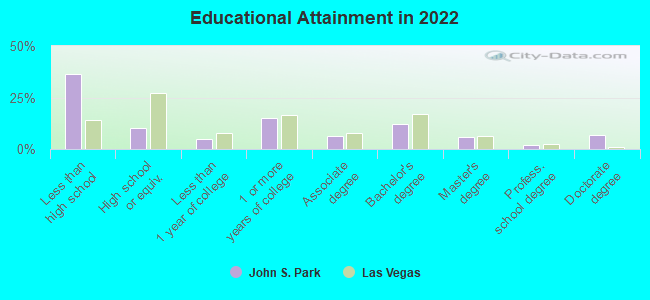
Education in this neighborhood (subdivision or community):
- Percentage of people 3 years and older in K-12 schools:
John S. Park: 17.1% Las Vegas: 17.4%
- Percentage of people 3 years and older in undergraduate colleges:
John S. Park: 4.6% Las Vegas: 4.2%
- Percentage of people 3 years and older in grad. or professional schools:
John S. Park: 5.2% Las Vegas: 1.0%
- Percentage of students K-12 enrolled in private schools:
John S. Park: 13.0% Las Vegas: 12.9%
Percentage of population below poverty level:
| John S. Park: | 19.9% |
| Las Vegas: | 14.1% |
Median year renter moved in (as recorded in 2022):
| John S. Park: | 2018 |
| Las Vegas: | 2020 |
Percentage of married-couple families with both working:
| John S. Park: | 79.0% |
| Las Vegas: | 62.0% |
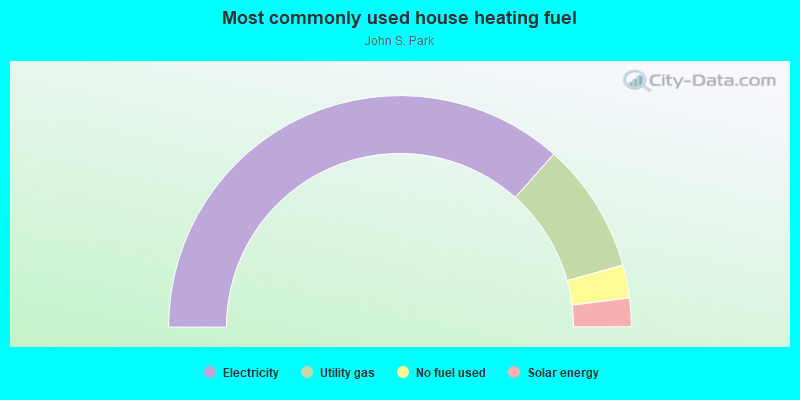
- 73.1%Electricity
- 18.2%Utility gas
- 4.6%No fuel used
- 4.0%Solar energy
Highways in this neighborhood:
Las Vegas Blvd S (State Rte 604)
Length: 0.24 miles
Direction: SW-NE
Address range: 900 to 1199
Direction: SW-NE
Address range: 900 to 1199
Roads and streets:
E Oakey Blvd
Length: 0.62 miles
Direction: E-W
Address range: 539 to 999
Direction: E-W
Address range: 539 to 999
S 10th St
Length: 0.61 miles
Direction: N-S
Address range: 1100 to 1899
Direction: N-S
Address range: 1100 to 1899
S 6th St
Length: 0.56 miles
Directions: N-S, SW-NE
Address range: 900 to 1699
Directions: N-S, SW-NE
Address range: 900 to 1699
S 8th St
Length: 0.54 miles
Directions: N-S, SW-NE
Address range: 800 to 1699
Directions: N-S, SW-NE
Address range: 800 to 1699
S 7th St
Length: 0.51 miles
Directions: N-S, SW-NE
Address range: 800 to 1699
Directions: N-S, SW-NE
Address range: 800 to 1699
Park Paseo
Length: 0.49 miles
Directions: E-W, SW-NE
Address range: 500 to 999
Directions: E-W, SW-NE
Address range: 500 to 999
S 9th St
Length: 0.49 miles
Directions: E-W, N-S, SE-NW, SW-NE
Address range: 800 to 1899
Directions: E-W, N-S, SE-NW, SW-NE
Address range: 800 to 1899
E Charleston Blvd
Length: 0.46 miles
Direction: E-W
Address range: 500 to 911
Direction: E-W
Address range: 500 to 911
Griffith Ave
Length: 0.39 miles
Direction: E-W
Address range: 500 to 899
Direction: E-W
Address range: 500 to 899
Franklin Ave
Length: 0.39 miles
Direction: E-W
Address range: 600 to 1009
Direction: E-W
Address range: 600 to 1009
5th Pl
Length: 0.38 miles
Direction: N-S
Address range: 1100 to 1699
Direction: N-S
Address range: 1100 to 1699
Sweeney Ave
Length: 0.37 miles
Direction: E-W
Address range: 500 to 1019
Direction: E-W
Address range: 500 to 1019
Bracken Ave
Length: 0.37 miles
Direction: E-W
Address range: 500 to 899
Direction: E-W
Address range: 500 to 899
Rexford Pl
Length: 0.30 miles
Directions: E-W, N-S, SW-NE
Address range: 1200 to 1699
Directions: E-W, N-S, SW-NE
Address range: 1200 to 1699
Houssels Ave
Length: 0.27 miles
Directions: N-S, SW-NE
Address range: 1200 to 1699
Directions: N-S, SW-NE
Address range: 1200 to 1699
Gass Ave
Length: 0.22 miles
Directions: E-W, SE-NW
Address range: 700 to 999
Directions: E-W, SE-NW
Address range: 700 to 999
8th Pl
Length: 0.21 miles
Directions: E-W, N-S, SE-NW
Address range: 1200 to 1299
Directions: E-W, N-S, SE-NW
Address range: 1200 to 1299
Hoover Ave
Length: 0.17 miles
Direction: SE-NW
Address range: 500 to 699
Direction: SE-NW
Address range: 500 to 699
Barbara Way
Length: 0.17 miles
Direction: E-W
Address range: 500 to 599
Direction: E-W
Address range: 500 to 599
Ellen Way
Length: 0.17 miles
Direction: E-W
Address range: 500 to 599
Direction: E-W
Address range: 500 to 599
S Beverly Way
Length: 0.10 miles
Direction: N-S
Address range: 1600 to 1798
Direction: N-S
Address range: 1600 to 1798
Rexford Dr
Length: 0.10 miles
Direction: N-S
Address range: 1700 to 1799
Direction: N-S
Address range: 1700 to 1799
S 8th Pl
Length: 0.10 miles
Direction: N-S
Address range: 1700 to 1899
Direction: N-S
Address range: 1700 to 1899
E Hassett Ave
Length: 0.09 miles
Direction: E-W
Address range: 900 to 999
Direction: E-W
Address range: 900 to 999