Jennings-May St. Louis neighborhood in Fort Worth, Texas (TX), 76110 detailed profile
Settings
X

Business Search - 14 Million verified businesses
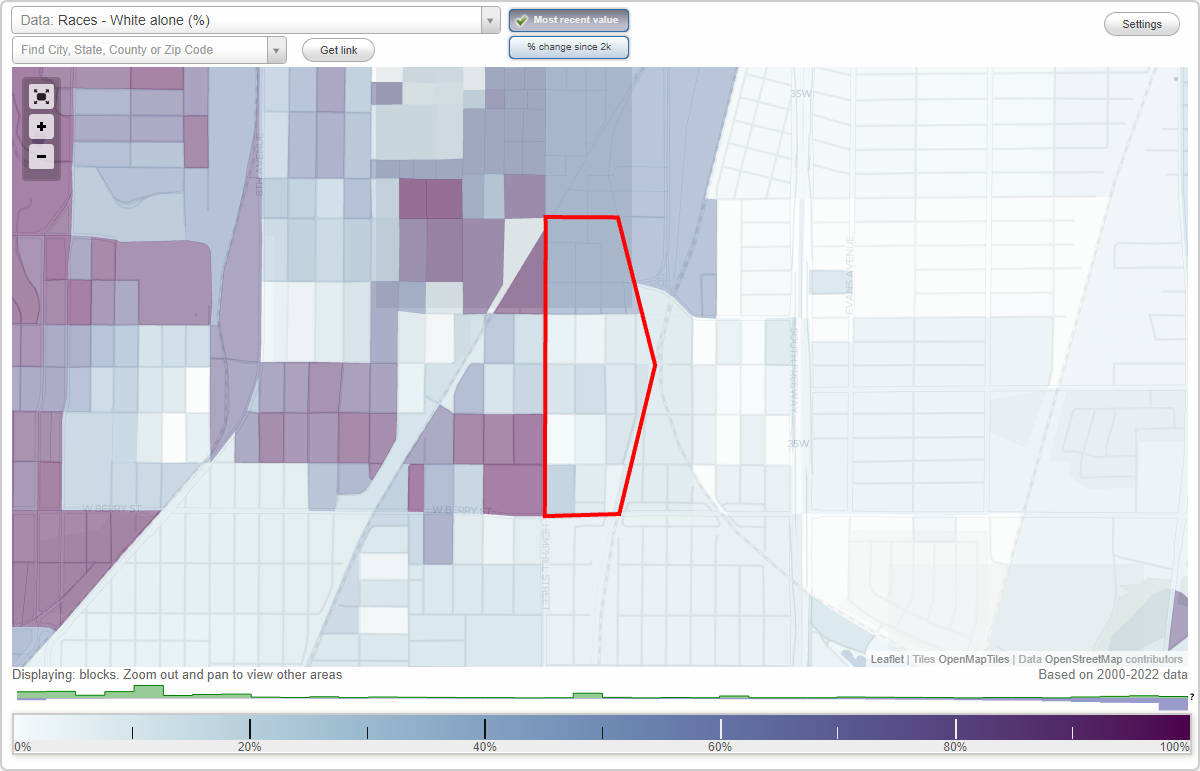
Area: 0.169 square miles
Population: 722
Population density:
| Jennings-May St. Louis: | 4,264 people per square mile |
| Fort Worth: | 3,286 people per square mile |

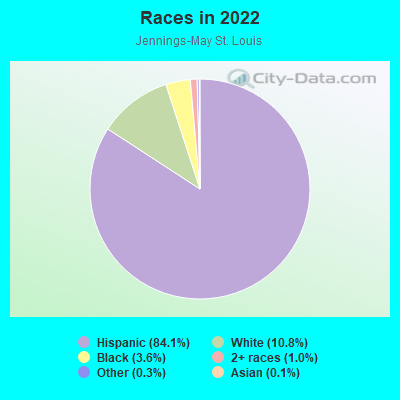
- 60584.1%Hispanic or Latino
- 7810.8%White
- 263.6%Black
- 71.0%Two or more races
- 20.3%Some other race
- 10.1%Asian
Median household income in 2022:
| Jennings-May St. Louis: | $58,693 |
| Fort Worth: | $71,527 |
Distribution of median household income
![Distribution of median household income]()
- 2Less than $10,000
- 66$10,000 to $19,999
- 15$20,000 to $29,999
- 12$30,000 to $39,999
- 15$40,000 to $49,999
- 19$50,000 to $59,999
- 42$60,000 to $74,999
- 35$75,000 to $99,999
- 10$100,000 to $124,999
- 9$125,000 to $149,999
- 15$150,000 to $199,999
- 9$200,000 or more

Distribution of owner-occupied house/condo value
![Distribution of owner-occupied house/condo value]()
- 34Less than $50,000
- 66$50,000 to $99,999
- 14$100,000 to $149,999
- 12$150,000 to $199,999
- 29$200,000 to $249,999
- 6$250,000 to $299,999
- 10$300,000 to $399,999
- 3$500,000 to $749,999

Distribution of rent paid by renters
![Distribution of rent paid by renters]()
- 6$100 to $199
- 3$200 to $299
- 10$500 to $599
- 4$600 to $699
- 9$700 to $799
- 17$800 to $899
- 5$900 to $999
- 4$1,000 to $1,249
- 21$1,250 to $1,499

Median rent in 2022:
| Jennings-May St. Louis: | $848 |
| Fort Worth: | $1,182 |
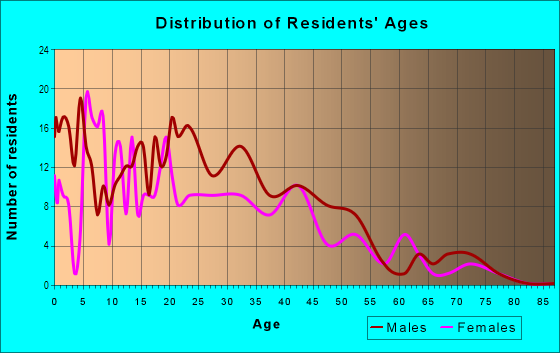
| Males: | 369 |
| Females: | 352 |
Males:
| This neighborhood: | 34.9 years |
| Whole city: | 33.6 years |
| This neighborhood: | 42.2 years |
| Whole city: | 34.8 years |
Average household size:
| Jennings-May St. Louis: | 3.0 people |
| Fort Worth: | 2.7 people |
Percentage of family households:
| Jennings-May St. Louis: | 51.2% |
| Fort Worth: | 52.4% |
| Here: | 49.0% |
| Fort Worth: | 48.2% |
Percentage of married-couple families with children (among all households):
| Jennings-May St. Louis: | 23.8% |
| Fort Worth: | 25.9% |
Percentage of single-mother households (among all households):
| Jennings-May St. Louis: | 6.2% |
| Fort Worth: | 7.4% |
Percentage of never married males 15 years old and over:
Percentage of never married females 15 years old and over:
| Jennings-May St. Louis: | 20.1% |
| Fort Worth: | 18.5% |
Percentage of never married females 15 years old and over:
| Jennings-May St. Louis: | 15.7% |
| city: | 17.3% |
Percentage of people that speak English not well or not at all:
| Jennings-May St. Louis: | 22.5% |
| Fort Worth: | 6.5% |
Percentage of people born in this state:
Percentage of people born in another U.S. state:
Percentage of native residents but born outside the U.S.:
Percentage of foreign born residents:
| Here: | 55.4% |
| Fort Worth: | 55.0% |
Percentage of people born in another U.S. state:
| Jennings-May St. Louis: | 4.4% |
| Fort Worth: | 26.2% |
Percentage of native residents but born outside the U.S.:
| Here: | 0.2% |
| city: | 2.1% |
Percentage of foreign born residents:
| Here: | 40.0% |
| Fort Worth: | 16.6% |
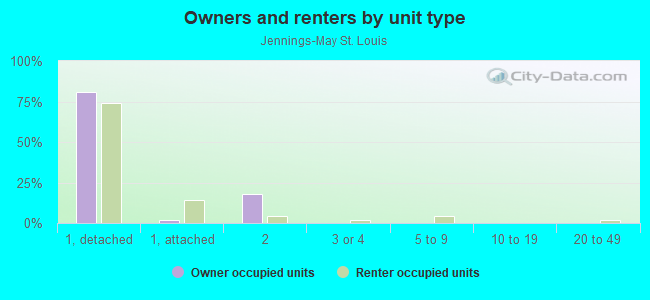
Owner-occupied
Renter-occupied

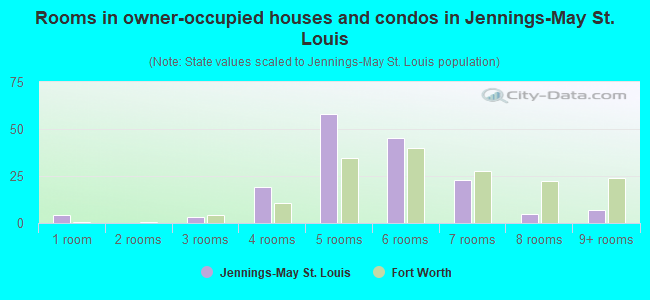
- Rooms in owner-occupied houses and condos in Jennings-May St. Louis
- 41 room
- 02 rooms
- 33 rooms
- 194 rooms
- 585 rooms
- 456 rooms
- 237 rooms
- 58 rooms
- 79+ rooms
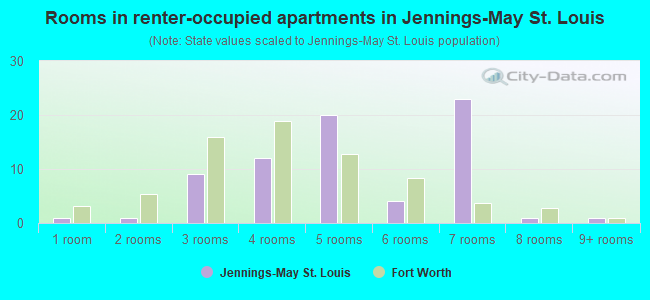
- Rooms in renter-occupied apartments in Jennings-May St. Louis
- 11 room
- 12 rooms
- 93 rooms
- 124 rooms
- 205 rooms
- 46 rooms
- 237 rooms
- 18 rooms
- 19+ rooms
Owner-occupied
Renter-occupied
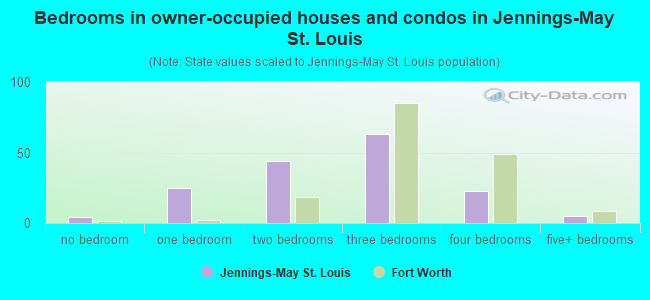
- Bedrooms in owner-occupied houses and condos in Jennings-May St. Louis
- 4no bedroom
- 251 bedroom
- 442 bedrooms
- 633 bedrooms
- 234 bedrooms
- 55+ bedrooms
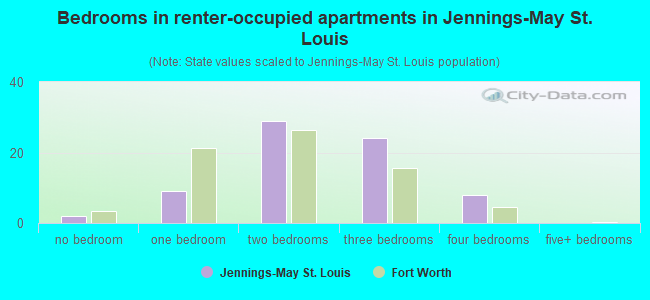
- Bedrooms in renter-occupied apartments in Jennings-May St. Louis
- 2no bedroom
- 91 bedroom
- 292 bedrooms
- 243 bedrooms
- 84 bedrooms
- 05+ bedrooms
Average number of cars or other vehicles available in houses/condos:
Average number of cars or other vehicles available in apartments:
| This neighborhood: | 1.9 |
| Fort Worth: | 2.1 |
Average number of cars or other vehicles available in apartments:
| Here: | 1.7 |
| city: | 1.5 |
Percentage of units with a mortgage:
| Jennings-May St. Louis: | 31.9% |
| Fort Worth: | 61.2% |
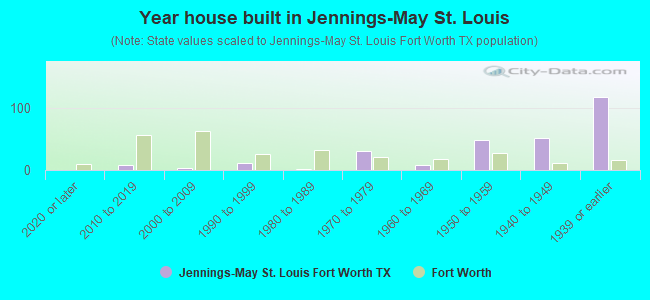
- Year house built in Jennings-May St. Louis
- 02020 or later
- 82010 to 2019
- 42000 to 2009
- 121990 to 1999
- 11980 to 1989
- 301970 to 1979
- 81960 to 1969
- 491950 to 1959
- 521940 to 1949
- 1171939 or earlier
City-data.com crime index for city in 2020 (higher means more crime):
| City: | 303.1 |
| U.S. average: | 219.5 |
Travel time to work (commute)
![Travel time to work (commute)]()
- 455 to 9 minutes
- 2210 to 14 minutes
- 8715 to 19 minutes
- 3720 to 24 minutes
- 1025 to 29 minutes
- 8430 to 34 minutes
- 435 to 39 minutes
- 540 to 44 minutes
- 545 to 59 minutes
- 1960 to 89 minutes

Means of transportation to work
![Means of transportation to work]()
- 88.6%291Drove a car alone
- 8.5%28Carpooled
- 1.2%4Other means
- 0.9%3Worked at home

Time leaving home to go to work
![Time leaving home to go to work]()
- 1412:00 a.m. to 4:59 a.m.
- 65:00 a.m. to 5:29 a.m.
- 155:30 a.m. to 5:59 a.m.
- 746:00 a.m. to 6:29 a.m.
- 366:30 a.m. to 6:59 a.m.
- 697:00 a.m. to 7:29 a.m.
- 197:30 a.m. to 7:59 a.m.
- 38:00 a.m. to 8:29 a.m.
- 168:30 a.m. to 8:59 a.m.
- 259:00 a.m. to 9:59 a.m.
- 1010:00 a.m. to 10:59 a.m.
- 2812:00 p.m. to 3:59 p.m.
- 44:00 p.m. to 11:59 p.m.

Occupations of males:
- Percentage of males in management occupations (except farmers):
Here: 2.7% city: 11.7%
- Percentage of males in life, physical, and social science occupations:
Here: 5.7% city: 0.6%
- Percentage of males in service occupations:
Here: 2.2% city: 12.0%
- Percentage of males in sales and office occupations:
Here: 6.7% city: 15.8%
- Percentage of males in construction, extraction, and maintenance occupations:
Here: 25.3% city: 11.7%
- Percentage of males in production occupations:
Here: 8.4% city: 7.8%
- Percentage of males in transportation occupations:
Here: 13.6% city: 7.1%
- Percentage of males in material moving occupations:
Here: 22.4% city: 7.1%
Occupations of females:
- Percentage of females in management occupations (except farmers):
Here: 12.2% city: 9.6%
- Percentage of females in education, training, and library occupations:
Here: 6.4% city: 9.5%
- Percentage of females in arts, design, entertainment, sports, and media occupations:
Here: 5.6% city: 1.8%
- Percentage of females in service occupations:
Here: 37.9% city: 20.2%
- Percentage of females in sales and office occupations:
Here: 14.8% city: 28.3%
- Percentage of females in construction, extraction, and maintenance occupations:
Here: 3.7% city: 0.3%
- Percentage of females in production occupations:
Here: 14.2% city: 3.5%
- Percentage of females in material moving occupations:
Here: 4.3% city: 3.4%
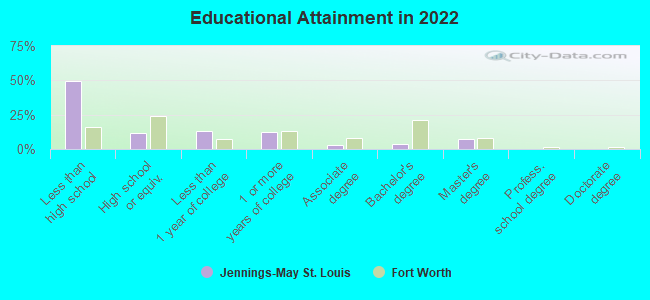
Education in this neighborhood (subdivision or community):
- Percentage of people 3 years and older in K-12 schools:
Jennings-May St. Louis: 19.2% Fort Worth: 20.3%
- Percentage of people 3 years and older in undergraduate colleges:
Jennings-May St. Louis: 2.4% Fort Worth: 4.7%
- Percentage of people 3 years and older in grad. or professional schools:
Jennings-May St. Louis: 0.0% Fort Worth: 1.6%
- Percentage of students K-12 enrolled in private schools:
Jennings-May St. Louis: 7.4% Fort Worth: 7.2%
Percentage of population below poverty level:
| Jennings-May St. Louis: | 19.8% |
| Fort Worth: | 12.0% |
Median year owner moved in (as recorded in 2022):
Median year renter moved in (as recorded in 2022):
| Jennings-May St. Louis: | 2011 |
| Fort Worth: | 2013 |
Median year renter moved in (as recorded in 2022):
| Jennings-May St. Louis: | 2018 |
| Fort Worth: | 2020 |
Percentage of married-couple families with both working:
| Jennings-May St. Louis: | 47.2% |
| Fort Worth: | 71.2% |
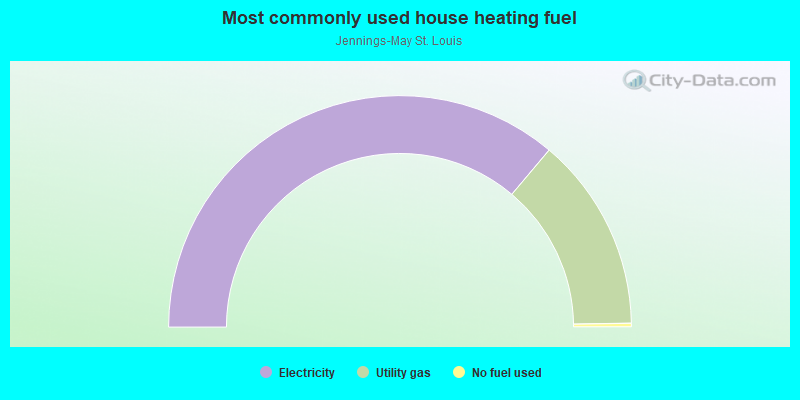
- 72.3%Electricity
- 27.2%Utility gas
- 0.5%No fuel used
Roads and streets:
S Jennings Ave
Length: 0.73 miles
Directions: E-W, N-S, SE-NW
Address range: 2500 to 3099
Directions: E-W, N-S, SE-NW
Address range: 2500 to 3099
May St
Length: 0.68 miles
Direction: N-S
Address range: 2500 to 3099
Direction: N-S
Address range: 2500 to 3099
St Louis Ave
Length: 0.33 miles
Direction: N-S
Address range: 2600 to 2899
Direction: N-S
Address range: 2600 to 2899
W Cantey St
Length: 0.23 miles
Direction: E-W
Address range: 100 to 599
Direction: E-W
Address range: 100 to 599
W Lowden St
Length: 0.20 miles
Direction: E-W
Address range: 200 to 599
Direction: E-W
Address range: 200 to 599
W Capps St
Length: 0.20 miles
Direction: E-W
Address range: 200 to 599
Direction: E-W
Address range: 200 to 599
W Morningside Dr
Length: 0.18 miles
Direction: E-W
Address range: 200 to 499
Direction: E-W
Address range: 200 to 499
W Bowie St
Length: 0.17 miles
Direction: E-W
Address range: 350 to 499
Direction: E-W
Address range: 350 to 499
W Berry St
Length: 0.12 miles
Direction: E-W
Address range: 500 to 599
Direction: E-W
Address range: 500 to 599
W Mulkey St
Length: 0.10 miles
Direction: E-W
Address range: 300 to 598
Direction: E-W
Address range: 300 to 598
Railroad features:
Missouri-Kansas-Texas RR
Length: 0.86 miles
Direction: N-S
Direction: N-S
Southern Pacific RR
Length: 0.32 miles
Direction: N-S
Direction: N-S
M K T RR
Length: 0.02 miles
Direction: N-S
Direction: N-S