Japantown neighborhood in San Jose, California (CA), 95112 detailed profile
Settings
X


Business Search - 14 Million verified businesses
Area: 0.216 square miles
Population: 4,383
Population density:
| Japantown: | 20,258 people per square mile |
| San Jose: | 5,554 people per square mile |

- 1,33030.1%Asian
- 1,23728.0%White
- 83618.9%Hispanic or Latino
- 3608.2%Two or more races
- 3317.5%Some other race
- 2966.7%Black
- 200.5%American Indian
- 50.1%Native Hawaiian and Other
Pacific Islander

Median household income in 2022:
| Japantown: | $164,384 |
| San Jose: | $133,835 |
Distribution of median household income
![Distribution of median household income]()
- 66Less than $10,000
- 106$10,000 to $19,999
- 57$20,000 to $29,999
- 35$30,000 to $39,999
- 42$40,000 to $49,999
- 31$50,000 to $59,999
- 43$60,000 to $74,999
- 346$75,000 to $99,999
- 31$100,000 to $124,999
- 62$125,000 to $149,999
- 404$150,000 to $199,999
- 736$200,000 or more

Distribution of owner-occupied house/condo value
![Distribution of owner-occupied house/condo value]()
- 29$100,000 to $149,999
- 100$500,000 to $749,999
- 50$750,000 to $999,999
- 370$1,000,000 or more

Distribution of rent paid by renters
![Distribution of rent paid by renters]()
- 81Less than $100
- 68$300 to $399
- 40$400 to $499
- 14$500 to $599
- 15$600 to $699
- 10$800 to $899
- 38$900 to $999
- 30$1,000 to $1,249
- 20$1,250 to $1,499
- 65$1,500 to $1,999
- 1,089$2,000 or more
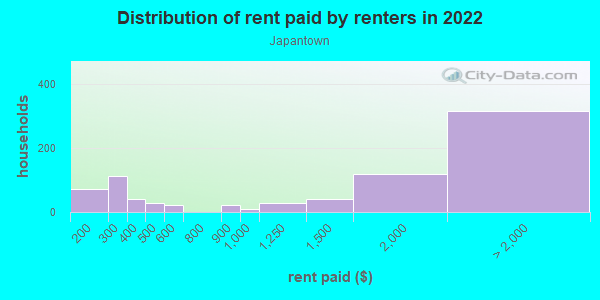
Median rent in 2022:
| Japantown: | $2,431 |
| San Jose: | $2,001 |
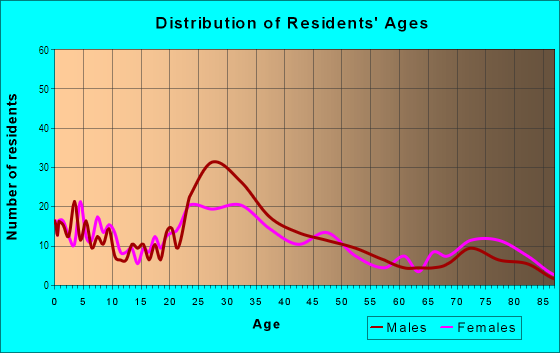
| Males: | 2,798 |
| Females: | 1,584 |
Males:
| This neighborhood: | 31.4 years |
| Whole city: | 37.6 years |
| This neighborhood: | 32.6 years |
| Whole city: | 39.1 years |
Average household size:
| Japantown: | 10.2 people |
| San Jose: | 2.9 people |
Percentage of family households:
| Japantown: | 52.4% |
| San Jose: | 49.9% |
| Here: | 49.1% |
| San Jose: | 53.0% |
Percentage of married-couple families with children (among all households):
| Japantown: | 34.7% |
| San Jose: | 25.8% |
Percentage of single-mother households (among all households):
| Japantown: | 7.9% |
| San Jose: | 5.2% |
Percentage of never married males 15 years old and over:
Percentage of never married females 15 years old and over:
| Japantown: | 31.4% |
| San Jose: | 20.9% |
Percentage of never married females 15 years old and over:
| Japantown: | 9.5% |
| city: | 16.7% |
Percentage of people that speak English not well or not at all:
| Japantown: | 1.8% |
| San Jose: | 11.4% |
Percentage of people born in this state:
Percentage of people born in another U.S. state:
Percentage of native residents but born outside the U.S.:
Percentage of foreign born residents:
| Here: | 57.5% |
| San Jose: | 46.1% |
Percentage of people born in another U.S. state:
| Japantown: | 18.9% |
| San Jose: | 10.4% |
Percentage of native residents but born outside the U.S.:
| Here: | 0.3% |
| city: | 1.7% |
Percentage of foreign born residents:
| Here: | 23.3% |
| San Jose: | 41.8% |
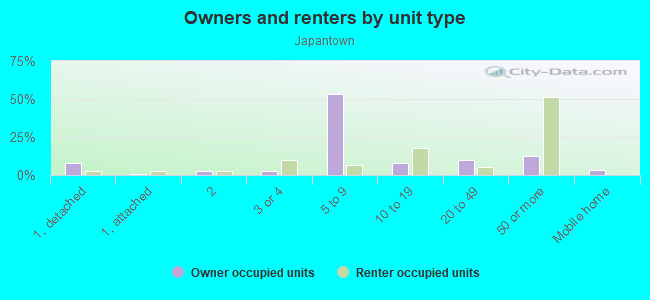
Owner-occupied
Renter-occupied

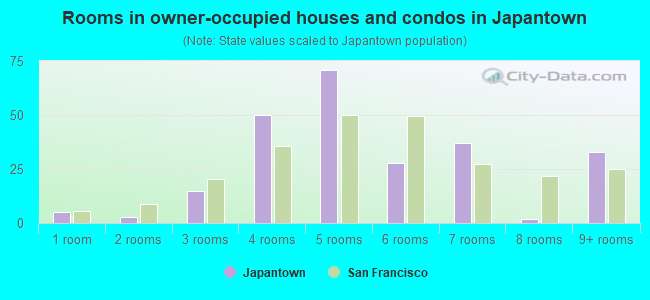
- Rooms in owner-occupied houses and condos in Japantown
- 01 room
- 372 rooms
- 723 rooms
- 1224 rooms
- 495 rooms
- 2166 rooms
- 167 rooms
- 368 rooms
- 529+ rooms
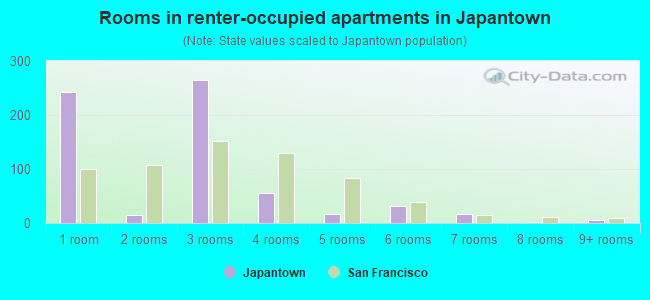
- Rooms in renter-occupied apartments in Japantown
- 2621 room
- 3802 rooms
- 3583 rooms
- 1444 rooms
- 705 rooms
- 336 rooms
- 1497 rooms
- 08 rooms
- 09+ rooms
Owner-occupied
Renter-occupied
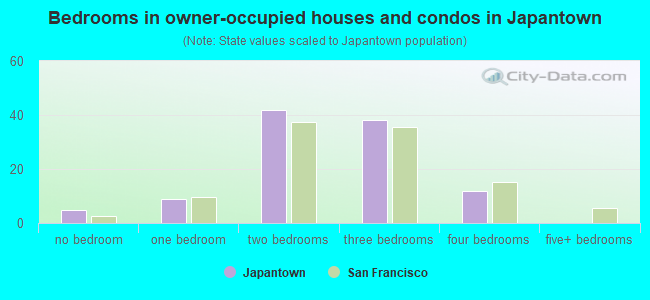
- Bedrooms in owner-occupied houses and condos in Japantown
- 0no bedroom
- 371 bedroom
- 1212 bedrooms
- 3193 bedrooms
- 824 bedrooms
- 515+ bedrooms
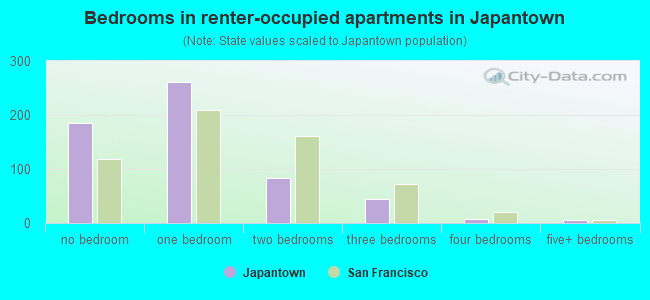
- Bedrooms in renter-occupied apartments in Japantown
- 286no bedroom
- 6811 bedroom
- 1812 bedrooms
- 2163 bedrooms
- 414 bedrooms
- 05+ bedrooms
Average number of cars or other vehicles available in houses/condos:
Average number of cars or other vehicles available in apartments:
| This neighborhood: | 2.3 |
| San Jose: | 2.3 |
Average number of cars or other vehicles available in apartments:
| Here: | 1.4 |
| city: | 1.6 |
Percentage of units with a mortgage:
| Japantown: | 89.7% |
| San Jose: | 66.9% |
Housing prices:
- Average estimated value of detached houses in 2022 (21.0% of all units):
Japantown: $1,172,502 San Jose: $1,532,815
- Average estimated value of townhouses or other attached units in 2022 (16.6% of all units):
This neighborhood: $3,469,720 city: $1,024,857
- Average estimated '22 value of housing units in 5-or-more-unit structures (41.8% of all units):
Japantown: $960,266 San Jose: $791,954
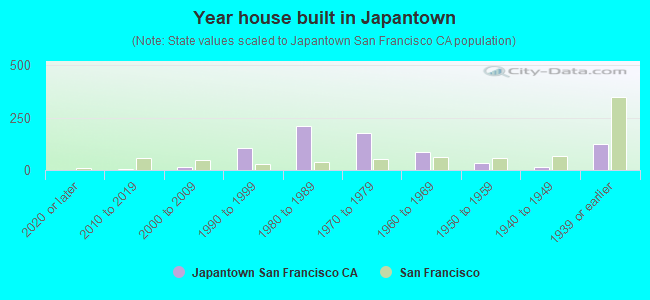
- Year house built in Japantown
- 692020 or later
- 502010 to 2019
- 5442000 to 2009
- 2331990 to 1999
- 3851980 to 1989
- 311970 to 1979
- 311960 to 1969
- 631950 to 1959
- 1371940 to 1949
- 6401939 or earlier
City-data.com crime index for city in 2020 (higher means more crime):
| City: | 268.4 |
| U.S. average: | 219.5 |
Travel time to work (commute)
![Travel time to work (commute)]()
- 27Less than 5 minutes
- 935 to 9 minutes
- 16910 to 14 minutes
- 18915 to 19 minutes
- 15020 to 24 minutes
- 6325 to 29 minutes
- 12430 to 34 minutes
- 1735 to 39 minutes
- 11440 to 44 minutes
- 10745 to 59 minutes
- 13660 to 89 minutes
- 1990 or more minutes

Means of transportation to work
![Means of transportation to work]()
- 55.7%1,506Drove a car alone
- 5.8%156Carpooled
- 0.1%2Bus
- 1.0%28Long-distance train or commuter rail
- 1.2%32Light rail, streetcar or trolley
- 0.6%17Taxi
- 0.6%17Motorcycle
- 0.6%16Bicycle
- 2.3%61Walked
- 1.3%35Other means
- 31.4%850Worked at home

Time leaving home to go to work
![Time leaving home to go to work]()
- 5212:00 a.m. to 4:59 a.m.
- 45:00 a.m. to 5:29 a.m.
- 1255:30 a.m. to 5:59 a.m.
- 946:00 a.m. to 6:29 a.m.
- 366:30 a.m. to 6:59 a.m.
- 2067:00 a.m. to 7:29 a.m.
- 867:30 a.m. to 7:59 a.m.
- 1588:00 a.m. to 8:29 a.m.
- 1098:30 a.m. to 8:59 a.m.
- 1689:00 a.m. to 9:59 a.m.
- 7210:00 a.m. to 10:59 a.m.
- 6611:00 a.m. to 11:59 a.m.
- 2712:00 p.m. to 3:59 p.m.
- 584:00 p.m. to 11:59 p.m.

Occupations of males:
- Percentage of males in management occupations (except farmers):
Here: 5.6% city: 13.0%
- Percentage of males in business and financial operations occupations:
Here: 12.8% city: 4.6%
- Percentage of males in computer and mathematical occupations:
Here: 15.3% city: 13.6%
- Percentage of males in architecture and engineering occupations:
Here: 23.3% city: 10.2%
- Percentage of males in legal occupations:
Here: 1.1% city: 0.8%
- Percentage of males in education, training, and library occupations:
Here: 12.2% city: 2.8%
- Percentage of males in arts, design, entertainment, sports, and media occupations:
Here: 1.5% city: 1.8%
- Percentage of males in healthcare practitioners and technical occupations:
Here: 3.7% city: 2.0%
- Percentage of males in service occupations:
Here: 2.6% city: 12.7%
- Percentage of males in sales and office occupations:
Here: 15.4% city: 12.8%
- Percentage of males in construction, extraction, and maintenance occupations:
Here: 1.4% city: 7.8%
- Percentage of males in transportation occupations:
Here: 4.8% city: 3.6%
Occupations of females:
- Percentage of females in management occupations (except farmers):
Here: 14.2% city: 11.0%
- Percentage of females in business and financial operations occupations:
Here: 11.9% city: 8.6%
- Percentage of females in computer and mathematical occupations:
Here: 3.0% city: 5.4%
- Percentage of females in architecture and engineering occupations:
Here: 14.5% city: 2.8%
- Percentage of females in life, physical, and social science occupations:
Here: 7.2% city: 1.7%
- Percentage of females in community and social services occupations:
Here: 2.6% city: 1.8%
- Percentage of females in education, training, and library occupations:
Here: 8.1% city: 8.1%
- Percentage of females in healthcare practitioners and technical occupations:
Here: 7.5% city: 6.8%
- Percentage of females in sales and office occupations:
Here: 32.9% city: 22.0%
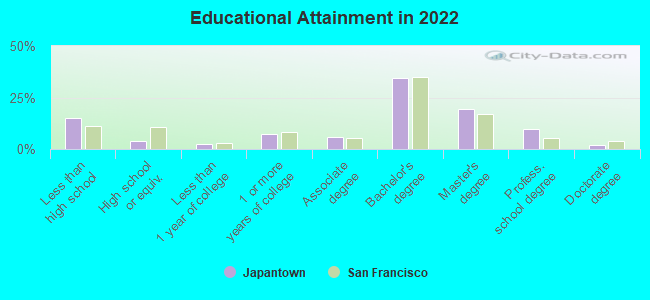
Education in this neighborhood (subdivision or community):
- Percentage of people 3 years and older in K-12 schools:
Japantown: 10.4% San Jose: 16.1%
- Percentage of people 3 years and older in undergraduate colleges:
Japantown: 6.2% San Jose: 6.5%
- Percentage of people 3 years and older in grad. or professional schools:
Japantown: 2.8% San Jose: 2.0%
- Percentage of students K-12 enrolled in private schools:
Japantown: 24.6% San Jose: 14.9%
Percentage of population below poverty level:
| Japantown: | 9.4% |
| San Jose: | 9.0% |
Median year owner moved in (as recorded in 2022):
Median year renter moved in (as recorded in 2022):
| Japantown: | 2015 |
| San Jose: | 2008 |
Median year renter moved in (as recorded in 2022):
| Japantown: | 2019 |
| San Jose: | 2020 |
Percentage of married-couple families with both working:
| Japantown: | 77.0% |
| San Jose: | 72.5% |
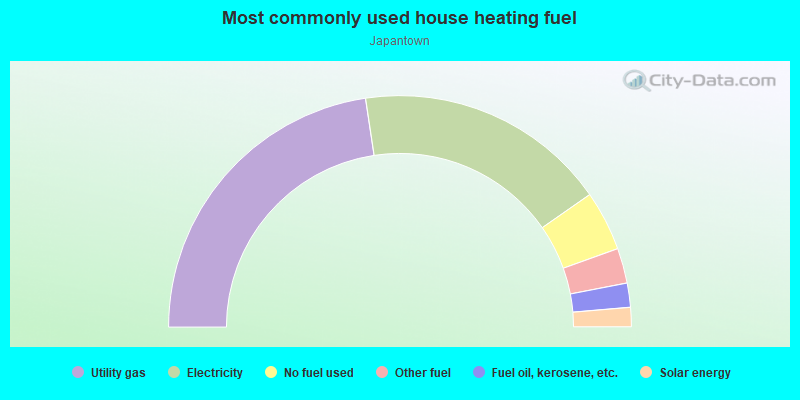
- 50.1%Utility gas
- 46.2%Electricity
- 1.3%No fuel used
- 1.2%Other fuel
- 1.1%Bottled, tank, or LP gas
Roads and streets:
E Empire St
Length: 0.73 miles
Direction: SW-NE
Address range: 1 to 449
Direction: SW-NE
Address range: 1 to 449
Jackson St
Length: 0.73 miles
Direction: SW-NE
Address range: 1 to 450
Direction: SW-NE
Address range: 1 to 450
N 9th St
Length: 0.37 miles
Direction: SE-NW
Address range: 500 to 650
Direction: SE-NW
Address range: 500 to 650
N 10th St
Length: 0.37 miles
Direction: SE-NW
Address range: 500 to 699
Direction: SE-NW
Address range: 500 to 699
N 8th St
Length: 0.26 miles
Directions: N-S, SE-NW
Address range: 500 to 699
Directions: N-S, SE-NW
Address range: 500 to 699
N 1st St (N 1st Street)
Length: 0.23 miles
Direction: SE-NW
Address range: 500 to 649
Direction: SE-NW
Address range: 500 to 649
N 6th St
Length: 0.18 miles
Direction: SE-NW
Address range: 500 to 599
Direction: SE-NW
Address range: 500 to 599
N 4th St
Length: 0.18 miles
Direction: SE-NW
Address range: 500 to 599
Direction: SE-NW
Address range: 500 to 599
N 3rd St
Length: 0.18 miles
Direction: SE-NW
Address range: 500 to 599
Direction: SE-NW
Address range: 500 to 599
N 2nd St
Length: 0.18 miles
Direction: SE-NW
Address range: 500 to 599
Direction: SE-NW
Address range: 500 to 599
N 7th St
Length: 0.18 miles
Direction: SE-NW
Address range: 500 to 599
Direction: SE-NW
Address range: 500 to 599
N 5th St
Length: 0.18 miles
Direction: SE-NW
Address range: 500 to 599
Direction: SE-NW
Address range: 500 to 599
E Taylor St
Length: 0.18 miles
Directions: E-W, SW-NE
Address range: 339 to 449
Directions: E-W, SW-NE
Address range: 339 to 449
Railroad features:
Union Pacific RR
Length: 0.52 miles
Directions: N-S, SE-NW
Directions: N-S, SE-NW