Hyde Park neighborhood in Midland, Texas (TX), 79707 detailed profile
Settings
X


Business Search - 14 Million verified businesses
Area: 0.188 square miles
Population: 782
Population density:
| Hyde Park: | 4,161 people per square mile |
| Midland: | 2,018 people per square mile |

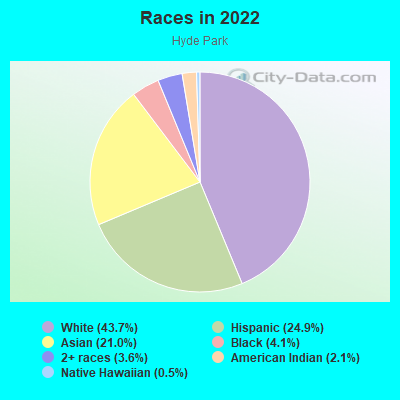
- 33442.7%White
- 30238.6%Hispanic or Latino
- 11214.3%Asian
- 202.6%Black
- 111.4%Two or more races
- 40.5%American Indian
Median household income in 2022:
| Hyde Park: | $97,451 |
| Midland: | $80,235 |
Distribution of median household income
![Distribution of median household income]()
- 14Less than $10,000
- 38$10,000 to $19,999
- 31$20,000 to $29,999
- 48$30,000 to $39,999
- 31$40,000 to $49,999
- 13$50,000 to $59,999
- 33$60,000 to $74,999
- 60$75,000 to $99,999
- 11$100,000 to $124,999
- 93$125,000 to $149,999
- 20$150,000 to $199,999
- 25$200,000 or more

Distribution of owner-occupied house/condo value
![Distribution of owner-occupied house/condo value]()
- 5Less than $50,000
- 16$50,000 to $99,999
- 54$150,000 to $199,999
- 42$200,000 to $249,999
- 151$250,000 to $299,999
- 111$300,000 to $399,999
- 9$400,000 to $499,999
- 6$500,000 to $749,999

Distribution of rent paid by renters
![Distribution of rent paid by renters]()
- 54$1,000 to $1,249
- 9$1,250 to $1,499
- 13$1,500 to $1,999
- 25$2,000 or more

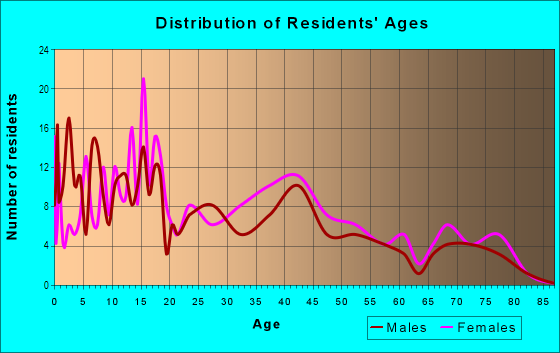
| Males: | 440 |
| Females: | 341 |
Males:
| This neighborhood: | 31.7 years |
| Whole city: | 32.3 years |
| This neighborhood: | 33.8 years |
| Whole city: | 33.3 years |
Average household size:
| Hyde Park: | 2.9 people |
| Midland: | 2.4 people |
Percentage of family households:
| Hyde Park: | 63.0% |
| Midland: | 52.0% |
| Here: | 48.9% |
| Midland: | 46.4% |
Percentage of married-couple families with children (among all households):
| Hyde Park: | 24.4% |
| Midland: | 30.9% |
Percentage of single-mother households (among all households):
| Hyde Park: | 18.7% |
| Midland: | 8.1% |
Percentage of never married males 15 years old and over:
Percentage of never married females 15 years old and over:
| Hyde Park: | 17.2% |
| Midland: | 15.2% |
Percentage of never married females 15 years old and over:
| Hyde Park: | 18.5% |
| city: | 14.9% |
Percentage of people that speak English not well or not at all:
| Hyde Park: | 7.7% |
| Midland: | 5.7% |
Percentage of people born in this state:
Percentage of people born in another U.S. state:
Percentage of native residents but born outside the U.S.:
Percentage of foreign born residents:
| Here: | 67.3% |
| Midland: | 69.5% |
Percentage of people born in another U.S. state:
| Hyde Park: | 24.3% |
| Midland: | 18.2% |
Percentage of native residents but born outside the U.S.:
| Here: | 0.0% |
| city: | 1.2% |
Percentage of foreign born residents:
| Here: | 8.3% |
| Midland: | 11.2% |
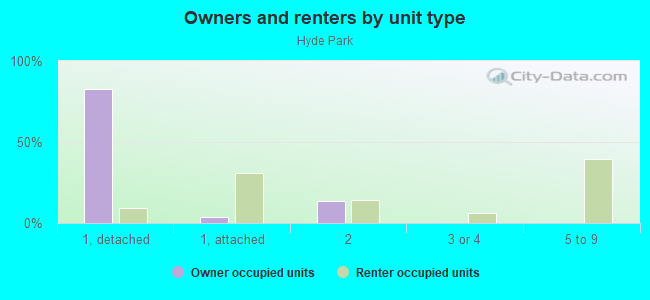
Owner-occupied
Renter-occupied

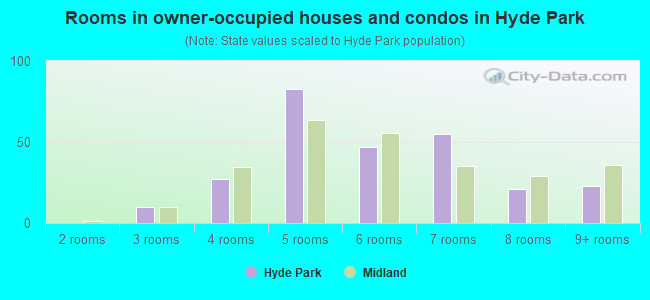
- Rooms in owner-occupied houses and condos in Hyde Park
- 01 room
- 02 rooms
- 103 rooms
- 274 rooms
- 835 rooms
- 476 rooms
- 557 rooms
- 218 rooms
- 239+ rooms
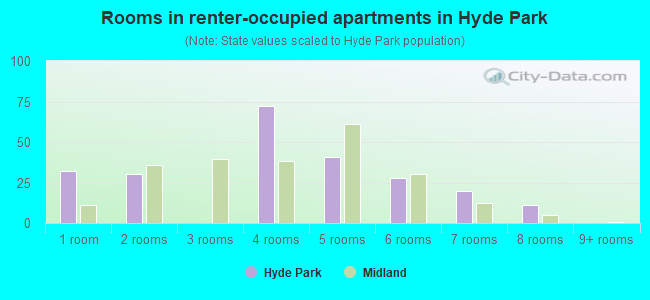
- Rooms in renter-occupied apartments in Hyde Park
- 321 room
- 302 rooms
- 03 rooms
- 724 rooms
- 415 rooms
- 286 rooms
- 207 rooms
- 118 rooms
- 09+ rooms
Owner-occupied
Renter-occupied
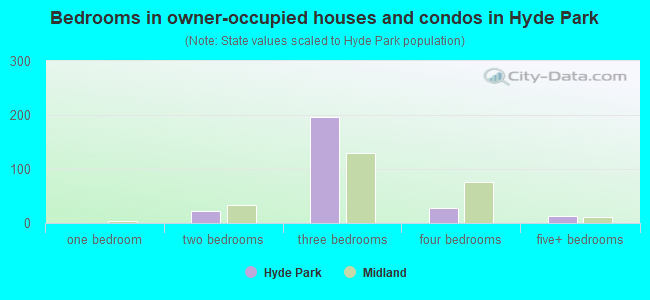
- Bedrooms in owner-occupied houses and condos in Hyde Park
- 0no bedroom
- 01 bedroom
- 222 bedrooms
- 1963 bedrooms
- 274 bedrooms
- 135+ bedrooms
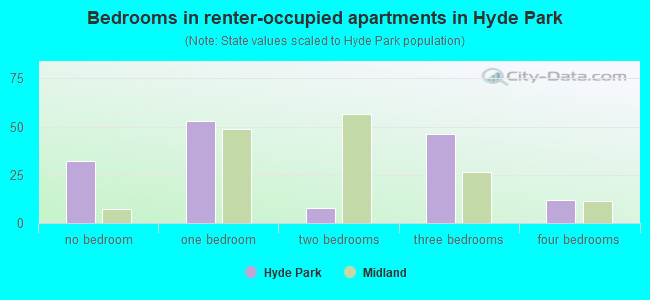
- Bedrooms in renter-occupied apartments in Hyde Park
- 32no bedroom
- 531 bedroom
- 82 bedrooms
- 463 bedrooms
- 124 bedrooms
- 05+ bedrooms
Average number of cars or other vehicles available in houses/condos:
Average number of cars or other vehicles available in apartments:
| This neighborhood: | 2.0 |
| Midland: | 2.1 |
Average number of cars or other vehicles available in apartments:
| Here: | 8.5 |
| city: | 1.4 |
Percentage of units with a mortgage:
| Hyde Park: | 61.4% |
| Midland: | 58.2% |
Average estimated value of detached houses in 2022 (93.2% of all units):
| Hyde Park: | $290,345 |
| Texas: | $369,058 |

- Year house built in Hyde Park
- 02020 or later
- 02010 to 2019
- 62000 to 2009
- 101990 to 1999
- 311980 to 1989
- 351970 to 1979
- 1871960 to 1969
- 111950 to 1959
- 01940 to 1949
- 01939 or earlier
City-data.com crime index for city in 2020 (higher means more crime):
| City: | 223.8 |
| U.S. average: | 219.5 |
Travel time to work (commute)
![Travel time to work (commute)]()
- 69Less than 5 minutes
- 555 to 9 minutes
- 16910 to 14 minutes
- 10015 to 19 minutes
- 7420 to 24 minutes
- 2625 to 29 minutes
- 5130 to 34 minutes
- 735 to 39 minutes
- 240 to 44 minutes
- 2945 to 59 minutes
- 1060 to 89 minutes
- 190 or more minutes

Means of transportation to work
![Means of transportation to work]()
- 94.9%429Drove a car alone
- 4.9%22Carpooled
- 7.1%32Other means
- 15.7%71Worked at home

Time leaving home to go to work
![Time leaving home to go to work]()
- 2112:00 a.m. to 4:59 a.m.
- 425:00 a.m. to 5:29 a.m.
- 75:30 a.m. to 5:59 a.m.
- 496:00 a.m. to 6:29 a.m.
- 526:30 a.m. to 6:59 a.m.
- 657:00 a.m. to 7:29 a.m.
- 807:30 a.m. to 7:59 a.m.
- 1208:00 a.m. to 8:29 a.m.
- 88:30 a.m. to 8:59 a.m.
- 739:00 a.m. to 9:59 a.m.
- 1110:00 a.m. to 10:59 a.m.
- 911:00 a.m. to 11:59 a.m.
- 1512:00 p.m. to 3:59 p.m.
- 374:00 p.m. to 11:59 p.m.

Occupations of males:
- Percentage of males in management occupations (except farmers):
Here: 2.3% city: 14.6%
- Percentage of males in business and financial operations occupations:
Here: 2.8% city: 3.8%
- Percentage of males in architecture and engineering occupations:
Here: 8.4% city: 7.5%
- Percentage of males in arts, design, entertainment, sports, and media occupations:
Here: 3.7% city: 0.7%
- Percentage of males in service occupations:
Here: 10.1% city: 9.5%
- Percentage of males in sales and office occupations:
Here: 4.5% city: 14.8%
- Percentage of males in construction, extraction, and maintenance occupations:
Here: 4.8% city: 15.1%
- Percentage of males in production occupations:
Here: 19.1% city: 7.5%
- Percentage of males in material moving occupations:
Here: 11.3% city: 4.8%
Occupations of females:
- Percentage of females in architecture and engineering occupations:
Here: 5.0% city: 1.8%
- Percentage of females in community and social services occupations:
Here: 2.3% city: 1.7%
- Percentage of females in healthcare practitioners and technical occupations:
Here: 3.9% city: 6.8%
- Percentage of females in service occupations:
Here: 17.4% city: 16.8%
- Percentage of females in sales and office occupations:
Here: 22.4% city: 33.2%
- Percentage of females in production occupations:
Here: 8.1% city: 2.0%
- Percentage of females in material moving occupations:
Here: 43.2% city: 1.8%
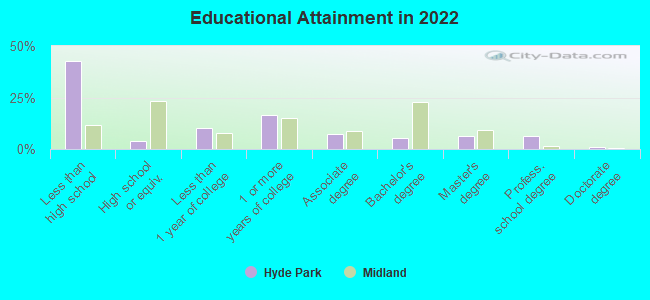
Education in this neighborhood (subdivision or community):
- Percentage of people 3 years and older in K-12 schools:
Hyde Park: 23.2% Midland: 22.4%
- Percentage of people 3 years and older in undergraduate colleges:
Hyde Park: 9.6% Midland: 3.0%
- Percentage of people 3 years and older in grad. or professional schools:
Hyde Park: 2.5% Midland: 1.8%
- Percentage of students K-12 enrolled in private schools:
Hyde Park: 56.8% Midland: 16.2%
Percentage of population below poverty level:
| Hyde Park: | 7.5% |
| Midland: | 11.7% |
Median year owner moved in (as recorded in 2022):
| Hyde Park: | 2013 |
| Midland: | 2015 |
Percentage of married-couple families with both working:
| Hyde Park: | 156.5% |
| Midland: | 63.2% |
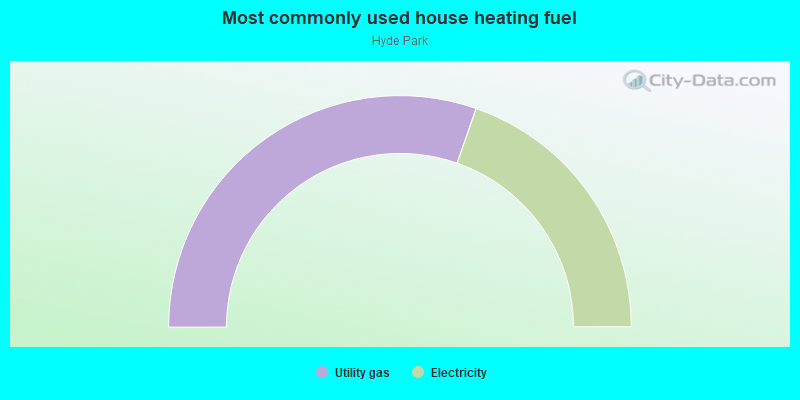
- 60.7%Utility gas
- 39.3%Electricity
Roads and streets:
Camarie Ave
Length: 0.43 miles
Directions: E-W, N-S, SE-NW, SW-NE
Address range: 3300 to 3699
Directions: E-W, N-S, SE-NW, SW-NE
Address range: 3300 to 3699
W Shandon Ave
Length: 0.41 miles
Direction: E-W
Address range: 3300 to 3511
Direction: E-W
Address range: 3300 to 3511
N Midkiff Rd
Length: 0.32 miles
Direction: N-S
Address range: 2600 to 3203
Direction: N-S
Address range: 2600 to 3203
Tarleton St
Length: 0.17 miles
Direction: N-S
Address range: 3100 to 3217
Direction: N-S
Address range: 3100 to 3217
Terrace Ave
Length: 0.15 miles
Directions: E-W, N-S, SE-NW, SW-NE
Address range: 3300 to 3399
Directions: E-W, N-S, SE-NW, SW-NE
Address range: 3300 to 3399
Neely Ave
Length: 0.12 miles
Direction: E-W
Address range: 3300 to 3323
Direction: E-W
Address range: 3300 to 3323