Huntridge Park neighborhood in Las Vegas, Nevada (NV), 89104 detailed profile
Settings
X


Business Search - 14 Million verified businesses
Area: 0.125 square miles
Population: 708
Population density:
| Huntridge Park: | 5,644 people per square mile |
| Las Vegas: | 5,792 people per square mile |

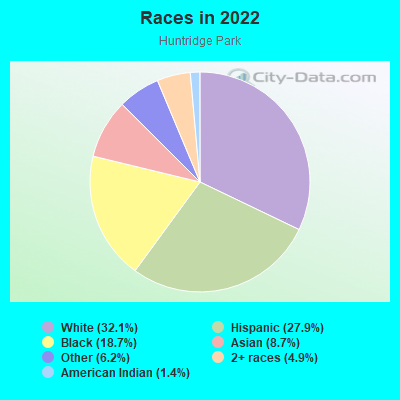
- 24432.1%White
- 21227.9%Hispanic or Latino
- 14218.7%Black
- 668.7%Asian
- 476.2%Some other race
- 374.9%Two or more races
- 111.4%American Indian
Distribution of median household income
![Distribution of median household income]()
- 32Less than $10,000
- 34$10,000 to $19,999
- 75$20,000 to $29,999
- 52$30,000 to $39,999
- 40$40,000 to $49,999
- 15$50,000 to $59,999
- 23$60,000 to $74,999
- 35$75,000 to $99,999
- 21$100,000 to $124,999
- 31$125,000 to $149,999
- 57$150,000 to $199,999
- 31$200,000 or more

Distribution of owner-occupied house/condo value
![Distribution of owner-occupied house/condo value]()
- 23Less than $50,000
- 23$50,000 to $99,999
- 12$100,000 to $149,999
- 13$150,000 to $199,999
- 11$200,000 to $249,999
- 42$250,000 to $299,999
- 47$300,000 to $399,999
- 53$400,000 to $499,999
- 15$500,000 to $749,999

Distribution of rent paid by renters
![Distribution of rent paid by renters]()
- 4$100 to $199
- 21$500 to $599
- 31$700 to $799
- 17$800 to $899
- 17$900 to $999
- 10$1,000 to $1,249
- 27$1,250 to $1,499
- 49$1,500 to $1,999
- 12$2,000 or more

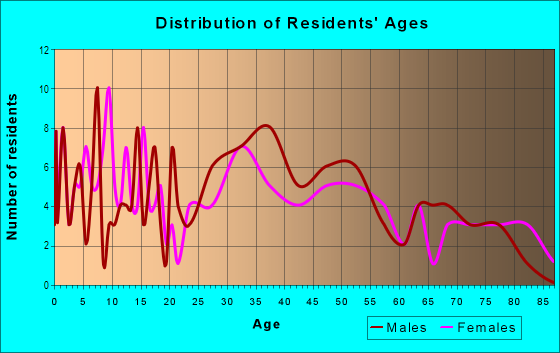
| Males: | 359 |
| Females: | 348 |
Males:
| This neighborhood: | 43.6 years |
| Whole city: | 38.4 years |
| This neighborhood: | 41.8 years |
| Whole city: | 38.9 years |
Average household size:
| Huntridge Park: | 7.6 people |
| Las Vegas: | 2.7 people |
Percentage of family households:
| Huntridge Park: | 39.4% |
| Las Vegas: | 45.8% |
| Here: | 33.6% |
| Las Vegas: | 40.9% |
Percentage of married-couple families with children (among all households):
| Huntridge Park: | 36.2% |
| Las Vegas: | 23.4% |
Percentage of single-mother households (among all households):
| Huntridge Park: | 18.9% |
| Las Vegas: | 10.1% |
Percentage of never married males 15 years old and over:
Percentage of never married females 15 years old and over:
| Huntridge Park: | 22.0% |
| Las Vegas: | 19.7% |
Percentage of never married females 15 years old and over:
| Huntridge Park: | 23.3% |
| city: | 17.0% |
Percentage of people that speak English not well or not at all:
| Huntridge Park: | 7.2% |
| Las Vegas: | 7.0% |
Percentage of people born in this state:
Percentage of people born in another U.S. state:
Percentage of native residents but born outside the U.S.:
Percentage of foreign born residents:
| Here: | 27.5% |
| Las Vegas: | 27.3% |
Percentage of people born in another U.S. state:
| Huntridge Park: | 38.4% |
| Las Vegas: | 49.8% |
Percentage of native residents but born outside the U.S.:
| Here: | 2.1% |
| city: | 1.9% |
Percentage of foreign born residents:
| Here: | 32.0% |
| Las Vegas: | 21.0% |
Owner-occupied
Renter-occupied

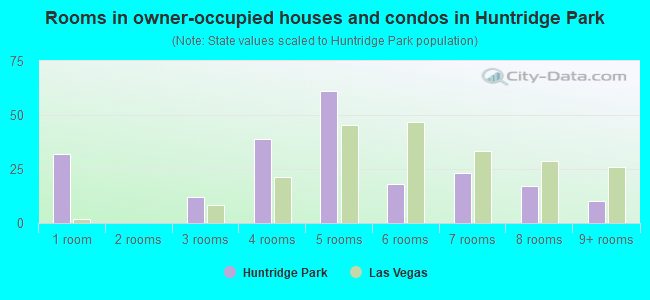
- Rooms in owner-occupied houses and condos in Huntridge Park
- 321 room
- 02 rooms
- 123 rooms
- 394 rooms
- 615 rooms
- 186 rooms
- 237 rooms
- 178 rooms
- 109+ rooms
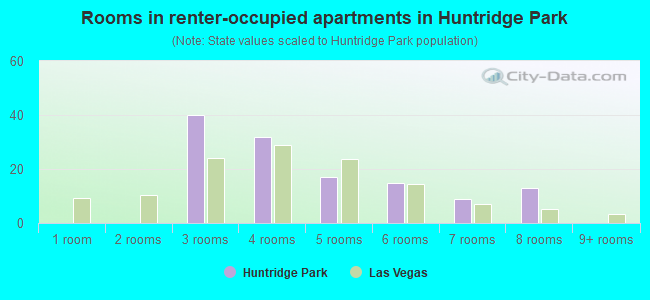
- Rooms in renter-occupied apartments in Huntridge Park
- 01 room
- 02 rooms
- 403 rooms
- 324 rooms
- 175 rooms
- 156 rooms
- 97 rooms
- 138 rooms
- 09+ rooms
Owner-occupied
Renter-occupied
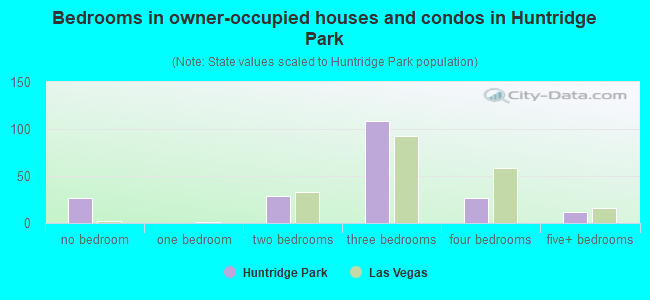
- Bedrooms in owner-occupied houses and condos in Huntridge Park
- 27no bedroom
- 01 bedroom
- 292 bedrooms
- 1093 bedrooms
- 274 bedrooms
- 125+ bedrooms
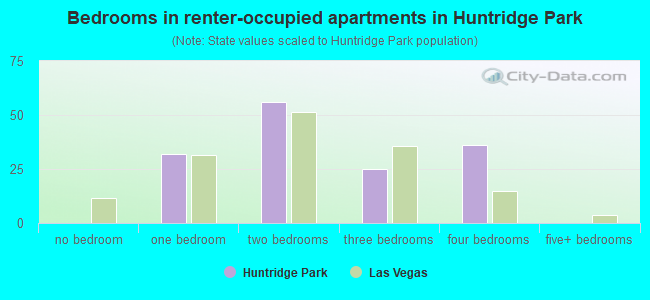
- Bedrooms in renter-occupied apartments in Huntridge Park
- 0no bedroom
- 321 bedroom
- 562 bedrooms
- 253 bedrooms
- 364 bedrooms
- 05+ bedrooms
Average number of cars or other vehicles available in houses/condos:
Average number of cars or other vehicles available in apartments:
| This neighborhood: | 1.8 |
| Las Vegas: | 2.0 |
Average number of cars or other vehicles available in apartments:
| Here: | 2.8 |
| city: | 1.3 |
Percentage of units with a mortgage:
| Huntridge Park: | 68.0% |
| Las Vegas: | 69.3% |
Average estimated value of detached houses in 2022 (97.2% of all units):
| Huntridge Park: | $319,353 |
| Nevada: | $549,327 |
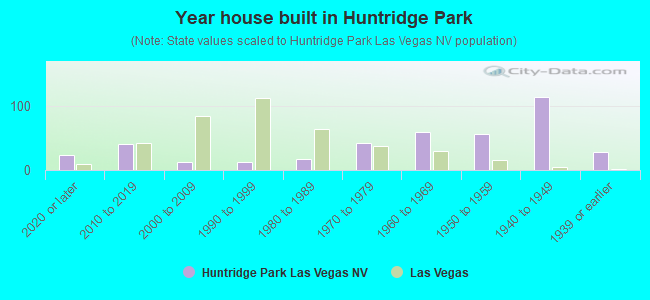
- Year house built in Huntridge Park
- 232020 or later
- 412010 to 2019
- 132000 to 2009
- 121990 to 1999
- 181980 to 1989
- 421970 to 1979
- 591960 to 1969
- 561950 to 1959
- 1141940 to 1949
- 281939 or earlier
City-data.com crime index for city in 2020 (higher means more crime):
| City: | 280.7 |
| U.S. average: | 219.5 |
Travel time to work (commute)
![Travel time to work (commute)]()
- 2Less than 5 minutes
- 355 to 9 minutes
- 7910 to 14 minutes
- 8115 to 19 minutes
- 6120 to 24 minutes
- 525 to 29 minutes
- 5330 to 34 minutes
- 435 to 39 minutes
- 640 to 44 minutes
- 5545 to 59 minutes
- 960 to 89 minutes
- 390 or more minutes

Means of transportation to work
![Means of transportation to work]()
- 62.6%264Drove a car alone
- 4.7%20Carpooled
- 6.4%27Bus
- 3.1%13Subway or elevated rail
- 0.7%3Taxi
- 9.5%40Bicycle
- 10.0%42Walked
- 7.8%33Other means
- 16.1%68Worked at home

Time leaving home to go to work
![Time leaving home to go to work]()
- 2412:00 a.m. to 4:59 a.m.
- 545:00 a.m. to 5:29 a.m.
- 155:30 a.m. to 5:59 a.m.
- 136:00 a.m. to 6:29 a.m.
- 266:30 a.m. to 6:59 a.m.
- 277:00 a.m. to 7:29 a.m.
- 397:30 a.m. to 7:59 a.m.
- 198:00 a.m. to 8:29 a.m.
- 278:30 a.m. to 8:59 a.m.
- 139:00 a.m. to 9:59 a.m.
- 1110:00 a.m. to 10:59 a.m.
- 411:00 a.m. to 11:59 a.m.
- 7812:00 p.m. to 3:59 p.m.
- 344:00 p.m. to 11:59 p.m.

Occupations of males:
- Percentage of males in management occupations (except farmers):
Here: 6.8% city: 9.6%
- Percentage of males in business and financial operations occupations:
Here: 3.5% city: 3.6%
- Percentage of males in computer and mathematical occupations:
Here: 3.9% city: 3.4%
- Percentage of males in legal occupations:
Here: 11.5% city: 0.9%
- Percentage of males in education, training, and library occupations:
Here: 3.8% city: 2.5%
- Percentage of males in arts, design, entertainment, sports, and media occupations:
Here: 5.2% city: 2.5%
- Percentage of males in service occupations:
Here: 35.7% city: 23.3%
- Percentage of males in sales and office occupations:
Here: 6.0% city: 16.6%
- Percentage of males in construction, extraction, and maintenance occupations:
Here: 7.5% city: 10.6%
- Percentage of males in transportation occupations:
Here: 3.0% city: 6.6%
- Percentage of males in material moving occupations:
Here: 8.6% city: 5.4%
Occupations of females:
- Percentage of females in management occupations (except farmers):
Here: 4.1% city: 8.5%
- Percentage of females in business and financial operations occupations:
Here: 3.7% city: 5.7%
- Percentage of females in life, physical, and social science occupations:
Here: 2.1% city: 0.4%
- Percentage of females in community and social services occupations:
Here: 13.7% city: 1.9%
- Percentage of females in legal occupations:
Here: 16.2% city: 1.5%
- Percentage of females in education, training, and library occupations:
Here: 4.8% city: 8.0%
- Percentage of females in healthcare practitioners and technical occupations:
Here: 5.9% city: 7.4%
- Percentage of females in service occupations:
Here: 26.5% city: 26.5%
- Percentage of females in sales and office occupations:
Here: 36.4% city: 30.5%
- Percentage of females in transportation occupations:
Here: 2.8% city: 1.6%
- Percentage of females in material moving occupations:
Here: 1.9% city: 2.2%
Percentage of people 16-64 in Armed Forces:
| Huntridge Park: | 0.5% |
| Las Vegas: | 1.0% |
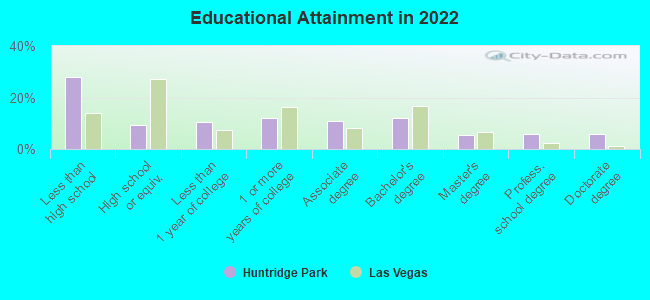
Education in this neighborhood (subdivision or community):
- Percentage of people 3 years and older in K-12 schools:
Huntridge Park: 13.9% Las Vegas: 17.4%
- Percentage of people 3 years and older in undergraduate colleges:
Huntridge Park: 6.7% Las Vegas: 4.2%
- Percentage of people 3 years and older in grad. or professional schools:
Huntridge Park: 6.0% Las Vegas: 1.0%
- Percentage of students K-12 enrolled in private schools:
Huntridge Park: 16.5% Las Vegas: 12.9%
Percentage of population below poverty level:
| Huntridge Park: | 19.2% |
| Las Vegas: | 14.1% |
Median year owner moved in (as recorded in 2022):
| Huntridge Park: | 2008 |
| Las Vegas: | 2015 |
Percentage of married-couple families with both working:
| Huntridge Park: | 269.5% |
| Las Vegas: | 62.0% |
- 79.2%Electricity
- 17.0%Utility gas
- 3.8%No fuel used
Roads and streets:
S 15th St
Length: 0.44 miles
Direction: N-S
Address range: 1120 to 1699
Direction: N-S
Address range: 1120 to 1699
S 13th St
Length: 0.24 miles
Direction: N-S
Address range: 1200 to 1699
Direction: N-S
Address range: 1200 to 1699
Wengert Ave
Length: 0.22 miles
Direction: E-W
Address range: 1300 to 1499
Direction: E-W
Address range: 1300 to 1499
Sweeney Ave
Length: 0.22 miles
Direction: E-W
Address range: 1300 to 1499
Direction: E-W
Address range: 1300 to 1499
Franklin Ave
Length: 0.22 miles
Direction: E-W
Address range: 1300 to 1499
Direction: E-W
Address range: 1300 to 1499
Bracken Ave
Length: 0.22 miles
Direction: E-W
Address range: 1300 to 1499
Direction: E-W
Address range: 1300 to 1499
Griffith Ave
Length: 0.22 miles
Direction: E-W
Address range: 1300 to 1499
Direction: E-W
Address range: 1300 to 1499
Cottonwood Pl
Length: 0.16 miles
Directions: E-W, N-S, SW-NE
Address range: 1400 to 1499
Directions: E-W, N-S, SW-NE
Address range: 1400 to 1499
E Oakey Blvd
Length: 0.16 miles
Direction: E-W
Address range: 1300 to 1399
Direction: E-W
Address range: 1300 to 1399
Francis Ave
Length: 0.14 miles
Directions: E-W, N-S, SE-NW
Address range: 1400 to 1499
Directions: E-W, N-S, SE-NW
Address range: 1400 to 1499