Horizon Vistas neighborhood in Las Vegas, Nevada (NV), 89123 detailed profile
Settings
X

Business Search - 14 Million verified businesses
Area: 0.092 square miles
Population: 443
Population density:
| Horizon Vistas: | 4,837 people per square mile |
| Las Vegas: | 5,792 people per square mile |

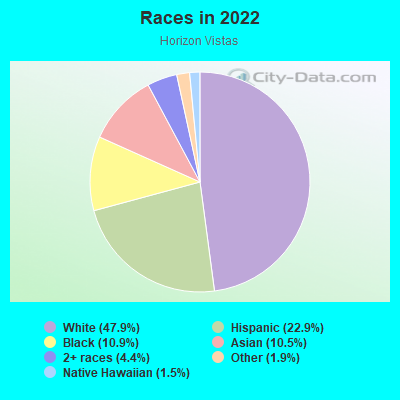
- 22847.9%White
- 10922.9%Hispanic or Latino
- 5210.9%Black
- 5010.5%Asian
- 214.4%Two or more races
- 91.9%Some other race
- 71.5%Native Hawaiian and Other
Pacific Islander
Median household income in 2022:
| Horizon Vistas: | $102,075 |
| Las Vegas: | $68,905 |
Distribution of median household income
![Distribution of median household income]()
- 7Less than $10,000
- 3$10,000 to $19,999
- 6$20,000 to $29,999
- 11$30,000 to $39,999
- 20$40,000 to $49,999
- 7$50,000 to $59,999
- 17$60,000 to $74,999
- 28$75,000 to $99,999
- 23$100,000 to $124,999
- 36$125,000 to $149,999
- 12$150,000 to $199,999
- 19$200,000 or more

Distribution of owner-occupied house/condo value
![Distribution of owner-occupied house/condo value]()
- 5Less than $50,000
- 5$50,000 to $99,999
- 6$100,000 to $149,999
- 5$150,000 to $199,999
- 3$200,000 to $249,999
- 8$250,000 to $299,999
- 47$300,000 to $399,999
- 43$400,000 to $499,999
- 33$500,000 to $749,999
- 8$750,000 to $999,999
- 2$1,000,000 or more

Distribution of rent paid by renters
![Distribution of rent paid by renters]()
- 4$700 to $799
- 2$900 to $999
- 4$1,000 to $1,249
- 19$1,250 to $1,499
- 6$1,500 to $1,999
- 5$2,000 or more

Median rent in 2022:
| Horizon Vistas: | $1,528 |
| Las Vegas: | $1,277 |
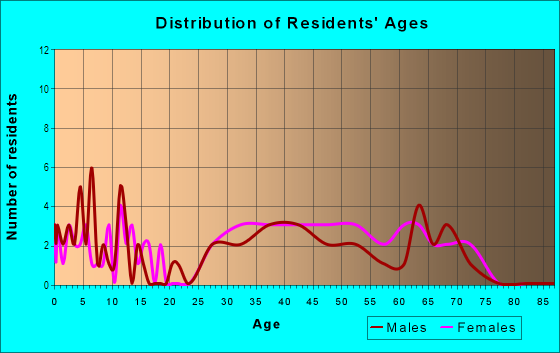
| Males: | 214 |
| Females: | 228 |
Males:
| This neighborhood: | 40.6 years |
| Whole city: | 38.4 years |
| This neighborhood: | 44.6 years |
| Whole city: | 38.9 years |
Average household size:
| Horizon Vistas: | 2.5 people |
| Las Vegas: | 2.7 people |
Percentage of family households:
| Horizon Vistas: | 48.3% |
| Las Vegas: | 45.8% |
| Here: | 53.9% |
| Las Vegas: | 40.9% |
Percentage of married-couple families with children (among all households):
| Horizon Vistas: | 31.1% |
| Las Vegas: | 23.4% |
Percentage of single-mother households (among all households):
| Horizon Vistas: | 5.5% |
| Las Vegas: | 10.1% |
Percentage of never married males 15 years old and over:
Percentage of never married females 15 years old and over:
| Horizon Vistas: | 14.1% |
| Las Vegas: | 19.7% |
Percentage of never married females 15 years old and over:
| Horizon Vistas: | 12.2% |
| city: | 17.0% |
Percentage of people that speak English not well or not at all:
| Horizon Vistas: | 4.4% |
| Las Vegas: | 7.0% |
Percentage of people born in this state:
Percentage of people born in another U.S. state:
Percentage of native residents but born outside the U.S.:
Percentage of foreign born residents:
| Here: | 20.6% |
| Las Vegas: | 27.3% |
Percentage of people born in another U.S. state:
| Horizon Vistas: | 57.0% |
| Las Vegas: | 49.8% |
Percentage of native residents but born outside the U.S.:
| Here: | 2.2% |
| city: | 1.9% |
Percentage of foreign born residents:
| Here: | 20.2% |
| Las Vegas: | 21.0% |
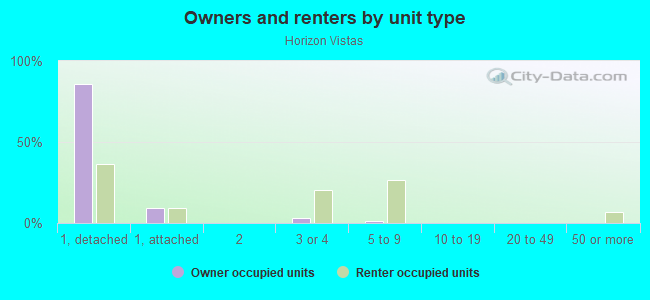
Owner-occupied
Renter-occupied

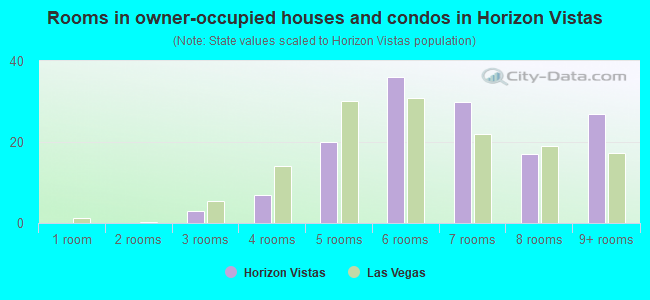
- Rooms in owner-occupied houses and condos in Horizon Vistas
- 01 room
- 02 rooms
- 33 rooms
- 74 rooms
- 205 rooms
- 366 rooms
- 307 rooms
- 178 rooms
- 279+ rooms
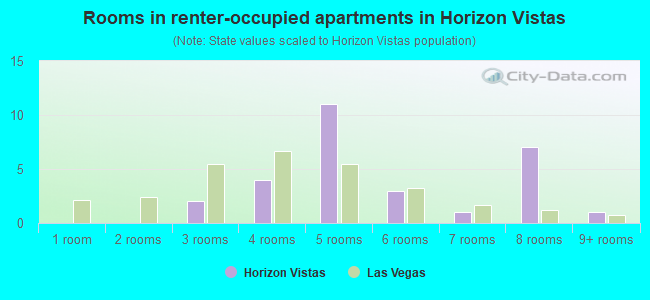
- Rooms in renter-occupied apartments in Horizon Vistas
- 01 room
- 02 rooms
- 23 rooms
- 44 rooms
- 115 rooms
- 36 rooms
- 17 rooms
- 78 rooms
- 19+ rooms
Owner-occupied
Renter-occupied
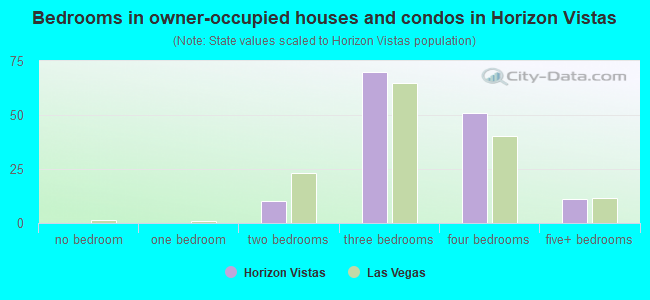
- Bedrooms in owner-occupied houses and condos in Horizon Vistas
- 0no bedroom
- 01 bedroom
- 102 bedrooms
- 703 bedrooms
- 514 bedrooms
- 115+ bedrooms
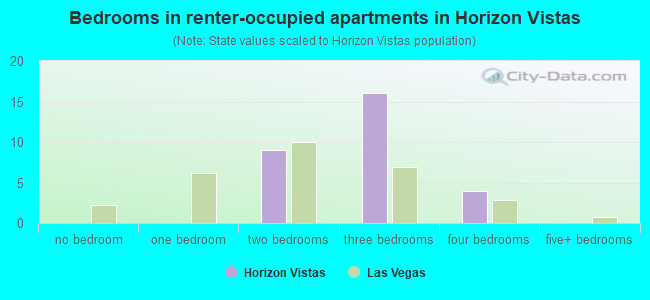
- Bedrooms in renter-occupied apartments in Horizon Vistas
- 0no bedroom
- 01 bedroom
- 92 bedrooms
- 163 bedrooms
- 44 bedrooms
- 05+ bedrooms
Average number of cars or other vehicles available in houses/condos:
Average number of cars or other vehicles available in apartments:
| This neighborhood: | 2.0 |
| Las Vegas: | 2.0 |
Average number of cars or other vehicles available in apartments:
| Here: | 1.9 |
| city: | 1.3 |
Percentage of units with a mortgage:
| Horizon Vistas: | 64.8% |
| Las Vegas: | 69.3% |
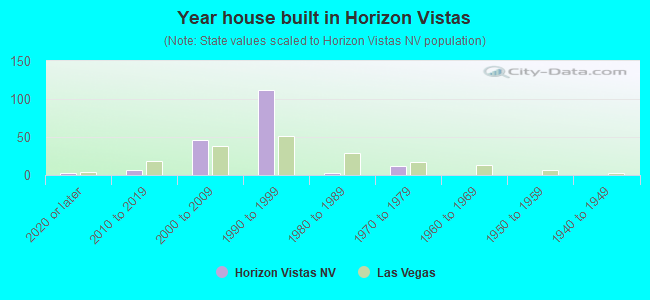
- Year house built in Horizon Vistas
- 32020 or later
- 62010 to 2019
- 462000 to 2009
- 1121990 to 1999
- 21980 to 1989
- 121970 to 1979
- 01960 to 1969
- 01950 to 1959
- 01940 to 1949
- 01939 or earlier
City-data.com crime index for city in 2020 (higher means more crime):
| City: | 280.7 |
| U.S. average: | 219.5 |
Travel time to work (commute)
![Travel time to work (commute)]()
- 185 to 9 minutes
- 3910 to 14 minutes
- 2815 to 19 minutes
- 3520 to 24 minutes
- 2725 to 29 minutes
- 2330 to 34 minutes
- 335 to 39 minutes
- 940 to 44 minutes
- 1060 to 89 minutes

Means of transportation to work
![Means of transportation to work]()
- 85.9%179Drove a car alone
- 3.4%7Carpooled
- 2.9%6Ferryboat
- 1.4%3Motorcycle
- 5.8%12Worked at home

Time leaving home to go to work
![Time leaving home to go to work]()
- 712:00 a.m. to 4:59 a.m.
- 65:00 a.m. to 5:29 a.m.
- 75:30 a.m. to 5:59 a.m.
- 286:00 a.m. to 6:29 a.m.
- 86:30 a.m. to 6:59 a.m.
- 207:00 a.m. to 7:29 a.m.
- 137:30 a.m. to 7:59 a.m.
- 218:00 a.m. to 8:29 a.m.
- 128:30 a.m. to 8:59 a.m.
- 279:00 a.m. to 9:59 a.m.
- 810:00 a.m. to 10:59 a.m.
- 2512:00 p.m. to 3:59 p.m.
- 84:00 p.m. to 11:59 p.m.

Occupations of males:
- Percentage of males in management occupations (except farmers):
Here: 7.4% city: 9.6%
- Percentage of males in business and financial operations occupations:
Here: 3.1% city: 3.6%
- Percentage of males in computer and mathematical occupations:
Here: 1.5% city: 3.4%
- Percentage of males in architecture and engineering occupations:
Here: 4.4% city: 1.8%
- Percentage of males in legal occupations:
Here: 1.6% city: 0.9%
- Percentage of males in arts, design, entertainment, sports, and media occupations:
Here: 11.0% city: 2.5%
- Percentage of males in healthcare practitioners and technical occupations:
Here: 4.0% city: 3.3%
- Percentage of males in service occupations:
Here: 27.2% city: 23.3%
- Percentage of males in sales and office occupations:
Here: 8.6% city: 16.6%
- Percentage of males in construction, extraction, and maintenance occupations:
Here: 4.8% city: 10.6%
- Percentage of males in production occupations:
Here: 4.9% city: 3.3%
- Percentage of males in transportation occupations:
Here: 12.2% city: 6.6%
- Percentage of males in material moving occupations:
Here: 2.5% city: 5.4%
Occupations of females:
- Percentage of females in management occupations (except farmers):
Here: 6.9% city: 8.5%
- Percentage of females in business and financial operations occupations:
Here: 1.1% city: 5.7%
- Percentage of females in computer and mathematical occupations:
Here: 2.8% city: 1.1%
- Percentage of females in architecture and engineering occupations:
Here: 3.4% city: 0.4%
- Percentage of females in community and social services occupations:
Here: 5.5% city: 1.9%
- Percentage of females in legal occupations:
Here: 7.9% city: 1.5%
- Percentage of females in education, training, and library occupations:
Here: 7.6% city: 8.0%
- Percentage of females in arts, design, entertainment, sports, and media occupations:
Here: 1.6% city: 1.8%
- Percentage of females in healthcare practitioners and technical occupations:
Here: 13.2% city: 7.4%
- Percentage of females in service occupations:
Here: 15.9% city: 26.5%
- Percentage of females in sales and office occupations:
Here: 31.2% city: 30.5%
- Percentage of females in material moving occupations:
Here: 2.5% city: 2.2%
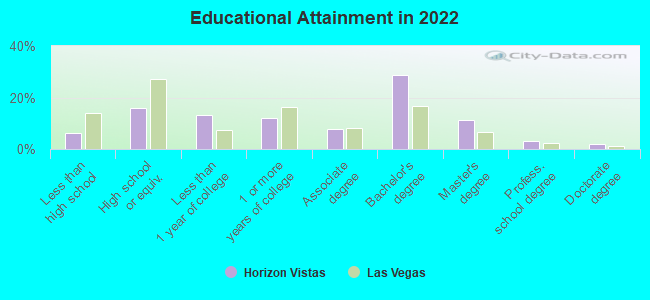
Education in this neighborhood (subdivision or community):
- Percentage of people 3 years and older in K-12 schools:
Horizon Vistas: 17.1% Las Vegas: 17.4%
- Percentage of people 3 years and older in undergraduate colleges:
Horizon Vistas: 2.5% Las Vegas: 4.2%
- Percentage of people 3 years and older in grad. or professional schools:
Horizon Vistas: 0.9% Las Vegas: 1.0%
- Percentage of students K-12 enrolled in private schools:
Horizon Vistas: 40.5% Las Vegas: 12.9%
Percentage of population below poverty level:
| Horizon Vistas: | 4.2% |
| Las Vegas: | 14.1% |
Median year owner moved in (as recorded in 2022):
Median year renter moved in (as recorded in 2022):
| Horizon Vistas: | 2012 |
| Las Vegas: | 2015 |
Median year renter moved in (as recorded in 2022):
| Horizon Vistas: | 2017 |
| Las Vegas: | 2020 |
Percentage of married-couple families with both working:
| Horizon Vistas: | 81.7% |
| Las Vegas: | 62.0% |
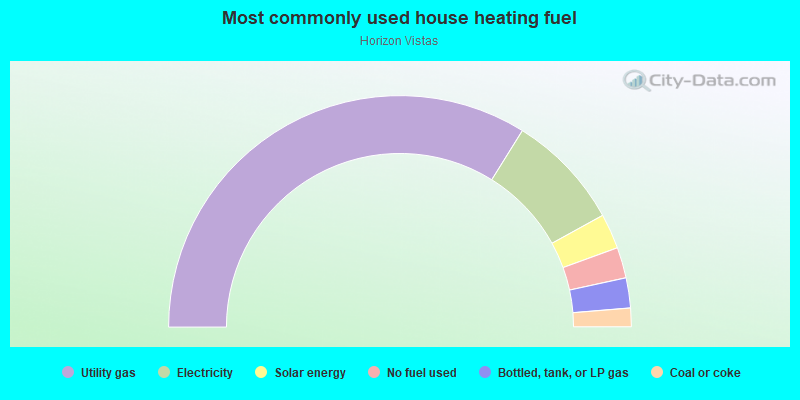
- 67.7%Utility gas
- 16.2%Electricity
- 4.9%Solar energy
- 4.3%No fuel used
- 4.2%Bottled, tank, or LP gas
- 2.6%Coal or coke
Roads and streets:
Golden Vista Dr
Length: 0.37 miles
Direction: E-W
Address range: 1600 to 1999
Direction: E-W
Address range: 1600 to 1999
Horizon Sunset Dr
Length: 0.29 miles
Direction: E-W
Address range: 1600 to 1999
Direction: E-W
Address range: 1600 to 1999
Golden Horizon Dr
Length: 0.25 miles
Direction: E-W
Address range: 1600 to 1999
Direction: E-W
Address range: 1600 to 1999
Dakota Hills Ave
Length: 0.23 miles
Direction: E-W
Address range: 1800 to 2099
Direction: E-W
Address range: 1800 to 2099
Spencer St
Length: 0.21 miles
Direction: N-S
Address range: 8130 to 8199
Direction: N-S
Address range: 8130 to 8199
Fort Laramie Ln
Length: 0.19 miles
Direction: E-W
Address range: 1800 to 2099
Direction: E-W
Address range: 1800 to 2099
Indian Summer Dr
Length: 0.15 miles
Direction: E-W
Address range: 1600 to 1799
Direction: E-W
Address range: 1600 to 1799
Gila Bend
Length: 0.11 miles
Direction: N-S
Address range: 8200 to 8299
Direction: N-S
Address range: 8200 to 8299
Lone Feather Ln
Length: 0.10 miles
Direction: N-S
Address range: 8200 to 8399
Direction: N-S
Address range: 8200 to 8399
Pecan Orchard Ln
Length: 0.10 miles
Direction: E-W
Address range: 1600 to 1799
Direction: E-W
Address range: 1600 to 1799
Silver Hills Way
Length: 0.06 miles
Direction: N-S
Address range: 8200 to 8299
Direction: N-S
Address range: 8200 to 8299
Window Rock Ln
Length: 0.05 miles
Direction: N-S
Address range: 8200 to 8399
Direction: N-S
Address range: 8200 to 8399
Echo Valley Way
Length: 0.05 miles
Direction: N-S
Address range: 8100 to 8199
Direction: N-S
Address range: 8100 to 8199
Handle Bar Ln
Length: 0.05 miles
Direction: N-S
Address range: 8100 to 8199
Direction: N-S
Address range: 8100 to 8199
Grizzly Bear Way
Length: 0.05 miles
Direction: N-S
Address range: 8100 to 8199
Direction: N-S
Address range: 8100 to 8199