Hobson Park West neighborhood in Oxnard, California (CA), 93030 detailed profile
Settings
X


Business Search - 14 Million verified businesses
Area: 0.180 square miles
Population: 825
Population density:
| Hobson Park West: | 4,586 people per square mile |
| Oxnard: | 7,918 people per square mile |

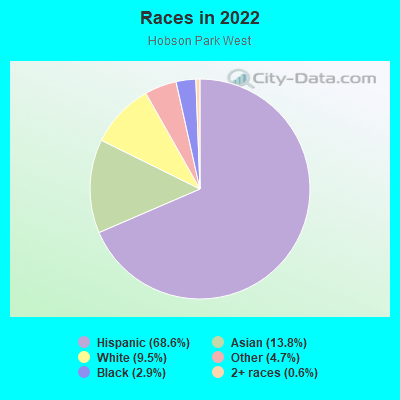
- 59368.6%Hispanic or Latino
- 11913.8%Asian
- 829.5%White
- 414.7%Some other race
- 252.9%Black
- 50.6%Two or more races
Median household income in 2022:
| Hobson Park West: | $89,792 |
| Oxnard: | $84,941 |
Distribution of median household income
![Distribution of median household income]()
- 5$20,000 to $29,999
- 11$30,000 to $39,999
- 23$40,000 to $49,999
- 20$50,000 to $59,999
- 44$60,000 to $74,999
- 27$75,000 to $99,999
- 29$100,000 to $124,999
- 23$125,000 to $149,999
- 29$150,000 to $199,999
- 25$200,000 or more

Distribution of owner-occupied house/condo value
![Distribution of owner-occupied house/condo value]()
- 13$50,000 to $99,999
- 5$250,000 to $299,999
- 12$300,000 to $399,999
- 4$400,000 to $499,999
- 96$500,000 to $749,999
- 14$750,000 to $999,999

Distribution of rent paid by renters
![Distribution of rent paid by renters]()
- 9$1,000 to $1,249
- 3$1,250 to $1,499
- 31$1,500 to $1,999
- 60$2,000 or more

Median rent in 2022:
| Hobson Park West: | $2,161 |
| Oxnard: | $1,876 |
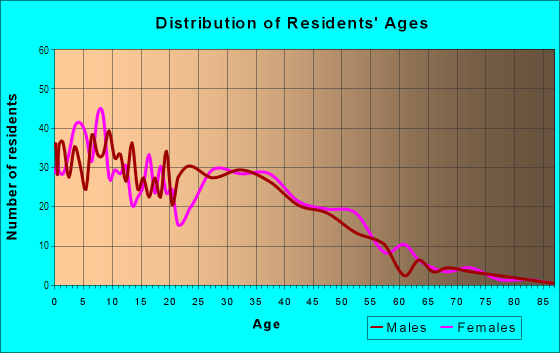
| Males: | 440 |
| Females: | 384 |
Males:
| This neighborhood: | 34.2 years |
| Whole city: | 35.1 years |
| This neighborhood: | 35.9 years |
| Whole city: | 34.3 years |
Average household size:
| Hobson Park West: | 3.8 people |
| Oxnard: | 3.6 people |
Percentage of family households:
| Hobson Park West: | 69.5% |
| Oxnard: | 51.5% |
| Here: | 75.4% |
| Oxnard: | 47.9% |
Percentage of married-couple families with children (among all households):
| Hobson Park West: | 22.3% |
| Oxnard: | 16.4% |
Percentage of single-mother households (among all households):
| Hobson Park West: | 4.1% |
| Oxnard: | 8.1% |
Percentage of never married males 15 years old and over:
Percentage of never married females 15 years old and over:
| Hobson Park West: | 21.3% |
| Oxnard: | 22.9% |
Percentage of never married females 15 years old and over:
| Hobson Park West: | 13.5% |
| city: | 20.1% |
Percentage of people that speak English not well or not at all:
| Hobson Park West: | 0.0% |
| Oxnard: | 20.2% |
Percentage of people born in this state:
Percentage of people born in another U.S. state:
Percentage of native residents but born outside the U.S.:
Percentage of foreign born residents:
| Here: | 60.5% |
| Oxnard: | 58.8% |
Percentage of people born in another U.S. state:
| Hobson Park West: | 8.8% |
| Oxnard: | 6.5% |
Percentage of native residents but born outside the U.S.:
| Here: | 1.3% |
| city: | 1.4% |
Percentage of foreign born residents:
| Here: | 29.3% |
| Oxnard: | 33.3% |
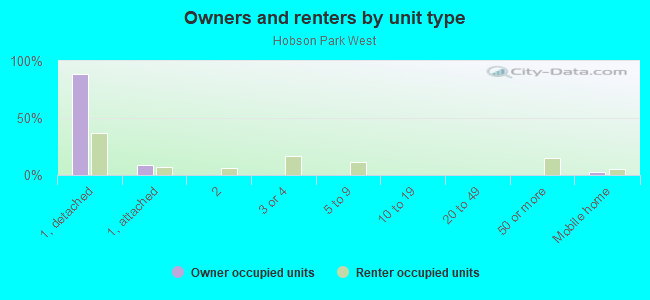
Owner-occupied
Renter-occupied

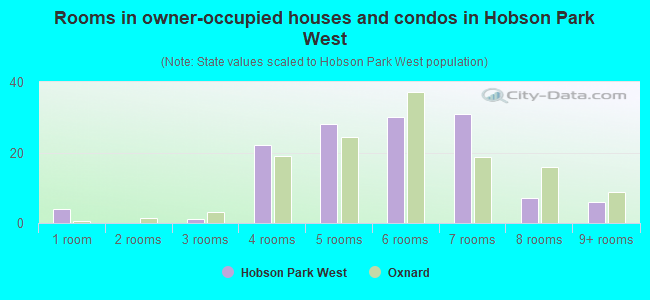
- Rooms in owner-occupied houses and condos in Hobson Park West
- 41 room
- 02 rooms
- 13 rooms
- 224 rooms
- 285 rooms
- 306 rooms
- 317 rooms
- 78 rooms
- 69+ rooms
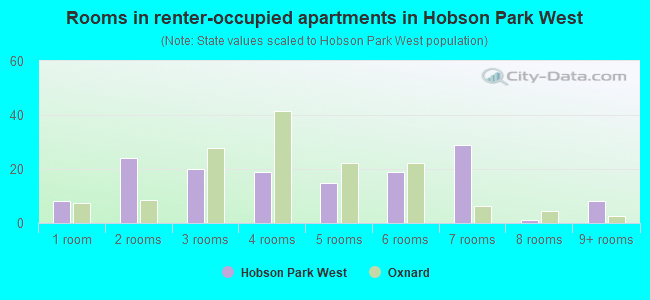
- Rooms in renter-occupied apartments in Hobson Park West
- 81 room
- 242 rooms
- 203 rooms
- 194 rooms
- 155 rooms
- 196 rooms
- 297 rooms
- 18 rooms
- 89+ rooms
Owner-occupied
Renter-occupied
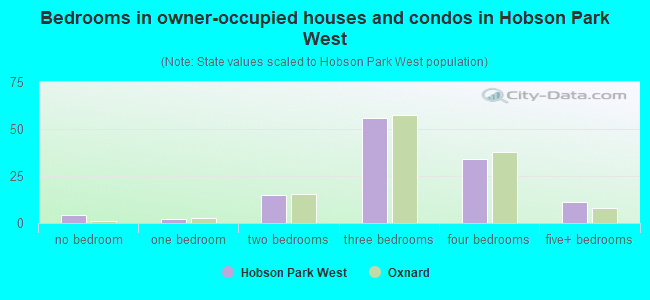
- Bedrooms in owner-occupied houses and condos in Hobson Park West
- 4no bedroom
- 21 bedroom
- 152 bedrooms
- 563 bedrooms
- 344 bedrooms
- 115+ bedrooms
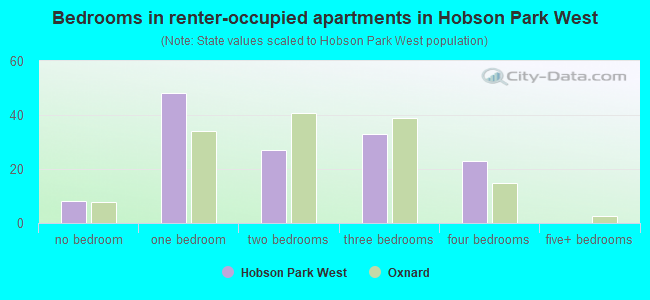
- Bedrooms in renter-occupied apartments in Hobson Park West
- 8no bedroom
- 481 bedroom
- 272 bedrooms
- 333 bedrooms
- 234 bedrooms
- 05+ bedrooms
Average number of cars or other vehicles available in houses/condos:
Average number of cars or other vehicles available in apartments:
| This neighborhood: | 3.0 |
| Oxnard: | 2.5 |
Average number of cars or other vehicles available in apartments:
| Here: | 1.6 |
| city: | 1.9 |
Percentage of units with a mortgage:
| Hobson Park West: | 82.9% |
| Oxnard: | 65.5% |
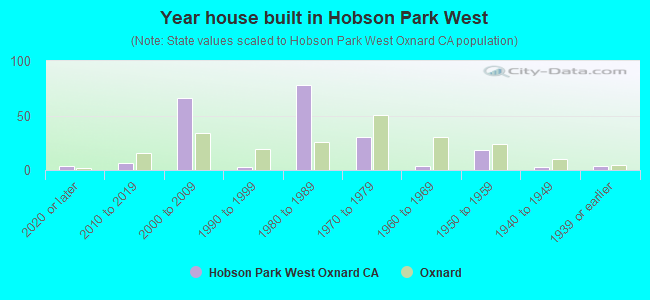
- Year house built in Hobson Park West
- 42020 or later
- 62010 to 2019
- 662000 to 2009
- 31990 to 1999
- 781980 to 1989
- 301970 to 1979
- 41960 to 1969
- 181950 to 1959
- 31940 to 1949
- 41939 or earlier
City-data.com crime index for city in 2020 (higher means more crime):
| City: | 220.0 |
| U.S. average: | 219.5 |
Travel time to work (commute)
![Travel time to work (commute)]()
- 3Less than 5 minutes
- 505 to 9 minutes
- 11410 to 14 minutes
- 6115 to 19 minutes
- 5720 to 24 minutes
- 24325 to 29 minutes
- 9030 to 34 minutes
- 435 to 39 minutes
- 2340 to 44 minutes
- 1145 to 59 minutes
- 860 to 89 minutes
- 1090 or more minutes

Means of transportation to work
![Means of transportation to work]()
- 90.4%372Drove a car alone
- 4.9%20Carpooled
- 1.2%5Bus
- 2.9%12Worked at home

Time leaving home to go to work
![Time leaving home to go to work]()
- 5212:00 a.m. to 4:59 a.m.
- 825:00 a.m. to 5:29 a.m.
- 215:30 a.m. to 5:59 a.m.
- 706:00 a.m. to 6:29 a.m.
- 986:30 a.m. to 6:59 a.m.
- 1047:00 a.m. to 7:29 a.m.
- 637:30 a.m. to 7:59 a.m.
- 478:00 a.m. to 8:29 a.m.
- 108:30 a.m. to 8:59 a.m.
- 379:00 a.m. to 9:59 a.m.
- 4310:00 a.m. to 10:59 a.m.
- 3112:00 p.m. to 3:59 p.m.
- 214:00 p.m. to 11:59 p.m.

Occupations of males:
- Percentage of males in management occupations (except farmers):
Here: 7.9% city: 6.2%
- Percentage of males in business and financial operations occupations:
Here: 7.2% city: 2.6%
- Percentage of males in computer and mathematical occupations:
Here: 3.1% city: 2.4%
- Percentage of males in architecture and engineering occupations:
Here: 3.4% city: 3.1%
- Percentage of males in education, training, and library occupations:
Here: 2.1% city: 1.7%
- Percentage of males in healthcare practitioners and technical occupations:
Here: 1.7% city: 1.3%
- Percentage of males in service occupations:
Here: 14.7% city: 16.9%
- Percentage of males in sales and office occupations:
Here: 7.2% city: 11.7%
- Percentage of males in farming, fishing, and forestry occupations:
Here: 7.5% city: 14.1%
- Percentage of males in construction, extraction, and maintenance occupations:
Here: 15.9% city: 9.8%
- Percentage of males in production occupations:
Here: 5.4% city: 9.6%
- Percentage of males in transportation occupations:
Here: 15.7% city: 6.5%
- Percentage of males in material moving occupations:
Here: 1.9% city: 6.3%
Occupations of females:
- Percentage of females in management occupations (except farmers):
Here: 9.3% city: 6.3%
- Percentage of females in business and financial operations occupations:
Here: 3.2% city: 5.3%
- Percentage of females in computer and mathematical occupations:
Here: 1.4% city: 0.9%
- Percentage of females in education, training, and library occupations:
Here: 14.4% city: 4.9%
- Percentage of females in arts, design, entertainment, sports, and media occupations:
Here: 3.1% city: 1.5%
- Percentage of females in healthcare practitioners and technical occupations:
Here: 10.4% city: 5.9%
- Percentage of females in service occupations:
Here: 20.3% city: 23.6%
- Percentage of females in sales and office occupations:
Here: 25.9% city: 27.3%
- Percentage of females in farming, fishing, and forestry occupations:
Here: 3.9% city: 8.0%
- Percentage of females in production occupations:
Here: 11.0% city: 6.8%
- Percentage of females in transportation occupations:
Here: 1.2% city: 0.9%
- Percentage of females in material moving occupations:
Here: 1.7% city: 3.7%
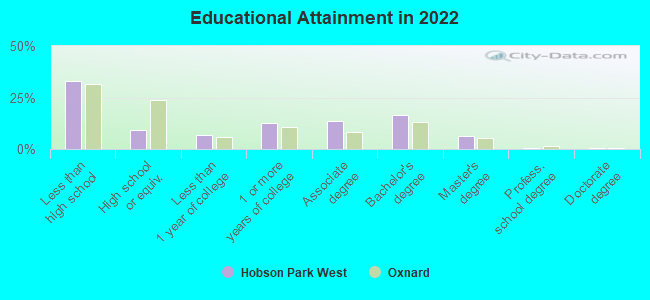
Education in this neighborhood (subdivision or community):
- Percentage of people 3 years and older in K-12 schools:
Hobson Park West: 19.8% Oxnard: 21.0%
- Percentage of people 3 years and older in undergraduate colleges:
Hobson Park West: 7.1% Oxnard: 5.2%
- Percentage of people 3 years and older in grad. or professional schools:
Hobson Park West: 3.2% Oxnard: 0.8%
- Percentage of students K-12 enrolled in private schools:
Hobson Park West: 0.6% Oxnard: 4.0%
Percentage of population below poverty level:
| Hobson Park West: | 1.9% |
| Oxnard: | 12.8% |
Median year owner moved in (as recorded in 2022):
Median year renter moved in (as recorded in 2022):
| Hobson Park West: | 2008 |
| Oxnard: | 2006 |
Median year renter moved in (as recorded in 2022):
| Hobson Park West: | 2013 |
| Oxnard: | 2019 |
Percentage of married-couple families with both working:
| Hobson Park West: | 65.0% |
| Oxnard: | 71.8% |
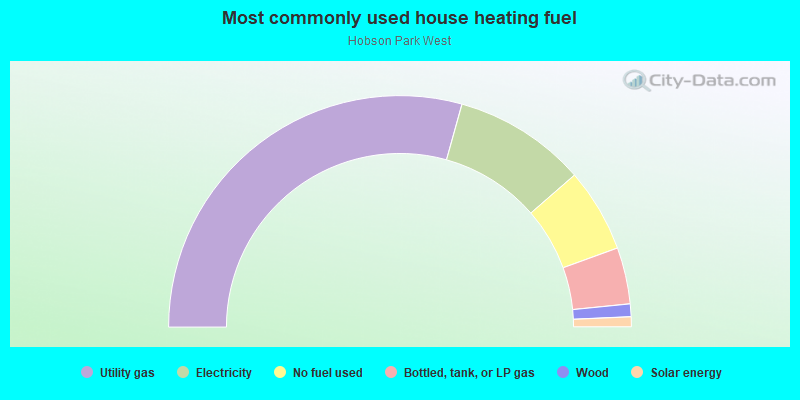
- 58.7%Utility gas
- 18.6%Electricity
- 11.7%No fuel used
- 7.9%Bottled, tank, or LP gas
- 1.8%Wood
- 1.4%Solar energy
Roads and streets:
W 7th St
Length: 0.33 miles
Direction: E-W
Address range: 900 to 1421
Direction: E-W
Address range: 900 to 1421
Hull Pl
Length: 0.30 miles
Direction: E-W
Address range: 1000 to 1499
Direction: E-W
Address range: 1000 to 1499
Isleton Pl
Length: 0.30 miles
Directions: E-W, SE-NW
Address range: 1000 to 1499
Directions: E-W, SE-NW
Address range: 1000 to 1499
9th St
Length: 0.29 miles
Direction: E-W
Direction: E-W
Seaport Dr
Length: 0.27 miles
Directions: E-W, SE-NW
Address range: 1100 to 1499
Directions: E-W, SE-NW
Address range: 1100 to 1499
S K St
Length: 0.24 miles
Direction: N-S
Address range: 550 to 1099
Direction: N-S
Address range: 550 to 1099
Jamaica Ln
Length: 0.21 miles
Direction: E-W
Address range: 1100 to 1399
Direction: E-W
Address range: 1100 to 1399
Oyster Pl
Length: 0.21 miles
Direction: E-W
Address range: 1130 to 1399
Direction: E-W
Address range: 1130 to 1399
Lighthouse Ln
Length: 0.20 miles
Directions: N-S, SW-NE
Directions: N-S, SW-NE
Hobson Way
Length: 0.19 miles
Directions: N-S, SW-NE
Address range: 700 to 899
Directions: N-S, SW-NE
Address range: 700 to 899
S I St
Length: 0.16 miles
Direction: N-S
Address range: 500 to 699
Direction: N-S
Address range: 500 to 699
S J St
Length: 0.16 miles
Direction: N-S
Address range: 900 to 1099
Direction: N-S
Address range: 900 to 1099
Moby Dick Ln
Length: 0.15 miles
Direction: N-S
Address range: 700 to 798
Direction: N-S
Address range: 700 to 798
Lost Point Ln
Length: 0.14 miles
Directions: E-W, SE-NW
Address range: 1200 to 1399
Directions: E-W, SE-NW
Address range: 1200 to 1399
Kingfisher Way
Length: 0.13 miles
Directions: E-W, N-S, SE-NW, SW-NE
Address range: 700 to 898
Directions: E-W, N-S, SE-NW, SW-NE
Address range: 700 to 898
Inlet Dr
Length: 0.13 miles
Direction: N-S
Address range: 900 to 1098
Direction: N-S
Address range: 900 to 1098
Jurymast Dr
Length: 0.13 miles
Direction: N-S
Address range: 900 to 1099
Direction: N-S
Address range: 900 to 1099
S L St
Length: 0.13 miles
Direction: N-S
Address range: 900 to 1099
Direction: N-S
Address range: 900 to 1099
Nautical Way
Length: 0.12 miles
Direction: E-W
Address range: 1200 to 1399
Direction: E-W
Address range: 1200 to 1399
S M St
Length: 0.11 miles
Direction: N-S
Address range: 500 to 699
Direction: N-S
Address range: 500 to 699
Norseman Ct
Length: 0.10 miles
Directions: N-S, SE-NW, SW-NE
Address range: 500 to 699
Directions: N-S, SE-NW, SW-NE
Address range: 500 to 699
M Ct
Length: 0.10 miles
Directions: N-S, SE-NW
Address range: 900 to 1099
Directions: N-S, SE-NW
Address range: 900 to 1099
Rigging Pl
Length: 0.09 miles
Direction: E-W
Address range: 1100 to 1199
Direction: E-W
Address range: 1100 to 1199
Mooring Walk
Length: 0.09 miles
Direction: E-W
Address range: 1100 to 1199
Direction: E-W
Address range: 1100 to 1199
Porthole Ct
Length: 0.07 miles
Direction: E-W
Address range: 1100 to 1199
Direction: E-W
Address range: 1100 to 1199
L Ct
Length: 0.05 miles
Direction: N-S
Address range: 500 to 599
Direction: N-S
Address range: 500 to 599
J Ct
Length: 0.05 miles
Direction: N-S
Address range: 500 to 599
Direction: N-S
Address range: 500 to 599
M St
Length: 0.05 miles
Directions: N-S, SW-NE
Directions: N-S, SW-NE
Key West Ct
Length: 0.05 miles
Directions: E-W, SE-NW
Address range: 1100 to 1199
Directions: E-W, SE-NW
Address range: 1100 to 1199