Hilltop Green neighborhood in El Sobrante, California (CA), 94803 detailed profile
Settings
X

Business Search - 14 Million verified businesses
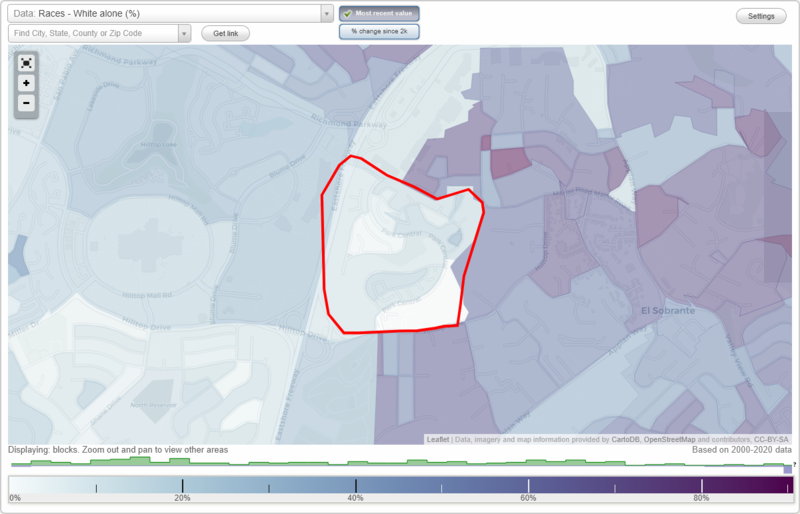
Area: 0.243 square miles
Population: 759
Population density:
| Hilltop Green: | 3,117 people per square mile |
| El Sobrante: | 4,997 people per square mile |

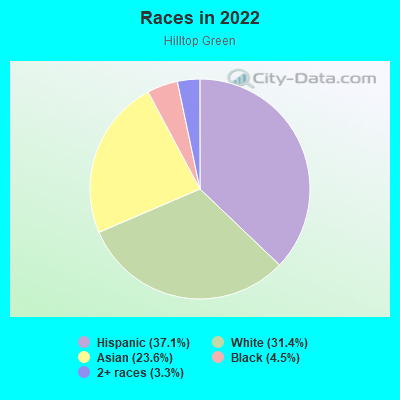
- 28137.1%Hispanic or Latino
- 23831.4%White
- 17923.6%Asian
- 344.5%Black
- 253.3%Two or more races
Median household income in 2022:
| Hilltop Green: | $97,074 |
| El Sobrante: | $107,725 |
Distribution of median household income
![Distribution of median household income]()
- 4Less than $10,000
- 13$10,000 to $19,999
- 15$20,000 to $29,999
- 14$30,000 to $39,999
- 10$40,000 to $49,999
- 4$50,000 to $59,999
- 24$60,000 to $74,999
- 45$75,000 to $99,999
- 34$100,000 to $124,999
- 6$125,000 to $149,999
- 52$150,000 to $199,999
- 29$200,000 or more

Distribution of owner-occupied house/condo value
![Distribution of owner-occupied house/condo value]()
- 8Less than $50,000
- 2$50,000 to $99,999
- 22$300,000 to $399,999
- 4$400,000 to $499,999
- 81$500,000 to $749,999
- 43$750,000 to $999,999
- 2$1,000,000 or more

Distribution of rent paid by renters
![Distribution of rent paid by renters]()
- 9$900 to $999
- 2$1,000 to $1,249
- 27$1,250 to $1,499
- 11$1,500 to $1,999
- 78$2,000 or more

Median rent in 2022:
| Hilltop Green: | $2,554 |
| El Sobrante: | $1,830 |
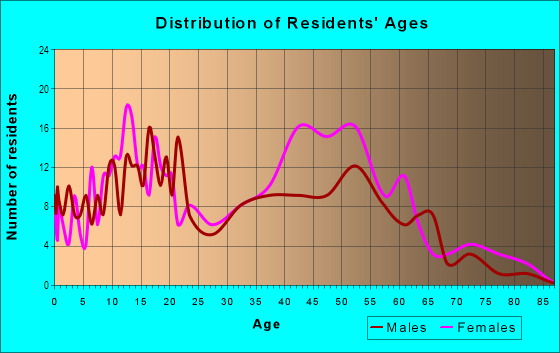
| Males: | 437 |
| Females: | 322 |
Males:
| This neighborhood: | 44.1 years |
| Whole city: | 38.8 years |
| This neighborhood: | 52.5 years |
| Whole city: | 44.3 years |
Average household size:
| Hilltop Green: | 3.1 people |
| El Sobrante: | 2.8 people |
Percentage of family households:
| Hilltop Green: | 42.9% |
| El Sobrante: | 47.5% |
| Here: | 59.6% |
| El Sobrante: | 50.2% |
Percentage of married-couple families with children (among all households):
| Hilltop Green: | 23.3% |
| El Sobrante: | 23.4% |
Percentage of single-mother households (among all households):
| Hilltop Green: | 12.5% |
| El Sobrante: | 8.1% |
Percentage of never married males 15 years old and over:
Percentage of never married females 15 years old and over:
| Hilltop Green: | 33.5% |
| El Sobrante: | 20.2% |
Percentage of never married females 15 years old and over:
| Hilltop Green: | 9.2% |
| place: | 15.4% |
Percentage of people that speak English not well or not at all:
| Hilltop Green: | 6.9% |
| El Sobrante: | 7.9% |
Percentage of people born in this state:
Percentage of people born in another U.S. state:
Percentage of native residents but born outside the U.S.:
Percentage of foreign born residents:
| Here: | 51.9% |
| El Sobrante: | 53.4% |
Percentage of people born in another U.S. state:
| Hilltop Green: | 20.2% |
| El Sobrante: | 17.4% |
Percentage of native residents but born outside the U.S.:
| Here: | 1.4% |
| place: | 1.4% |
Percentage of foreign born residents:
| Here: | 26.5% |
| El Sobrante: | 27.8% |
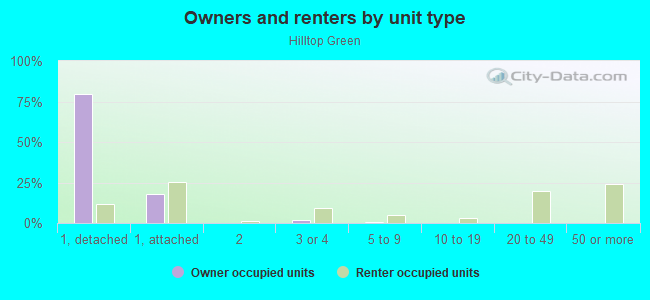
Owner-occupied
Renter-occupied

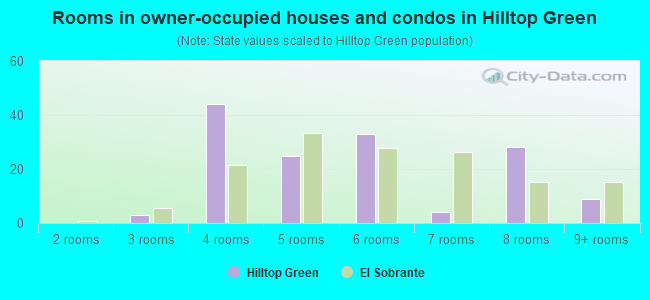
- Rooms in owner-occupied houses and condos in Hilltop Green
- 01 room
- 02 rooms
- 33 rooms
- 444 rooms
- 255 rooms
- 336 rooms
- 47 rooms
- 288 rooms
- 99+ rooms
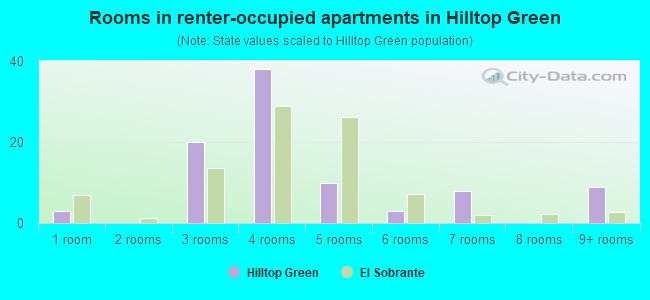
- Rooms in renter-occupied apartments in Hilltop Green
- 31 room
- 02 rooms
- 203 rooms
- 384 rooms
- 105 rooms
- 36 rooms
- 87 rooms
- 08 rooms
- 99+ rooms
Owner-occupied
Renter-occupied
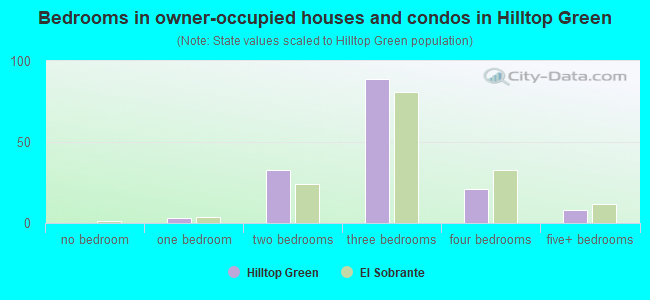
- Bedrooms in owner-occupied houses and condos in Hilltop Green
- 0no bedroom
- 31 bedroom
- 332 bedrooms
- 893 bedrooms
- 214 bedrooms
- 85+ bedrooms
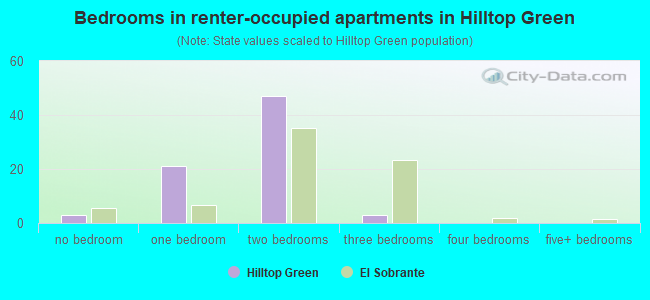
- Bedrooms in renter-occupied apartments in Hilltop Green
- 3no bedroom
- 211 bedroom
- 472 bedrooms
- 33 bedrooms
- 04 bedrooms
- 05+ bedrooms
Average number of cars or other vehicles available in houses/condos:
Average number of cars or other vehicles available in apartments:
| This neighborhood: | 3.2 |
| El Sobrante: | 2.5 |
Average number of cars or other vehicles available in apartments:
| Here: | 1.4 |
| place: | 2.0 |
Percentage of units with a mortgage:
| Hilltop Green: | 46.3% |
| El Sobrante: | 67.5% |
Housing prices:
- Average estimated value of detached houses in 2022 (66.7% of all units):
Hilltop Green: $612,695 California: $988,808
- Average estimated value of townhouses or other attached units in 2022 (24.8% of all units):
This neighborhood: $419,428 California: $838,546
- Average estimated '22 value of housing units in 3-to-4-unit structures (5.6% of all units):
Hilltop Green: $335,098 California: $824,253
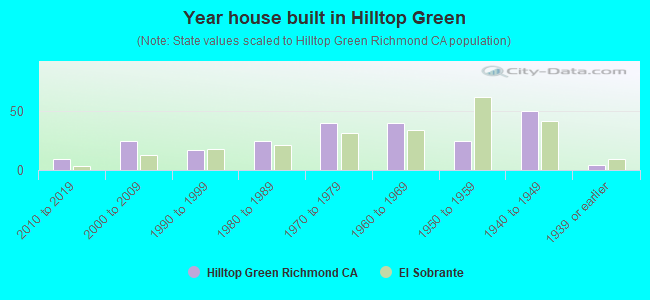
- Year house built in Hilltop Green
- 02020 or later
- 92010 to 2019
- 252000 to 2009
- 171990 to 1999
- 251980 to 1989
- 401970 to 1979
- 401960 to 1969
- 251950 to 1959
- 501940 to 1949
- 41939 or earlier
Travel time to work (commute)
![Travel time to work (commute)]()
- 5Less than 5 minutes
- 75 to 9 minutes
- 610 to 14 minutes
- 3315 to 19 minutes
- 5520 to 24 minutes
- 925 to 29 minutes
- 5630 to 34 minutes
- 435 to 39 minutes
- 2140 to 44 minutes
- 1745 to 59 minutes
- 5960 to 89 minutes
- 1890 or more minutes

Means of transportation to work
![Means of transportation to work]()
- 76.2%309Drove a car alone
- 7.4%30Carpooled
- 8.9%36Bus
- 2.0%8Subway or elevated rail
- 7.4%30Long-distance train or commuter rail
- 1.5%6Motorcycle
- 2.5%10Walked
- 4.7%19Other means
- 1.5%6Worked at home

Time leaving home to go to work
![Time leaving home to go to work]()
- 2112:00 a.m. to 4:59 a.m.
- 195:00 a.m. to 5:29 a.m.
- 65:30 a.m. to 5:59 a.m.
- 266:00 a.m. to 6:29 a.m.
- 266:30 a.m. to 6:59 a.m.
- 267:00 a.m. to 7:29 a.m.
- 397:30 a.m. to 7:59 a.m.
- 238:00 a.m. to 8:29 a.m.
- 178:30 a.m. to 8:59 a.m.
- 149:00 a.m. to 9:59 a.m.
- 1910:00 a.m. to 10:59 a.m.
- 1211:00 a.m. to 11:59 a.m.
- 2112:00 p.m. to 3:59 p.m.
- 174:00 p.m. to 11:59 p.m.

Occupations of males:
- Percentage of males in management occupations (except farmers):
Here: 10.2% place: 10.3%
- Percentage of males in computer and mathematical occupations:
Here: 14.4% place: 3.3%
- Percentage of males in architecture and engineering occupations:
Here: 1.5% place: 3.0%
- Percentage of males in life, physical, and social science occupations:
Here: 3.2% place: 1.4%
- Percentage of males in education, training, and library occupations:
Here: 1.1% place: 3.1%
- Percentage of males in service occupations:
Here: 22.2% place: 12.3%
- Percentage of males in sales and office occupations:
Here: 17.6% place: 20.4%
- Percentage of males in production occupations:
Here: 2.9% place: 7.4%
- Percentage of males in transportation occupations:
Here: 8.6% place: 8.1%
- Percentage of males in material moving occupations:
Here: 16.6% place: 7.8%
Occupations of females:
- Percentage of females in management occupations (except farmers):
Here: 15.7% place: 10.0%
- Percentage of females in business and financial operations occupations:
Here: 12.8% place: 6.7%
- Percentage of females in computer and mathematical occupations:
Here: 8.7% place: 4.3%
- Percentage of females in architecture and engineering occupations:
Here: 1.7% place: 2.0%
- Percentage of females in life, physical, and social science occupations:
Here: 4.3% place: 2.2%
- Percentage of females in community and social services occupations:
Here: 3.5% place: 3.9%
- Percentage of females in education, training, and library occupations:
Here: 4.0% place: 8.0%
- Percentage of females in healthcare practitioners and technical occupations:
Here: 2.2% place: 4.5%
- Percentage of females in service occupations:
Here: 30.2% place: 24.9%
- Percentage of females in sales and office occupations:
Here: 8.7% place: 23.1%
- Percentage of females in transportation occupations:
Here: 10.0% place: 2.0%
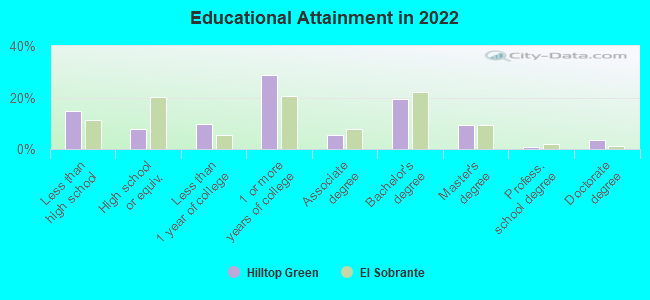
Education in this neighborhood (subdivision or community):
- Percentage of people 3 years and older in K-12 schools:
Hilltop Green: 21.0% El Sobrante: 14.6%
- Percentage of people 3 years and older in undergraduate colleges:
Hilltop Green: 7.1% El Sobrante: 6.1%
- Percentage of people 3 years and older in grad. or professional schools:
Hilltop Green: 0.5% El Sobrante: 1.2%
- Percentage of students K-12 enrolled in private schools:
Hilltop Green: 17.2% El Sobrante: 19.6%
Percentage of population below poverty level:
| Hilltop Green: | 6.8% |
| El Sobrante: | 9.6% |
Median year owner moved in (as recorded in 2022):
Median year renter moved in (as recorded in 2022):
| Hilltop Green: | 1999 |
| El Sobrante: | 2004 |
Median year renter moved in (as recorded in 2022):
| Hilltop Green: | 2014 |
| El Sobrante: | 2015 |
Percentage of married-couple families with both working:
| Hilltop Green: | 92.4% |
| El Sobrante: | 69.7% |
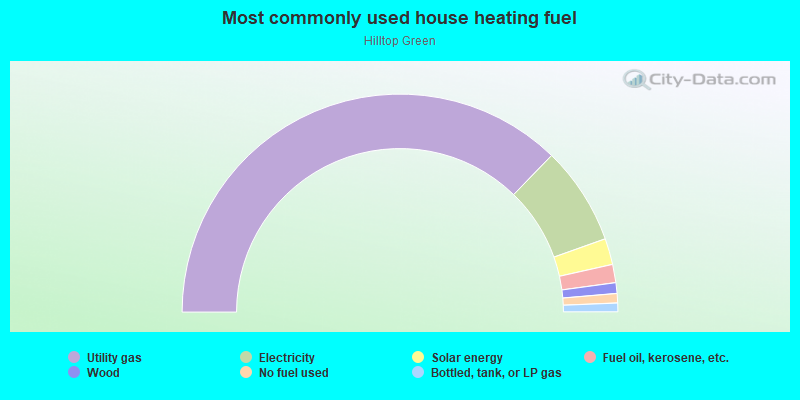
- 74.5%Utility gas
- 14.6%Electricity
- 3.9%Solar energy
- 2.7%Fuel oil, kerosene, etc.
- 1.6%Wood
- 1.4%No fuel used
- 1.3%Bottled, tank, or LP gas
Roads and streets:
Park Central
Length: 0.77 miles
Directions: E-W, N-S, SE-NW, SW-NE
Address range: 800 to 1099
Directions: E-W, N-S, SE-NW, SW-NE
Address range: 800 to 1099
Parkridge Dr
Length: 0.62 miles
Directions: E-W, N-S, SE-NW, SW-NE
Address range: 1 to 1120
Directions: E-W, N-S, SE-NW, SW-NE
Address range: 1 to 1120
Parkside Dr
Length: 0.51 miles
Directions: E-W, N-S, SE-NW, SW-NE
Address range: 801 to 1099
Directions: E-W, N-S, SE-NW, SW-NE
Address range: 801 to 1099
Parkway Dr
Length: 0.30 miles
Directions: E-W, N-S, SW-NE
Address range: 1200 to 1299
Directions: E-W, N-S, SW-NE
Address range: 1200 to 1299
Greenway Dr
Length: 0.28 miles
Directions: E-W, N-S, SE-NW
Address range: 1200 to 1399
Directions: E-W, N-S, SE-NW
Address range: 1200 to 1399
View Dr
Length: 0.28 miles
Directions: E-W, N-S, SW-NE
Address range: 900 to 1099
Directions: E-W, N-S, SW-NE
Address range: 900 to 1099
Fairway Dr
Length: 0.27 miles
Directions: E-W, N-S, SW-NE
Address range: 1100 to 1299
Directions: E-W, N-S, SW-NE
Address range: 1100 to 1299
Overlook Ln
Length: 0.18 miles
Directions: E-W, N-S, SE-NW, SW-NE
Address range: 1 to 99
Directions: E-W, N-S, SE-NW, SW-NE
Address range: 1 to 99
Club Ln
Length: 0.15 miles
Directions: E-W, SE-NW, SW-NE
Address range: 1300 to 1399
Directions: E-W, SE-NW, SW-NE
Address range: 1300 to 1399
Club Dr
Length: 0.15 miles
Directions: E-W, SE-NW
Address range: 1225 to 1299
Directions: E-W, SE-NW
Address range: 1225 to 1299
Parkridge Pl
Length: 0.12 miles
Directions: E-W, N-S, SE-NW, SW-NE
Address range: 1 to 99
Directions: E-W, N-S, SE-NW, SW-NE
Address range: 1 to 99
Club Ct
Length: 0.11 miles
Directions: E-W, N-S, SE-NW, SW-NE
Address range: 1200 to 1299
Directions: E-W, N-S, SE-NW, SW-NE
Address range: 1200 to 1299
Park Central St (Park Central Ct)
Length: 0.08 miles
Directions: E-W, SE-NW
Address range: 800 to 1399
Directions: E-W, SE-NW
Address range: 800 to 1399
Greenview Ln
Length: 0.05 miles
Directions: N-S, SE-NW
Address range: 1 to 99
Directions: N-S, SE-NW
Address range: 1 to 99
Parkridge Ct
Length: 0.05 miles
Directions: N-S, SW-NE
Address range: 1 to 99
Directions: N-S, SW-NE
Address range: 1 to 99
Fairway Ln
Length: 0.05 miles
Direction: E-W
Direction: E-W
Greenway Ln
Length: 0.04 miles
Direction: E-W
Direction: E-W
Parkridge Ln
Length: 0.04 miles
Direction: E-W
Address range: 1 to 99
Direction: E-W
Address range: 1 to 99
Parkway Ct
Length: 0.04 miles
Directions: N-S, SW-NE
Address range: 1200 to 1299
Directions: N-S, SW-NE
Address range: 1200 to 1299
Parkview Ln
Length: 0.03 miles
Direction: SE-NW
Direction: SE-NW
Hilltop Dr
Length: 0.02 miles
Direction: E-W
Address range: 4100 to 4199
Direction: E-W
Address range: 4100 to 4199
Park Ct
Length: 0.02 miles
Direction: SW-NE
Address range: 1 to 99
Direction: SW-NE
Address range: 1 to 99