Hillside Heights neighborhood in Las Vegas, Nevada (NV), 89104 detailed profile
Settings
X

Business Search - 14 Million verified businesses
Area: 0.094 square miles
Population: 543
Population density:
| Hillside Heights: | 5,775 people per square mile |
| Las Vegas: | 5,792 people per square mile |

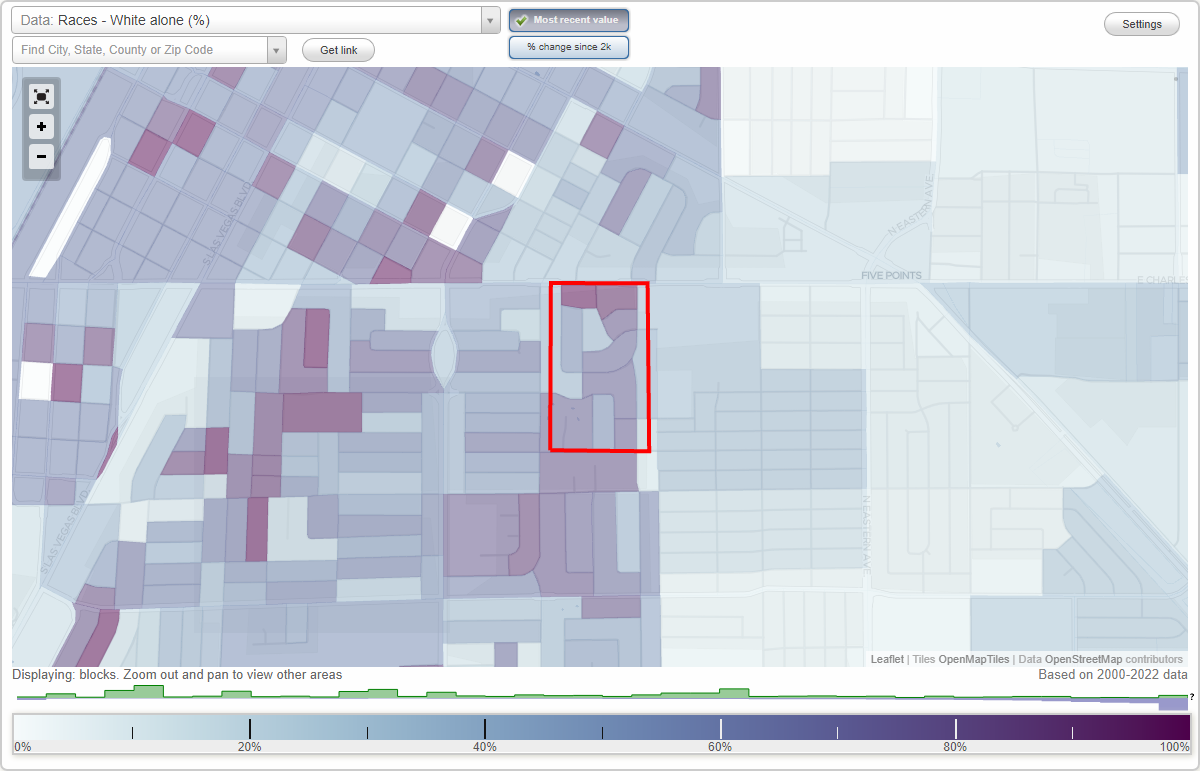
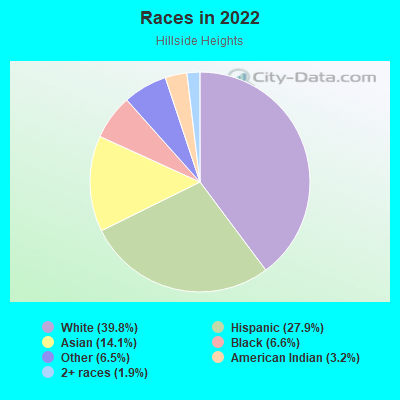
- 27139.8%White
- 19027.9%Hispanic or Latino
- 9614.1%Asian
- 456.6%Black
- 446.5%Some other race
- 223.2%American Indian
- 131.9%Two or more races
Distribution of median household income
![Distribution of median household income]()
- 76Less than $10,000
- 101$10,000 to $19,999
- 41$20,000 to $29,999
- 30$30,000 to $39,999
- 15$40,000 to $49,999
- 22$50,000 to $59,999
- 17$60,000 to $74,999
- 28$75,000 to $99,999
- 34$100,000 to $124,999
- 21$125,000 to $149,999
- 16$150,000 to $199,999
- 23$200,000 or more

Distribution of owner-occupied house/condo value
![Distribution of owner-occupied house/condo value]()
- 11Less than $50,000
- 11$50,000 to $99,999
- 11$100,000 to $149,999
- 13$150,000 to $199,999
- 18$200,000 to $249,999
- 28$250,000 to $299,999
- 10$300,000 to $399,999
- 23$400,000 to $499,999
- 11$500,000 to $749,999

Distribution of rent paid by renters
![Distribution of rent paid by renters]()
- 3$100 to $199
- 14$500 to $599
- 13$600 to $699
- 25$700 to $799
- 74$800 to $899
- 14$900 to $999
- 61$1,000 to $1,249
- 128$1,250 to $1,499
- 37$1,500 to $1,999
- 2$2,000 or more

Median rent in 2022:
| Hillside Heights: | $860 |
| Las Vegas: | $1,277 |
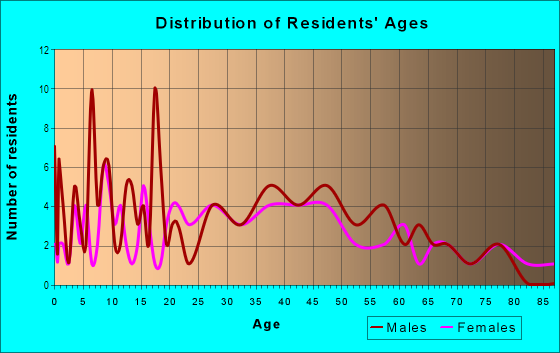
| Males: | 237 |
| Females: | 306 |
Males:
| This neighborhood: | 37.5 years |
| Whole city: | 38.4 years |
| This neighborhood: | 39.0 years |
| Whole city: | 38.9 years |
Average household size:
| Hillside Heights: | 8.6 people |
| Las Vegas: | 2.7 people |
Percentage of family households:
| Hillside Heights: | 31.5% |
| Las Vegas: | 45.8% |
| Here: | 21.0% |
| Las Vegas: | 40.9% |
Percentage of married-couple families with children (among all households):
| Hillside Heights: | 29.8% |
| Las Vegas: | 23.4% |
Percentage of single-mother households (among all households):
| Hillside Heights: | 19.1% |
| Las Vegas: | 10.1% |
Percentage of never married males 15 years old and over:
Percentage of never married females 15 years old and over:
| Hillside Heights: | 10.9% |
| Las Vegas: | 19.7% |
Percentage of never married females 15 years old and over:
| Hillside Heights: | 28.5% |
| city: | 17.0% |
Percentage of people that speak English not well or not at all:
| Hillside Heights: | 5.7% |
| Las Vegas: | 7.0% |
Percentage of people born in this state:
Percentage of people born in another U.S. state:
Percentage of native residents but born outside the U.S.:
Percentage of foreign born residents:
| Here: | 27.5% |
| Las Vegas: | 27.3% |
Percentage of people born in another U.S. state:
| Hillside Heights: | 38.4% |
| Las Vegas: | 49.8% |
Percentage of native residents but born outside the U.S.:
| Here: | 2.1% |
| city: | 1.9% |
Percentage of foreign born residents:
| Here: | 32.0% |
| Las Vegas: | 21.0% |
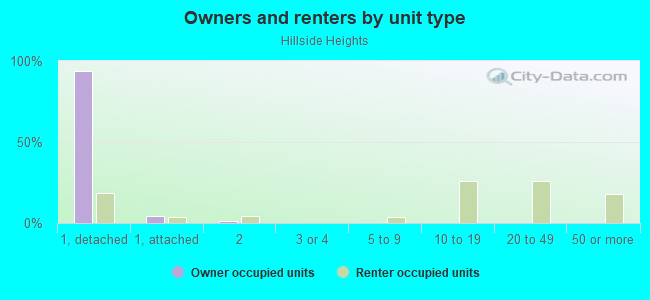
Owner-occupied
Renter-occupied

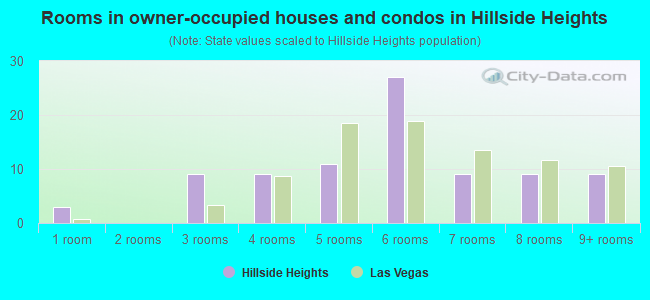
- Rooms in owner-occupied houses and condos in Hillside Heights
- 31 room
- 02 rooms
- 93 rooms
- 94 rooms
- 115 rooms
- 276 rooms
- 97 rooms
- 98 rooms
- 99+ rooms
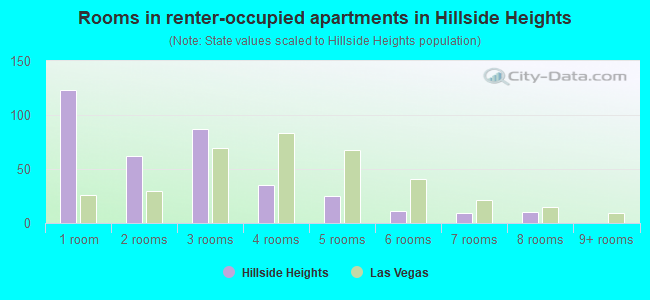
- Rooms in renter-occupied apartments in Hillside Heights
- 1231 room
- 622 rooms
- 873 rooms
- 354 rooms
- 255 rooms
- 116 rooms
- 97 rooms
- 108 rooms
- 09+ rooms
Owner-occupied
Renter-occupied
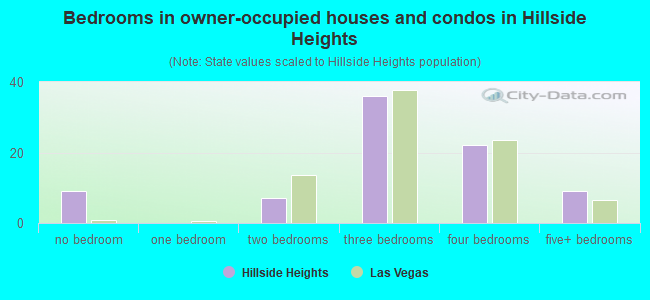
- Bedrooms in owner-occupied houses and condos in Hillside Heights
- 9no bedroom
- 01 bedroom
- 72 bedrooms
- 363 bedrooms
- 224 bedrooms
- 95+ bedrooms
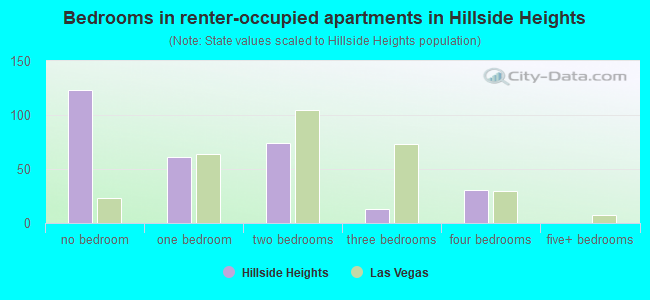
- Bedrooms in renter-occupied apartments in Hillside Heights
- 123no bedroom
- 611 bedroom
- 742 bedrooms
- 133 bedrooms
- 314 bedrooms
- 05+ bedrooms
Average number of cars or other vehicles available in houses/condos:
Average number of cars or other vehicles available in apartments:
| This neighborhood: | 2.1 |
| Las Vegas: | 2.0 |
Average number of cars or other vehicles available in apartments:
| Here: | 1.1 |
| city: | 1.3 |
Percentage of units with a mortgage:
| Hillside Heights: | 58.6% |
| Las Vegas: | 69.3% |
Average estimated value of detached houses in 2022 (73.6% of all units):
| Hillside Heights: | $288,746 |
| Nevada: | $549,327 |
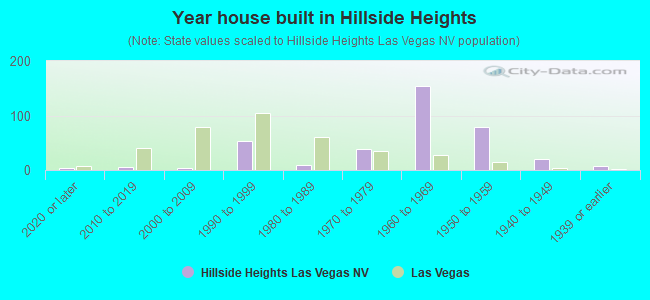
- Year house built in Hillside Heights
- 32020 or later
- 52010 to 2019
- 32000 to 2009
- 531990 to 1999
- 91980 to 1989
- 391970 to 1979
- 1551960 to 1969
- 791950 to 1959
- 201940 to 1949
- 81939 or earlier
City-data.com crime index for city in 2020 (higher means more crime):
| City: | 280.7 |
| U.S. average: | 219.5 |
Travel time to work (commute)
![Travel time to work (commute)]()
- 1Less than 5 minutes
- 225 to 9 minutes
- 5010 to 14 minutes
- 5115 to 19 minutes
- 3920 to 24 minutes
- 325 to 29 minutes
- 3330 to 34 minutes
- 235 to 39 minutes
- 440 to 44 minutes
- 1145 to 59 minutes
- 560 to 89 minutes
- 290 or more minutes

Means of transportation to work
![Means of transportation to work]()
- 50.2%133Drove a car alone
- 5.7%15Carpooled
- 4.2%11Bus
- 0.4%1Subway or elevated rail
- 11.3%30Bicycle
- 12.5%33Walked
- 11.7%31Other means
- 27.9%74Worked at home

Time leaving home to go to work
![Time leaving home to go to work]()
- 1512:00 a.m. to 4:59 a.m.
- 345:00 a.m. to 5:29 a.m.
- 105:30 a.m. to 5:59 a.m.
- 86:00 a.m. to 6:29 a.m.
- 166:30 a.m. to 6:59 a.m.
- 177:00 a.m. to 7:29 a.m.
- 257:30 a.m. to 7:59 a.m.
- 128:00 a.m. to 8:29 a.m.
- 178:30 a.m. to 8:59 a.m.
- 89:00 a.m. to 9:59 a.m.
- 710:00 a.m. to 10:59 a.m.
- 211:00 a.m. to 11:59 a.m.
- 4912:00 p.m. to 3:59 p.m.
- 224:00 p.m. to 11:59 p.m.

Occupations of males:
- Percentage of males in management occupations (except farmers):
Here: 23.3% city: 9.6%
- Percentage of males in business and financial operations occupations:
Here: 1.6% city: 3.6%
- Percentage of males in computer and mathematical occupations:
Here: 13.3% city: 3.4%
- Percentage of males in architecture and engineering occupations:
Here: 8.3% city: 1.8%
- Percentage of males in legal occupations:
Here: 5.4% city: 0.9%
- Percentage of males in arts, design, entertainment, sports, and media occupations:
Here: 13.3% city: 2.5%
- Percentage of males in service occupations:
Here: 31.7% city: 23.3%
- Percentage of males in sales and office occupations:
Here: 10.0% city: 16.6%
Occupations of females:
- Percentage of females in management occupations (except farmers):
Here: 6.0% city: 8.5%
- Percentage of females in business and financial operations occupations:
Here: 8.2% city: 5.7%
- Percentage of females in community and social services occupations:
Here: 3.3% city: 1.9%
- Percentage of females in legal occupations:
Here: 12.2% city: 1.5%
- Percentage of females in education, training, and library occupations:
Here: 20.6% city: 8.0%
- Percentage of females in arts, design, entertainment, sports, and media occupations:
Here: 6.0% city: 1.8%
- Percentage of females in healthcare practitioners and technical occupations:
Here: 3.4% city: 7.4%
- Percentage of females in service occupations:
Here: 19.6% city: 26.5%
- Percentage of females in sales and office occupations:
Here: 32.6% city: 30.5%
- Percentage of females in transportation occupations:
Here: 2.1% city: 1.6%
- Percentage of females in material moving occupations:
Here: 7.1% city: 2.2%
Percentage of people 16-64 in Armed Forces:
| Hillside Heights: | 0.5% |
| Las Vegas: | 1.0% |
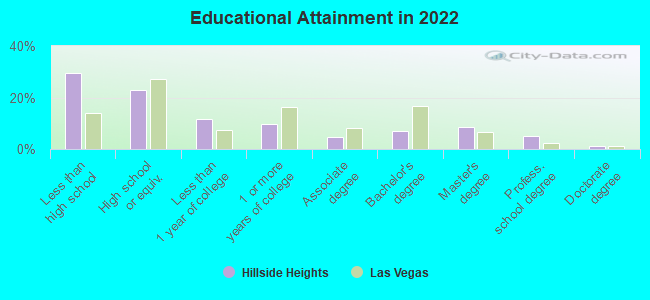
Education in this neighborhood (subdivision or community):
- Percentage of people 3 years and older in K-12 schools:
Hillside Heights: 16.8% Las Vegas: 17.4%
- Percentage of people 3 years and older in undergraduate colleges:
Hillside Heights: 18.6% Las Vegas: 4.2%
- Percentage of people 3 years and older in grad. or professional schools:
Hillside Heights: 1.1% Las Vegas: 1.0%
- Percentage of students K-12 enrolled in private schools:
Hillside Heights: 13.2% Las Vegas: 12.9%
Percentage of population below poverty level:
| Hillside Heights: | 19.2% |
| Las Vegas: | 14.1% |
Median year owner moved in (as recorded in 2022):
Median year renter moved in (as recorded in 2022):
| Hillside Heights: | 2011 |
| Las Vegas: | 2015 |
Median year renter moved in (as recorded in 2022):
| Hillside Heights: | 2018 |
| Las Vegas: | 2020 |
Percentage of married-couple families with both working:
| Hillside Heights: | 150.0% |
| Las Vegas: | 62.0% |
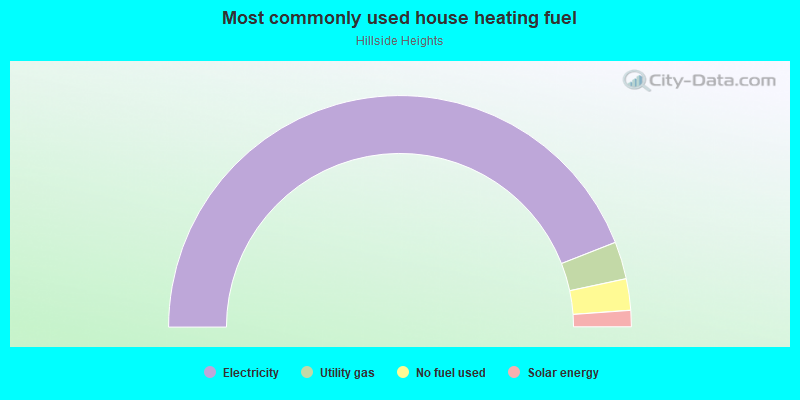
- 88.1%Electricity
- 5.2%Utility gas
- 4.4%No fuel used
- 2.3%Solar energy
Roads and streets:
Chapman (Chapman Dr)
Length: 0.38 miles
Directions: E-W, N-S, SE-NW, SW-NE
Address range: 1114 to 1699
Directions: E-W, N-S, SE-NW, SW-NE
Address range: 1114 to 1699
S 17th St
Length: 0.34 miles
Directions: N-S, SW-NE
Address range: 1117 to 1499
Directions: N-S, SW-NE
Address range: 1117 to 1499
Thelma Ln
Length: 0.22 miles
Directions: E-W, SW-NE
Address range: 1500 to 1699
Directions: E-W, SW-NE
Address range: 1500 to 1699
S 16th St
Length: 0.22 miles
Direction: N-S
Address range: 1100 to 1299
Direction: N-S
Address range: 1100 to 1299
Curtis Dr
Length: 0.18 miles
Directions: E-W, SW-NE
Address range: 1600 to 1699
Directions: E-W, SW-NE
Address range: 1600 to 1699
Hillside Pl
Length: 0.15 miles
Directions: N-S, SE-NW
Address range: 1118 to 1399
Directions: N-S, SE-NW
Address range: 1118 to 1399
Franklin Ave
Length: 0.09 miles
Directions: E-W, SW-NE
Address range: 1600 to 1699
Directions: E-W, SW-NE
Address range: 1600 to 1699
Wengert Ave
Length: 0.07 miles
Direction: E-W
Address range: 1600 to 1699
Direction: E-W
Address range: 1600 to 1699