Hillside neighborhood in Brandon, Florida (FL), 33510 detailed profile
Settings
X


Business Search - 14 Million verified businesses
Area: 0.184 square miles
Population: 1,226
Population density:
| Hillside: | 6,669 people per square mile |
| Brandon: | 4,409 people per square mile |

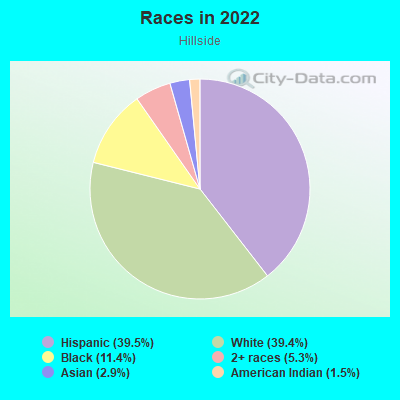
- 48439.5%Hispanic or Latino
- 48239.4%White
- 13911.4%Black
- 655.3%Two or more races
- 362.9%Asian
- 181.5%American Indian
Median household income in 2022:
| Hillside: | $112,837 |
| Brandon: | $75,294 |
Distribution of median household income
![Distribution of median household income]()
- 4Less than $10,000
- 27$10,000 to $19,999
- 38$20,000 to $29,999
- 31$30,000 to $39,999
- 15$40,000 to $49,999
- 24$50,000 to $59,999
- 22$60,000 to $74,999
- 106$75,000 to $99,999
- 43$100,000 to $124,999
- 29$125,000 to $149,999
- 68$150,000 to $199,999
- 26$200,000 or more

Distribution of owner-occupied house/condo value
![Distribution of owner-occupied house/condo value]()
- 11Less than $50,000
- 20$100,000 to $149,999
- 57$150,000 to $199,999
- 103$200,000 to $249,999
- 18$250,000 to $299,999
- 26$300,000 to $399,999
- 21$400,000 to $499,999
- 3$500,000 to $749,999

Distribution of rent paid by renters
![Distribution of rent paid by renters]()
- 19$300 to $399
- 3$700 to $799
- 2$800 to $899
- 14$900 to $999
- 46$1,000 to $1,249
- 7$1,250 to $1,499
- 88$1,500 to $1,999

Median rent in 2022:
| Hillside: | $1,839 |
| Brandon: | $1,597 |
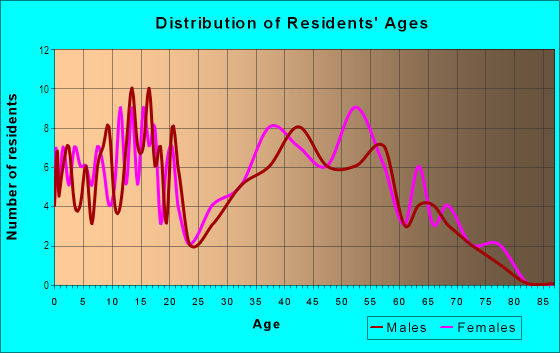
| Males: | 677 |
| Females: | 548 |
Males:
| This neighborhood: | 30.9 years |
| Whole city: | 33.4 years |
| This neighborhood: | 57.6 years |
| Whole city: | 39.4 years |
Average household size:
| Hillside: | 3.6 people |
| Brandon: | 2.6 people |
Percentage of family households:
| Hillside: | 60.3% |
| Brandon: | 46.3% |
| Here: | 48.0% |
| Brandon: | 45.8% |
Percentage of married-couple families with children (among all households):
| Hillside: | 25.4% |
| Brandon: | 19.9% |
Percentage of single-mother households (among all households):
| Hillside: | 3.0% |
| Brandon: | 14.2% |
Percentage of never married males 15 years old and over:
Percentage of never married females 15 years old and over:
| Hillside: | 24.2% |
| Brandon: | 20.9% |
Percentage of never married females 15 years old and over:
| Hillside: | 12.9% |
| place: | 17.4% |
Percentage of people that speak English not well or not at all:
| Hillside: | 15.8% |
| Brandon: | 5.3% |
Percentage of people born in this state:
Percentage of people born in another U.S. state:
Percentage of native residents but born outside the U.S.:
Percentage of foreign born residents:
| Here: | 26.7% |
| Brandon: | 31.1% |
Percentage of people born in another U.S. state:
| Hillside: | 38.0% |
| Brandon: | 41.0% |
Percentage of native residents but born outside the U.S.:
| Here: | 14.5% |
| place: | 6.4% |
Percentage of foreign born residents:
| Here: | 20.8% |
| Brandon: | 21.4% |
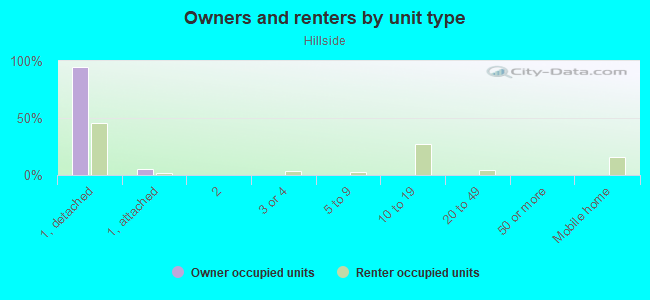
Owner-occupied
Renter-occupied

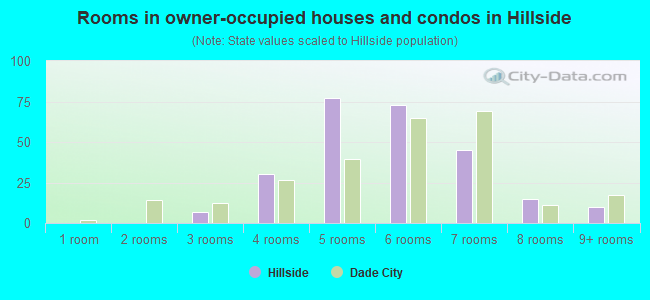
- Rooms in owner-occupied houses and condos in Hillside
- 01 room
- 02 rooms
- 73 rooms
- 304 rooms
- 775 rooms
- 736 rooms
- 457 rooms
- 158 rooms
- 109+ rooms
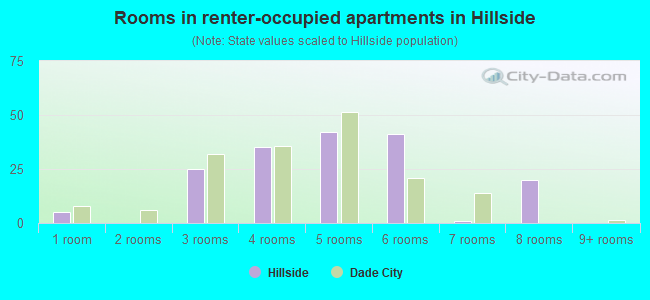
- Rooms in renter-occupied apartments in Hillside
- 51 room
- 02 rooms
- 253 rooms
- 354 rooms
- 425 rooms
- 416 rooms
- 17 rooms
- 208 rooms
- 09+ rooms
Owner-occupied
Renter-occupied
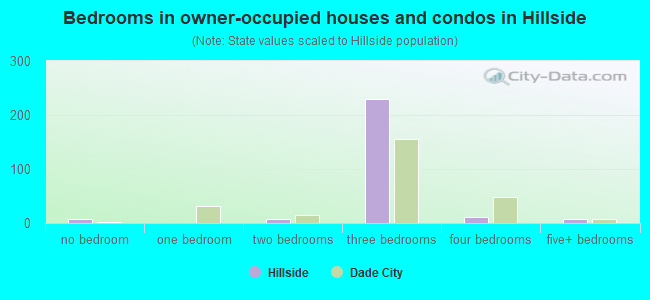
- Bedrooms in owner-occupied houses and condos in Hillside
- 7no bedroom
- 01 bedroom
- 72 bedrooms
- 2293 bedrooms
- 114 bedrooms
- 75+ bedrooms
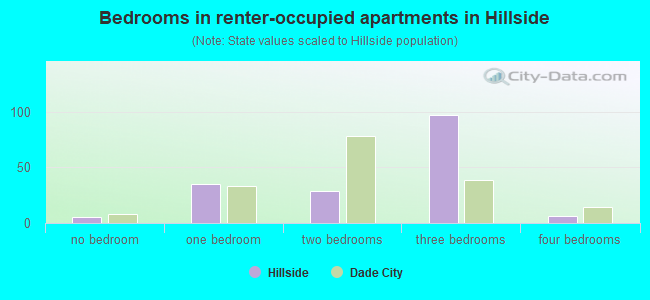
- Bedrooms in renter-occupied apartments in Hillside
- 5no bedroom
- 351 bedroom
- 292 bedrooms
- 973 bedrooms
- 64 bedrooms
- 05+ bedrooms
Average number of cars or other vehicles available in houses/condos:
Average number of cars or other vehicles available in apartments:
| This neighborhood: | 2.1 |
| Brandon: | 2.0 |
Average number of cars or other vehicles available in apartments:
| Here: | 2.2 |
| place: | 1.5 |
Percentage of units with a mortgage:
| Hillside: | 77.2% |
| Brandon: | 68.4% |
Average estimated value of detached houses in 2022 (90.7% of all units):
| Hillside: | $231,685 |
| Brandon: | $324,029 |
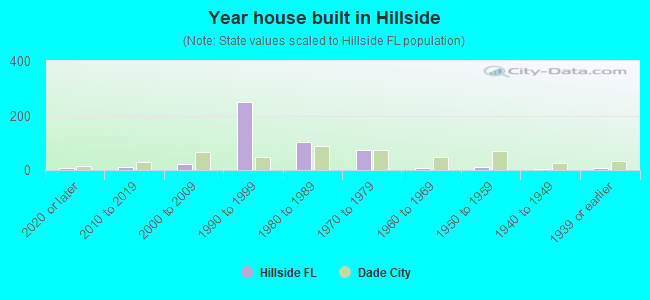
- Year house built in Hillside
- 62020 or later
- 122010 to 2019
- 232000 to 2009
- 2511990 to 1999
- 1021980 to 1989
- 741970 to 1979
- 91960 to 1969
- 101950 to 1959
- 21940 to 1949
- 61939 or earlier
Travel time to work (commute)
![Travel time to work (commute)]()
- 3Less than 5 minutes
- 175 to 9 minutes
- 1910 to 14 minutes
- 5715 to 19 minutes
- 7720 to 24 minutes
- 6225 to 29 minutes
- 9330 to 34 minutes
- 2435 to 39 minutes
- 1940 to 44 minutes
- 5745 to 59 minutes
- 1660 to 89 minutes
- 3990 or more minutes

Means of transportation to work
![Means of transportation to work]()
- 80.5%573Drove a car alone
- 11.2%80Carpooled
- 0.3%2Walked
- 1.3%9Other means
- 6.7%48Worked at home

Time leaving home to go to work
![Time leaving home to go to work]()
- 4212:00 a.m. to 4:59 a.m.
- 295:00 a.m. to 5:29 a.m.
- 415:30 a.m. to 5:59 a.m.
- 306:00 a.m. to 6:29 a.m.
- 286:30 a.m. to 6:59 a.m.
- 697:00 a.m. to 7:29 a.m.
- 177:30 a.m. to 7:59 a.m.
- 878:00 a.m. to 8:29 a.m.
- 218:30 a.m. to 8:59 a.m.
- 289:00 a.m. to 9:59 a.m.
- 1010:00 a.m. to 10:59 a.m.
- 111:00 a.m. to 11:59 a.m.
- 112:00 p.m. to 3:59 p.m.
- 534:00 p.m. to 11:59 p.m.

Occupations of males:
- Percentage of males in management occupations (except farmers):
Here: 16.3% place: 11.5%
- Percentage of males in business and financial operations occupations:
Here: 4.0% place: 7.6%
- Percentage of males in architecture and engineering occupations:
Here: 1.5% place: 2.7%
- Percentage of males in arts, design, entertainment, sports, and media occupations:
Here: 3.5% place: 1.4%
- Percentage of males in healthcare practitioners and technical occupations:
Here: 4.7% place: 2.8%
- Percentage of males in service occupations:
Here: 16.0% place: 15.4%
- Percentage of males in sales and office occupations:
Here: 5.8% place: 16.5%
- Percentage of males in construction, extraction, and maintenance occupations:
Here: 16.1% place: 8.3%
- Percentage of males in production occupations:
Here: 7.9% place: 3.6%
- Percentage of males in transportation occupations:
Here: 11.1% place: 7.4%
- Percentage of males in material moving occupations:
Here: 5.2% place: 5.5%
Occupations of females:
- Percentage of females in management occupations (except farmers):
Here: 11.9% place: 9.0%
- Percentage of females in business and financial operations occupations:
Here: 9.6% place: 8.8%
- Percentage of females in computer and mathematical occupations:
Here: 1.0% place: 2.5%
- Percentage of females in community and social services occupations:
Here: 10.6% place: 1.5%
- Percentage of females in legal occupations:
Here: 3.6% place: 1.0%
- Percentage of females in education, training, and library occupations:
Here: 3.4% place: 8.9%
- Percentage of females in arts, design, entertainment, sports, and media occupations:
Here: 1.8% place: 1.7%
- Percentage of females in healthcare practitioners and technical occupations:
Here: 7.5% place: 9.8%
- Percentage of females in service occupations:
Here: 14.7% place: 17.4%
- Percentage of females in sales and office occupations:
Here: 34.9% place: 32.3%
- Percentage of females in production occupations:
Here: 3.9% place: 2.8%
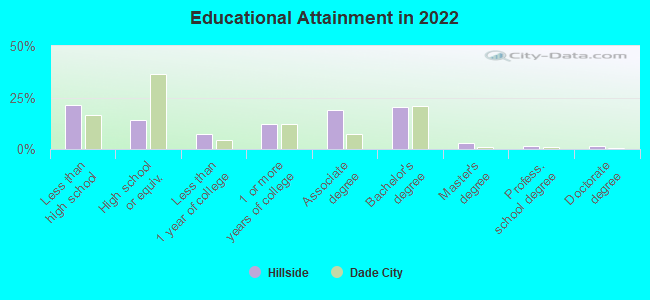
Education in this neighborhood (subdivision or community):
- Percentage of people 3 years and older in K-12 schools:
Hillside: 9.5% Brandon: 17.5%
- Percentage of people 3 years and older in undergraduate colleges:
Hillside: 4.4% Brandon: 4.1%
- Percentage of people 3 years and older in grad. or professional schools:
Hillside: 0.9% Brandon: 2.0%
- Percentage of students K-12 enrolled in private schools:
Hillside: 23.4% Brandon: 12.8%
Percentage of population below poverty level:
| Hillside: | 10.3% |
| Brandon: | 14.5% |
Median year owner moved in (as recorded in 2022):
Median year renter moved in (as recorded in 2022):
| Hillside: | 2304 |
| Brandon: | 2011 |
Median year renter moved in (as recorded in 2022):
| Hillside: | 2320 |
| Brandon: | 2021 |
Percentage of married-couple families with both working:
| Hillside: | 47.5% |
| Brandon: | 62.8% |
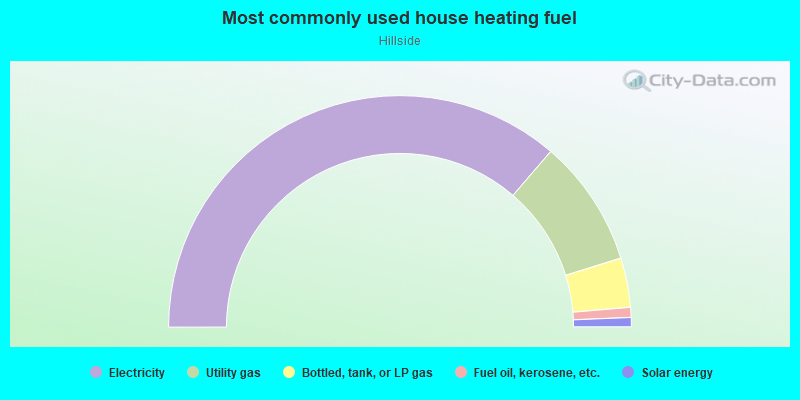
- 72.6%Electricity
- 17.8%Utility gas
- 6.9%Bottled, tank, or LP gas
- 1.4%Fuel oil, kerosene, etc.
- 1.3%Solar energy
Roads and streets:
Valley Hill Dr
Length: 0.54 miles
Directions: E-W, N-S, SE-NW, SW-NE
Address range: 500 to 826
Directions: E-W, N-S, SE-NW, SW-NE
Address range: 500 to 826
Granite Rd
Length: 0.50 miles
Directions: E-W, SW-NE
Address range: 600 to 919
Directions: E-W, SW-NE
Address range: 600 to 919
Forest Hills Dr
Length: 0.48 miles
Directions: E-W, N-S, SE-NW, SW-NE
Address range: 600 to 722
Directions: E-W, N-S, SE-NW, SW-NE
Address range: 600 to 722
Green Cove Dr
Length: 0.45 miles
Directions: N-S, SE-NW, SW-NE
Address range: 500 to 732
Directions: N-S, SE-NW, SW-NE
Address range: 500 to 732
Hillrise Dr
Length: 0.32 miles
Directions: E-W, N-S, SE-NW, SW-NE
Address range: 900 to 941
Directions: E-W, N-S, SE-NW, SW-NE
Address range: 900 to 941
Hillpoint Way
Length: 0.29 miles
Directions: E-W, SE-NW
Address range: 600 to 723
Directions: E-W, SE-NW
Address range: 600 to 723
Hillpine Way
Length: 0.27 miles
Direction: SE-NW
Address range: 500 to 819
Direction: SE-NW
Address range: 500 to 819
Stone Dr
Length: 0.26 miles
Directions: E-W, N-S, SE-NW
Address range: 600 to 639
Directions: E-W, N-S, SE-NW
Address range: 600 to 639
Hilldale Rd
Length: 0.19 miles
Directions: E-W, N-S, SW-NE
Address range: 500 to 529
Directions: E-W, N-S, SW-NE
Address range: 500 to 529
Olive Ct
Length: 0.07 miles
Directions: N-S, SE-NW
Address range: 500 to 515
Directions: N-S, SE-NW
Address range: 500 to 515
Canoe Ct
Length: 0.07 miles
Directions: SE-NW, SW-NE
Address range: 800 to 809
Directions: SE-NW, SW-NE
Address range: 800 to 809
Willow Ct
Length: 0.05 miles
Direction: SE-NW
Address range: 600 to 612
Direction: SE-NW
Address range: 600 to 612
Sideview Ct
Length: 0.04 miles
Direction: SE-NW
Address range: 500 to 512
Direction: SE-NW
Address range: 500 to 512
Hillside Ct
Length: 0.03 miles
Direction: SW-NE
Address range: 500 to 511
Direction: SW-NE
Address range: 500 to 511
Valley Hill Ct
Length: 0.03 miles
Direction: SW-NE
Address range: 800 to 811
Direction: SW-NE
Address range: 800 to 811
Hillview Ct
Length: 0.03 miles
Direction: SW-NE
Address range: 900 to 909
Direction: SW-NE
Address range: 900 to 909