Hillcrest neighborhood in Denver, Colorado (CO), 80260 detailed profile
Settings
X


Business Search - 14 Million verified businesses
Area: 0.080 square miles
Population: 1,226
Population density:
| Hillcrest: | 15,398 people per square mile |
| Denver: | 4,651 people per square mile |

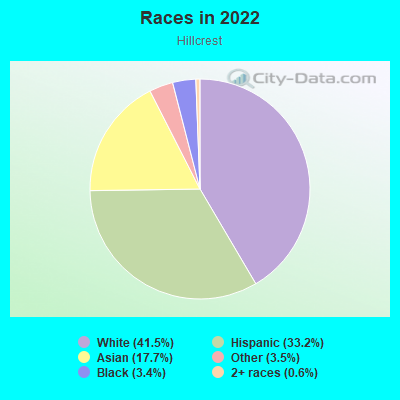
- 56041.5%White
- 44733.2%Hispanic or Latino
- 23917.7%Asian
- 473.5%Some other race
- 463.4%Black
- 80.6%Two or more races
- 10.07%American Indian
Median household income in 2022:
| Hillcrest: | $69,461 |
| Denver: | $88,213 |
Distribution of median household income
![Distribution of median household income]()
- 4Less than $10,000
- 45$10,000 to $19,999
- 97$20,000 to $29,999
- 78$30,000 to $39,999
- 20$40,000 to $49,999
- 47$50,000 to $59,999
- 51$60,000 to $74,999
- 46$75,000 to $99,999
- 78$100,000 to $124,999
- 25$125,000 to $149,999
- 112$150,000 to $199,999
- 20$200,000 or more

Distribution of owner-occupied house/condo value
![Distribution of owner-occupied house/condo value]()
- 113Less than $50,000
- 121$50,000 to $99,999
- 71$100,000 to $149,999
- 11$150,000 to $199,999
- 64$200,000 to $249,999
- 105$250,000 to $299,999
- 53$300,000 to $399,999
- 148$400,000 to $499,999
- 4$500,000 to $749,999
- 35$750,000 to $999,999
- 3$1,000,000 or more

Distribution of rent paid by renters
![Distribution of rent paid by renters]()
- 2$200 to $299
- 4$300 to $399
- 19$600 to $699
- 4$700 to $799
- 7$800 to $899
- 12$900 to $999
- 69$1,000 to $1,249
- 10$1,250 to $1,499
- 45$1,500 to $1,999
- 8$2,000 or more

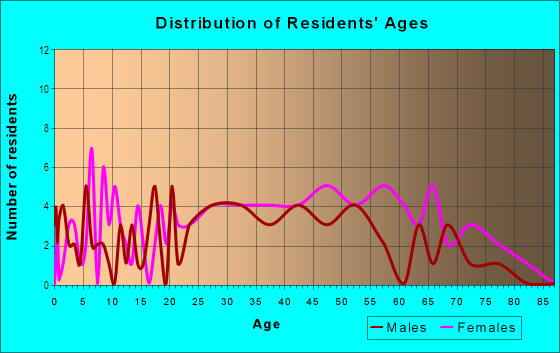
| Males: | 599 |
| Females: | 627 |
Males:
| This neighborhood: | 29.5 years |
| Whole city: | 35.2 years |
| This neighborhood: | 30.9 years |
| Whole city: | 35.1 years |
Average household size:
| Hillcrest: | 12.7 people |
| Denver: | 28.0 people |
Percentage of family households:
| Hillcrest: | 32.7% |
| Denver: | 35.1% |
| Here: | 37.7% |
| Denver: | 32.5% |
Percentage of married-couple families with children (among all households):
| Hillcrest: | 37.9% |
| Denver: | 32.4% |
Percentage of single-mother households (among all households):
| Hillcrest: | 6.1% |
| Denver: | 10.3% |
Percentage of never married males 15 years old and over:
Percentage of never married females 15 years old and over:
| Hillcrest: | 17.9% |
| Denver: | 25.0% |
Percentage of never married females 15 years old and over:
| Hillcrest: | 23.9% |
| city: | 20.8% |
Percentage of people that speak English not well or not at all:
| Hillcrest: | 6.7% |
| Denver: | 3.9% |
Percentage of people born in this state:
Percentage of people born in another U.S. state:
Percentage of native residents but born outside the U.S.:
Percentage of foreign born residents:
| Here: | 53.3% |
| Denver: | 38.5% |
Percentage of people born in another U.S. state:
| Hillcrest: | 21.9% |
| Denver: | 46.1% |
Percentage of native residents but born outside the U.S.:
| Here: | 0.9% |
| city: | 1.7% |
Percentage of foreign born residents:
| Here: | 23.9% |
| Denver: | 13.8% |
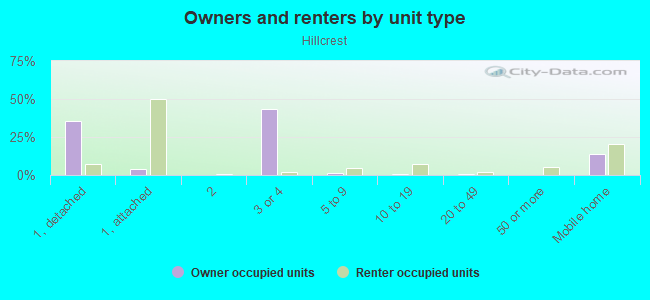
Owner-occupied
Renter-occupied

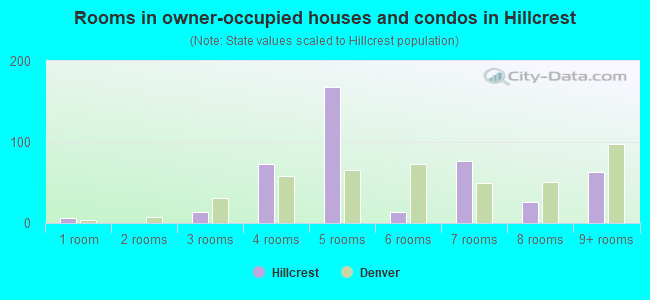
- Rooms in owner-occupied houses and condos in Hillcrest
- 61 room
- 02 rooms
- 143 rooms
- 734 rooms
- 1685 rooms
- 146 rooms
- 767 rooms
- 268 rooms
- 639+ rooms
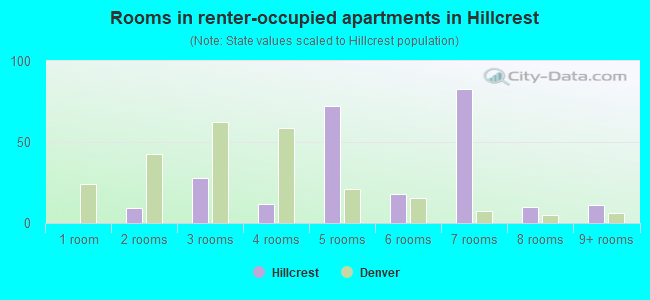
- Rooms in renter-occupied apartments in Hillcrest
- 01 room
- 92 rooms
- 283 rooms
- 124 rooms
- 725 rooms
- 186 rooms
- 837 rooms
- 108 rooms
- 119+ rooms
Owner-occupied
Renter-occupied

- Bedrooms in owner-occupied houses and condos in Hillcrest
- 6no bedroom
- 21 bedroom
- 1102 bedrooms
- 2343 bedrooms
- 484 bedrooms
- 305+ bedrooms
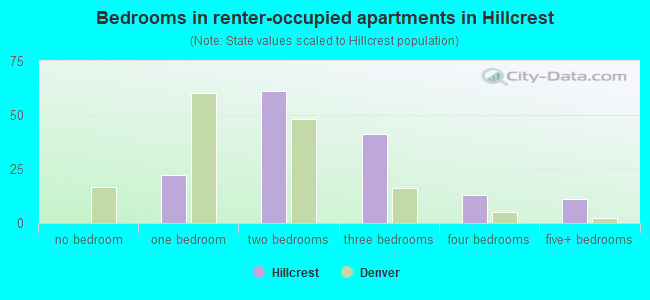
- Bedrooms in renter-occupied apartments in Hillcrest
- 0no bedroom
- 221 bedroom
- 612 bedrooms
- 413 bedrooms
- 134 bedrooms
- 115+ bedrooms
Average number of cars or other vehicles available in houses/condos:
Average number of cars or other vehicles available in apartments:
| This neighborhood: | 0.8 |
| Denver: | 1.9 |
Average number of cars or other vehicles available in apartments:
| Here: | |
| city: |
Percentage of units with a mortgage:
| Hillcrest: | 72.9% |
| Denver: | 75.6% |
Average estimated value of detached houses in 2022 (47.1% of all units):
| Hillcrest: | $336,399 |
| Colorado: | $676,667 |
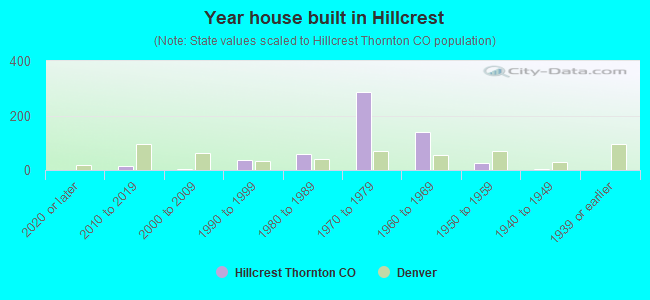
- Year house built in Hillcrest
- 02020 or later
- 152010 to 2019
- 42000 to 2009
- 381990 to 1999
- 591980 to 1989
- 2881970 to 1979
- 1401960 to 1969
- 251950 to 1959
- 51940 to 1949
- 11939 or earlier
City-data.com crime index for city in 2020 (higher means more crime):
| City: | 519.0 |
| U.S. average: | 219.5 |
Travel time to work (commute)
![Travel time to work (commute)]()
- 10Less than 5 minutes
- 155 to 9 minutes
- 7210 to 14 minutes
- 5415 to 19 minutes
- 7320 to 24 minutes
- 1925 to 29 minutes
- 7030 to 34 minutes
- 635 to 39 minutes
- 1540 to 44 minutes
- 12445 to 59 minutes
- 2260 to 89 minutes
- 2190 or more minutes

Means of transportation to work
![Means of transportation to work]()
- 65.3%437Drove a car alone
- 16.4%110Carpooled
- 2.2%15Bus
- 0.7%5Bicycle
- 0.4%3Walked
- 3.1%21Other means
- 15.5%104Worked at home

Time leaving home to go to work
![Time leaving home to go to work]()
- 2412:00 a.m. to 4:59 a.m.
- 255:00 a.m. to 5:29 a.m.
- 245:30 a.m. to 5:59 a.m.
- 636:00 a.m. to 6:29 a.m.
- 496:30 a.m. to 6:59 a.m.
- 677:00 a.m. to 7:29 a.m.
- 357:30 a.m. to 7:59 a.m.
- 278:00 a.m. to 8:29 a.m.
- 218:30 a.m. to 8:59 a.m.
- 189:00 a.m. to 9:59 a.m.
- 1610:00 a.m. to 10:59 a.m.
- 1011:00 a.m. to 11:59 a.m.
- 3412:00 p.m. to 3:59 p.m.
- 234:00 p.m. to 11:59 p.m.

Occupations of males:
- Percentage of males in management occupations (except farmers):
Here: 8.8% city: 15.4%
- Percentage of males in computer and mathematical occupations:
Here: 6.2% city: 7.4%
- Percentage of males in education, training, and library occupations:
Here: 2.7% city: 3.1%
- Percentage of males in service occupations:
Here: 12.3% city: 11.9%
- Percentage of males in sales and office occupations:
Here: 22.7% city: 15.4%
- Percentage of males in construction, extraction, and maintenance occupations:
Here: 5.5% city: 8.0%
- Percentage of males in production occupations:
Here: 14.7% city: 3.2%
- Percentage of males in transportation occupations:
Here: 16.3% city: 4.2%
- Percentage of males in material moving occupations:
Here: 3.0% city: 3.5%
Occupations of females:
- Percentage of females in management occupations (except farmers):
Here: 14.2% city: 14.0%
- Percentage of females in life, physical, and social science occupations:
Here: 21.1% city: 1.5%
- Percentage of females in education, training, and library occupations:
Here: 3.9% city: 7.9%
- Percentage of females in service occupations:
Here: 48.3% city: 16.2%
- Percentage of females in sales and office occupations:
Here: 10.7% city: 21.4%
- Percentage of females in production occupations:
Here: 2.5% city: 1.7%
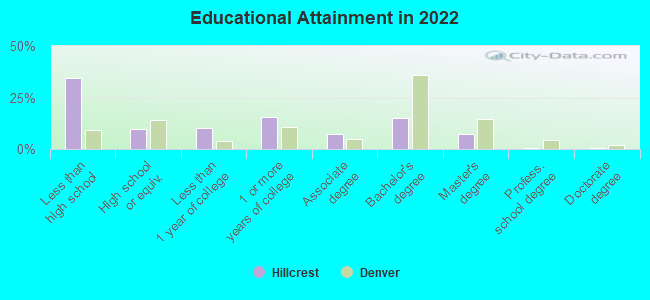
Education in this neighborhood (subdivision or community):
- Percentage of people 3 years and older in K-12 schools:
Hillcrest: 13.7% Denver: 12.7%
- Percentage of people 3 years and older in undergraduate colleges:
Hillcrest: 11.6% Denver: 4.1%
- Percentage of people 3 years and older in grad. or professional schools:
Hillcrest: 1.8% Denver: 2.2%
- Percentage of students K-12 enrolled in private schools:
Hillcrest: 6.7% Denver: 11.0%
Percentage of population below poverty level:
| Hillcrest: | 9.4% |
| Denver: | 11.8% |
Median year owner moved in (as recorded in 2022):
| Hillcrest: | 2012 |
| Denver: | 2014 |
Percentage of married-couple families with both working:
| Hillcrest: | 40.9% |
| Denver: | 74.1% |
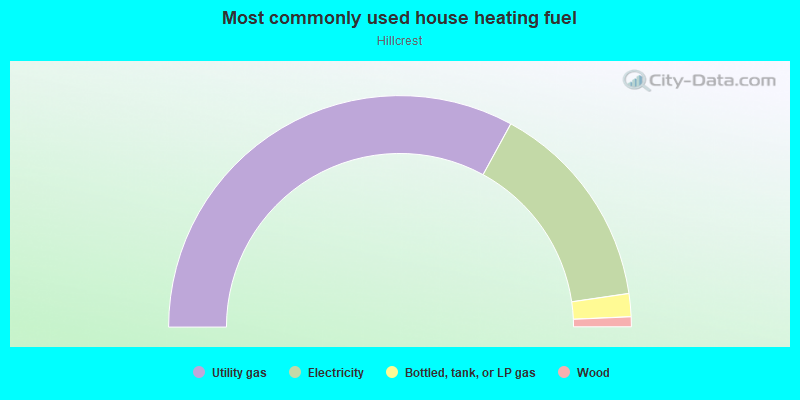
- 65.9%Utility gas
- 29.5%Electricity
- 3.2%Bottled, tank, or LP gas
- 1.4%Wood
Roads and streets:
Orangewood Dr
Length: 0.36 miles
Directions: E-W, N-S, SW-NE
Address range: 9600 to 9699
Directions: E-W, N-S, SW-NE
Address range: 9600 to 9699
Croke Dr
Length: 0.34 miles
Directions: N-S, SW-NE
Address range: 9600 to 9898
Directions: N-S, SW-NE
Address range: 9600 to 9898
Pecos St (N Pecos St)
Length: 0.23 miles
Direction: N-S
Address range: 9602 to 9607
Direction: N-S
Address range: 9602 to 9607
Lane St
Length: 0.17 miles
Directions: N-S, SE-NW, SW-NE
Address range: 9600 to 9748
Directions: N-S, SE-NW, SW-NE
Address range: 9600 to 9748
W 97th Ave
Length: 0.14 miles
Direction: E-W
Address range: 1270 to 1399
Direction: E-W
Address range: 1270 to 1399
W 96th Ave
Length: 0.10 miles
Directions: E-W, SW-NE
Address range: 1266 to 1599
Directions: E-W, SW-NE
Address range: 1266 to 1599