Highland Park neighborhood in Columbia, South Carolina (SC), 29204 detailed profile
Settings
X

Business Search - 14 Million verified businesses
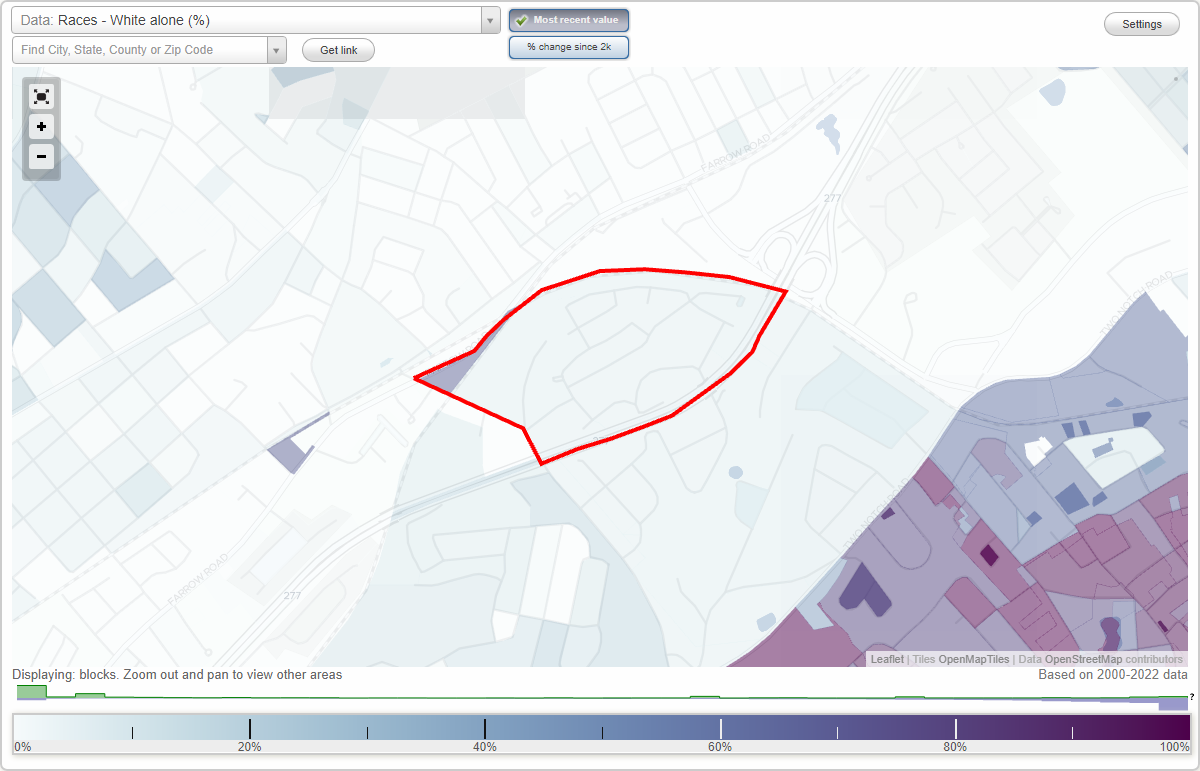
Area: 0.243 square miles
Population: 3,111
Population density:
| Highland Park: | 12,783 people per square mile |
| Columbia: | 1,113 people per square mile |

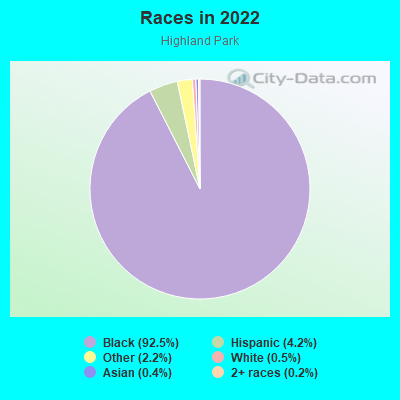
- 2,88892.5%Black
- 1314.2%Hispanic or Latino
- 702.2%Some other race
- 150.5%White
- 120.4%Asian
- 70.2%Two or more races
Median household income in 2022:
| Highland Park: | $40,524 |
| Columbia: | $56,175 |
Distribution of median household income
![Distribution of median household income]()
- 428Less than $10,000
- 245$10,000 to $19,999
- 149$20,000 to $29,999
- 116$30,000 to $39,999
- 51$40,000 to $49,999
- 12$50,000 to $59,999
- 83$60,000 to $74,999
- 64$75,000 to $99,999
- 29$100,000 to $124,999
- 5$125,000 to $149,999
- 4$150,000 to $199,999
- 7$200,000 or more

Distribution of owner-occupied house/condo value
![Distribution of owner-occupied house/condo value]()
- 60Less than $50,000
- 126$50,000 to $99,999
- 40$100,000 to $149,999
- 13$150,000 to $199,999
- 6$200,000 to $249,999
- 1$300,000 to $399,999
- 4$400,000 to $499,999
- 1$500,000 to $749,999

Distribution of rent paid by renters
![Distribution of rent paid by renters]()
- 128Less than $100
- 301$100 to $199
- 77$200 to $299
- 31$300 to $399
- 47$400 to $499
- 13$500 to $599
- 101$600 to $699
- 127$700 to $799
- 103$800 to $899
- 39$900 to $999
- 25$1,000 to $1,249
- 14$1,250 to $1,499

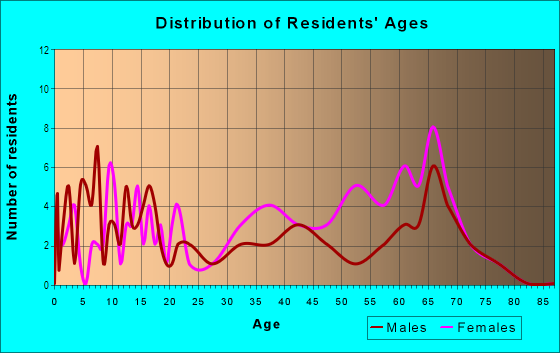
| Males: | 1,229 |
| Females: | 1,881 |
Males:
| This neighborhood: | 35.6 years |
| Whole city: | 27.5 years |
| This neighborhood: | 38.2 years |
| Whole city: | 29.3 years |
Average household size:
| Highland Park: | 2.6 people |
| Columbia: | 2.1 people |
Percentage of family households:
| Highland Park: | 63.0% |
| Columbia: | 35.2% |
| Here: | 5.0% |
| Columbia: | 27.5% |
Percentage of married-couple families with children (among all households):
| Highland Park: | 2.2% |
| Columbia: | 23.7% |
Percentage of single-mother households (among all households):
| Highland Park: | 34.1% |
| Columbia: | 12.1% |
Percentage of never married males 15 years old and over:
Percentage of never married females 15 years old and over:
| Highland Park: | 20.5% |
| Columbia: | 31.8% |
Percentage of never married females 15 years old and over:
| Highland Park: | 48.1% |
| city: | 26.3% |
Percentage of people that speak English not well or not at all:
| Highland Park: | 0.0% |
| Columbia: | 0.6% |
Percentage of people born in this state:
Percentage of people born in another U.S. state:
Percentage of native residents but born outside the U.S.:
Percentage of foreign born residents:
| Here: | 84.4% |
| Columbia: | 53.1% |
Percentage of people born in another U.S. state:
| Highland Park: | 13.3% |
| Columbia: | 40.1% |
Percentage of native residents but born outside the U.S.:
| Here: | 1.1% |
| city: | 2.2% |
Percentage of foreign born residents:
| Here: | 1.1% |
| Columbia: | 4.6% |
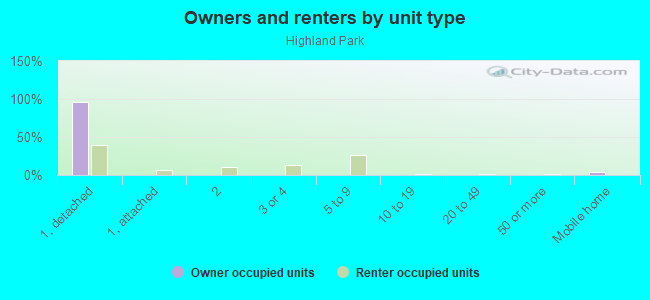
Owner-occupied
Renter-occupied

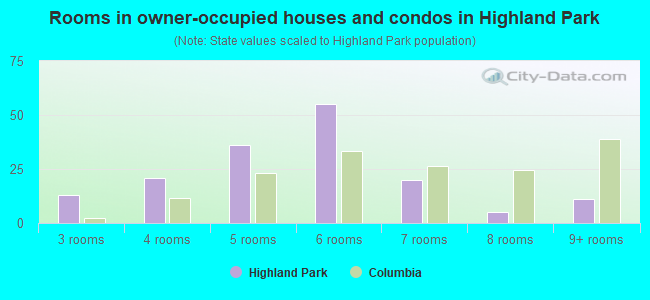
- Rooms in owner-occupied houses and condos in Highland Park
- 01 room
- 02 rooms
- 133 rooms
- 214 rooms
- 365 rooms
- 556 rooms
- 207 rooms
- 58 rooms
- 119+ rooms
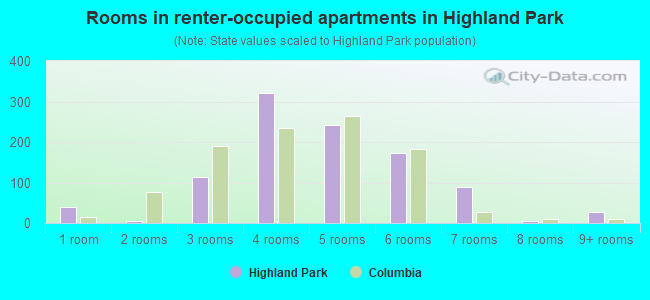
- Rooms in renter-occupied apartments in Highland Park
- 391 room
- 62 rooms
- 1133 rooms
- 3224 rooms
- 2415 rooms
- 1726 rooms
- 887 rooms
- 68 rooms
- 279+ rooms
Owner-occupied
Renter-occupied
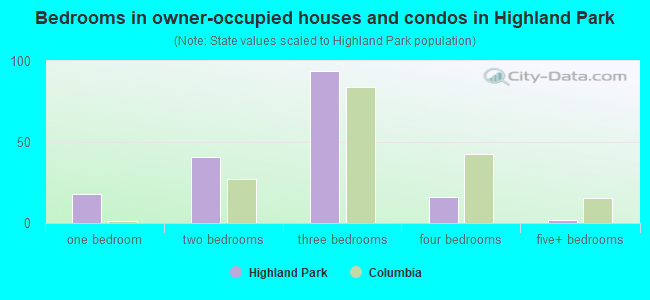
- Bedrooms in owner-occupied houses and condos in Highland Park
- 0no bedroom
- 181 bedroom
- 412 bedrooms
- 943 bedrooms
- 164 bedrooms
- 25+ bedrooms
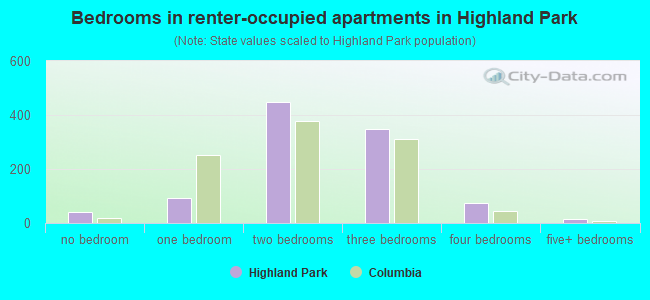
- Bedrooms in renter-occupied apartments in Highland Park
- 39no bedroom
- 931 bedroom
- 4472 bedrooms
- 3473 bedrooms
- 734 bedrooms
- 145+ bedrooms
Average number of cars or other vehicles available in houses/condos:
Average number of cars or other vehicles available in apartments:
| This neighborhood: | 1.4 |
| Columbia: | 1.8 |
Average number of cars or other vehicles available in apartments:
| Here: | 0.6 |
| city: | 1.3 |
Percentage of units with a mortgage:
| Highland Park: | 32.6% |
| Columbia: | 67.5% |
Average estimated value of detached houses in 2022 (48.6% of all units):
| Highland Park: | $83,313 |
| Columbia: | $305,357 |
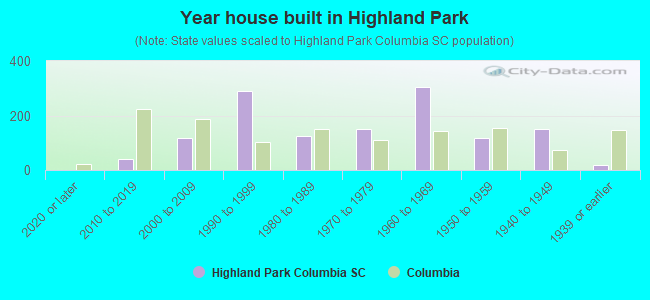
- Year house built in Highland Park
- 02020 or later
- 402010 to 2019
- 1172000 to 2009
- 2911990 to 1999
- 1231980 to 1989
- 1491970 to 1979
- 3031960 to 1969
- 1191950 to 1959
- 1501940 to 1949
- 201939 or earlier
City-data.com crime index for city in 2020 (higher means more crime):
| City: | 446.0 |
| U.S. average: | 219.5 |
Travel time to work (commute)
![Travel time to work (commute)]()
- 145 to 9 minutes
- 1610 to 14 minutes
- 2515 to 19 minutes
- 3920 to 24 minutes
- 325 to 29 minutes
- 1630 to 34 minutes
- 735 to 39 minutes
- 1040 to 44 minutes
- 3145 to 59 minutes
- 760 to 89 minutes
- 3390 or more minutes

Means of transportation to work
![Means of transportation to work]()
- 46.7%313Drove a car alone
- 18.1%121Carpooled
- 14.3%96Bus
- 9.4%63Taxi
- 2.2%15Walked
- 0.4%3Other means
- 9.3%62Worked at home

Time leaving home to go to work
![Time leaving home to go to work]()
- 2012:00 a.m. to 4:59 a.m.
- 15:00 a.m. to 5:29 a.m.
- 55:30 a.m. to 5:59 a.m.
- 106:00 a.m. to 6:29 a.m.
- 66:30 a.m. to 6:59 a.m.
- 187:00 a.m. to 7:29 a.m.
- 197:30 a.m. to 7:59 a.m.
- 178:00 a.m. to 8:29 a.m.
- 38:30 a.m. to 8:59 a.m.
- 129:00 a.m. to 9:59 a.m.
- 210:00 a.m. to 10:59 a.m.
- 511:00 a.m. to 11:59 a.m.
- 1812:00 p.m. to 3:59 p.m.
- 24:00 p.m. to 11:59 p.m.

Occupations of males:
- Percentage of males in management occupations (except farmers):
Here: 15.9% city: 12.3%
- Percentage of males in business and financial operations occupations:
Here: 15.9% city: 4.6%
- Percentage of males in community and social services occupations:
Here: 8.1% city: 1.3%
- Percentage of males in education, training, and library occupations:
Here: 3.0% city: 6.7%
- Percentage of males in arts, design, entertainment, sports, and media occupations:
Here: 125.0% city: 2.0%
- Percentage of males in healthcare practitioners and technical occupations:
Here: 13.6% city: 4.6%
- Percentage of males in service occupations:
Here: 21.5% city: 18.4%
- Percentage of males in sales and office occupations:
Here: 11.0% city: 16.6%
- Percentage of males in construction, extraction, and maintenance occupations:
Here: 2.4% city: 4.8%
- Percentage of males in production occupations:
Here: 15.3% city: 3.9%
- Percentage of males in transportation occupations:
Here: 4.9% city: 4.1%
- Percentage of males in material moving occupations:
Here: 9.7% city: 5.8%
Occupations of females:
- Percentage of females in management occupations (except farmers):
Here: 4.1% city: 8.8%
- Percentage of females in business and financial operations occupations:
Here: 3.7% city: 6.4%
- Percentage of females in community and social services occupations:
Here: 2.2% city: 2.6%
- Percentage of females in healthcare practitioners and technical occupations:
Here: 7.2% city: 8.7%
- Percentage of females in service occupations:
Here: 39.6% city: 20.2%
- Percentage of females in sales and office occupations:
Here: 33.6% city: 26.9%
- Percentage of females in production occupations:
Here: 6.7% city: 3.3%
- Percentage of females in material moving occupations:
Here: 2.6% city: 1.7%
Percentage of people 16-64 in Armed Forces:
| Highland Park: | 0.0% |
| Columbia: | 7.2% |
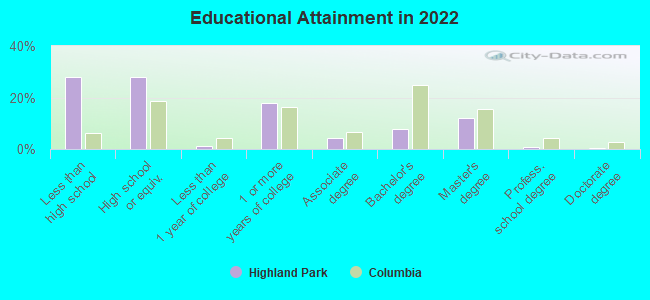
Education in this neighborhood (subdivision or community):
- Percentage of people 3 years and older in K-12 schools:
Highland Park: 32.5% Columbia: 12.2%
- Percentage of people 3 years and older in undergraduate colleges:
Highland Park: 3.5% Columbia: 16.2%
- Percentage of people 3 years and older in grad. or professional schools:
Highland Park: 0.6% Columbia: 3.5%
- Percentage of students K-12 enrolled in private schools:
Highland Park: 2.6% Columbia: 24.2%
Percentage of population below poverty level:
| Highland Park: | 38.8% |
| Columbia: | 20.7% |
Median year owner moved in (as recorded in 2022):
Median year renter moved in (as recorded in 2022):
| Highland Park: | 1989 |
| Columbia: | 2013 |
Median year renter moved in (as recorded in 2022):
| Highland Park: | 2018 |
| Columbia: | 2022 |
Percentage of married-couple families with both working:
| Highland Park: | 85.3% |
| Columbia: | 72.3% |
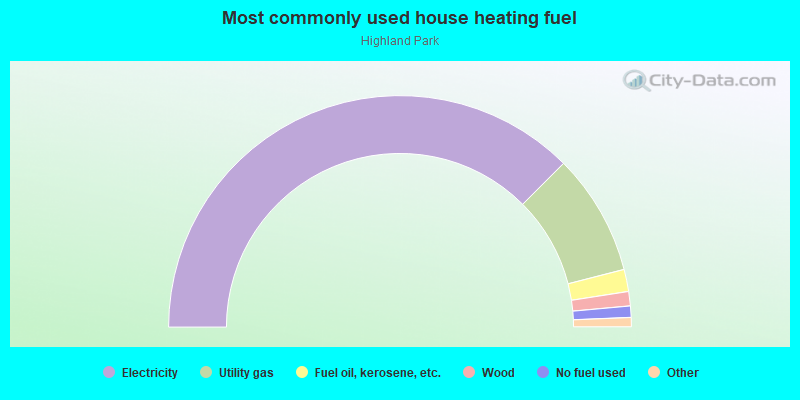
- 75.0%Electricity
- 17.0%Utility gas
- 3.1%Fuel oil, kerosene, etc.
- 2.0%Wood
- 1.6%No fuel used
- 0.7%Bottled, tank, or LP gas
- 0.6%Solar energy
Highways in this neighborhood:
State Hwy 277
Length: 0.83 miles
Directions: E-W, SW-NE
Directions: E-W, SW-NE
Roads and streets:
Highland Park Dr
Length: 0.63 miles
Directions: E-W, N-S, SE-NW, SW-NE
Address range: 3900 to 4398
Directions: E-W, N-S, SE-NW, SW-NE
Address range: 3900 to 4398
Pine Forest Dr
Length: 0.51 miles
Directions: E-W, N-S, SE-NW, SW-NE
Address range: 4000 to 4399
Directions: E-W, N-S, SE-NW, SW-NE
Address range: 4000 to 4399
Pine Cone Dr
Length: 0.37 miles
Directions: E-W, N-S, SE-NW, SW-NE
Address range: 3700 to 4199
Directions: E-W, N-S, SE-NW, SW-NE
Address range: 3700 to 4199
Maurice St
Length: 0.28 miles
Directions: E-W, N-S, SE-NW, SW-NE
Address range: 3975 to 4508
Directions: E-W, N-S, SE-NW, SW-NE
Address range: 3975 to 4508
Conners St
Length: 0.20 miles
Directions: SE-NW, SW-NE
Address range: 4070 to 4299
Directions: SE-NW, SW-NE
Address range: 4070 to 4299
Evergreen Dr (S-40-2672)
Length: 0.20 miles
Directions: E-W, N-S, SW-NE
Address range: 4000 to 4099
Directions: E-W, N-S, SW-NE
Address range: 4000 to 4099
Oscar St
Length: 0.16 miles
Directions: E-W, SW-NE
Address range: 3800 to 3999
Directions: E-W, SW-NE
Address range: 3800 to 3999
Hartford St
Length: 0.14 miles
Directions: E-W, SE-NW
Address range: 4201 to 4599
Directions: E-W, SE-NW
Address range: 4201 to 4599
Chaney St
Length: 0.13 miles
Directions: E-W, SE-NW
Address range: 2035 to 2199
Directions: E-W, SE-NW
Address range: 2035 to 2199
Cushman Dr
Length: 0.09 miles
Directions: E-W, SE-NW
Address range: 2107 to 2307
Directions: E-W, SE-NW
Address range: 2107 to 2307
Pine Cone Ct (S-40-3980)
Length: 0.06 miles
Directions: E-W, N-S
Address range: 1 to 99
Directions: E-W, N-S
Address range: 1 to 99
Belasco St (Frontage Rd)
Length: 0.06 miles
Direction: SW-NE
Address range: 3400 to 4099
Direction: SW-NE
Address range: 3400 to 4099
Pine Forest Cir
Length: 0.04 miles
Direction: N-S
Address range: 1 to 99
Direction: N-S
Address range: 1 to 99
Sc-277 (Hwy 277)
Length: 0.04 miles
Direction: E-W
Direction: E-W
Railroad features:
Csx RR
Length: 0.11 miles
Direction: E-W
Direction: E-W
Other features:
Eightmile Crk
Length: 0.15 miles
Directions: E-W, SE-NW
Directions: E-W, SE-NW