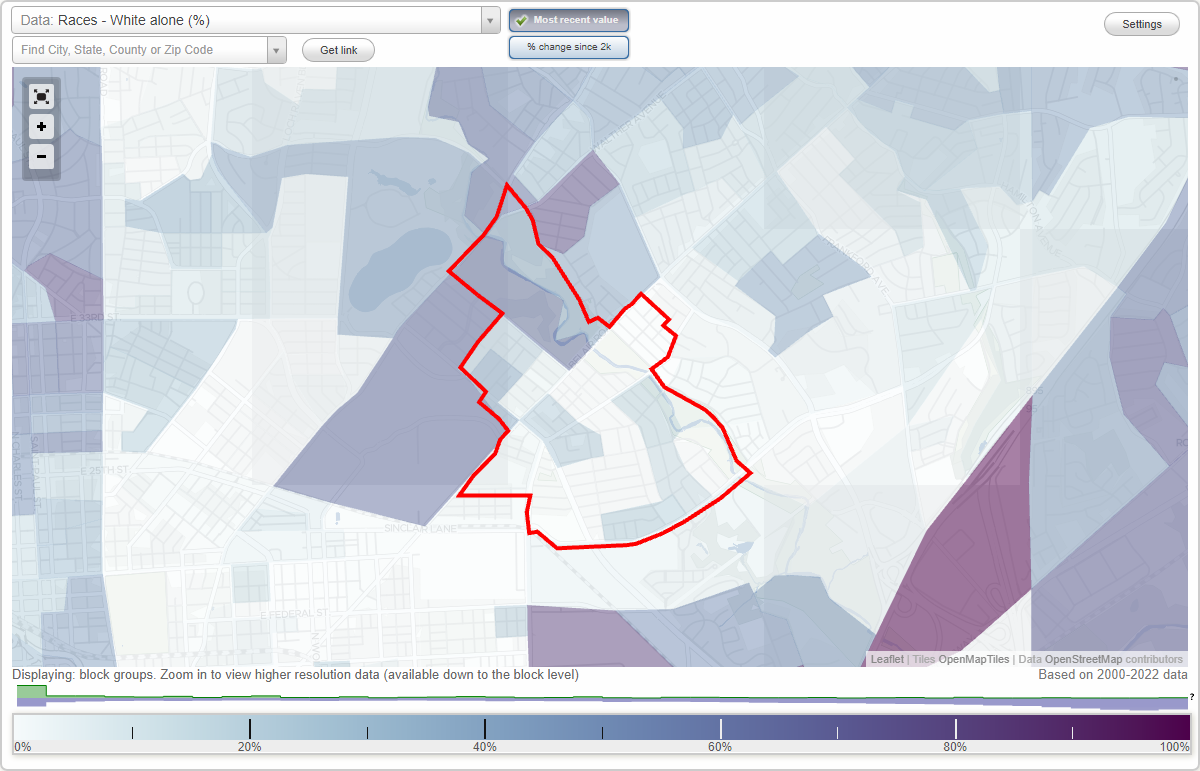
Herring Run Park neighborhood in Baltimore, Maryland (MD), 21206, 21213 detailed profile
Settings
X

Business Search - 14 Million verified businesses
Area: 1.166 square miles
Population: 16,249
Population density:
| Herring Run Park: | 13,931 people per square mile |
| Baltimore: | 7,053 people per square mile |

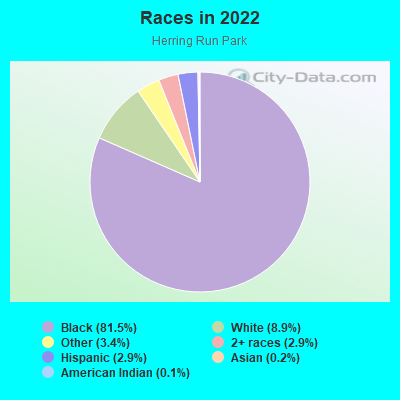
- 14,44881.5%Black
- 1,5848.9%White
- 6113.4%Some other race
- 5162.9%Two or more races
- 5152.9%Hispanic or Latino
- 320.2%Asian
- 190.1%American Indian
Distribution of median household income
![Distribution of median household income]()
- 983Less than $10,000
- 1,319$10,000 to $19,999
- 1,092$20,000 to $29,999
- 1,613$30,000 to $39,999
- 1,012$40,000 to $49,999
- 654$50,000 to $59,999
- 997$60,000 to $74,999
- 953$75,000 to $99,999
- 788$100,000 to $124,999
- 448$125,000 to $149,999
- 584$150,000 to $199,999
- 372$200,000 or more

Distribution of owner-occupied house/condo value
![Distribution of owner-occupied house/condo value]()
- 3,459Less than $50,000
- 2,823$50,000 to $99,999
- 2,707$100,000 to $149,999
- 1,059$150,000 to $199,999
- 428$200,000 to $249,999
- 264$250,000 to $299,999
- 257$300,000 to $399,999
- 164$400,000 to $499,999
- 36$500,000 to $749,999
- 656$750,000 to $999,999
- 587$1,000,000 or more

Distribution of rent paid by renters
![Distribution of rent paid by renters]()
- 615Less than $100
- 1,191$100 to $199
- 858$200 to $299
- 39$300 to $399
- 626$400 to $499
- 716$500 to $599
- 513$600 to $699
- 1,134$700 to $799
- 620$800 to $899
- 866$900 to $999
- 1,461$1,000 to $1,249
- 1,311$1,250 to $1,499
- 421$1,500 to $1,999

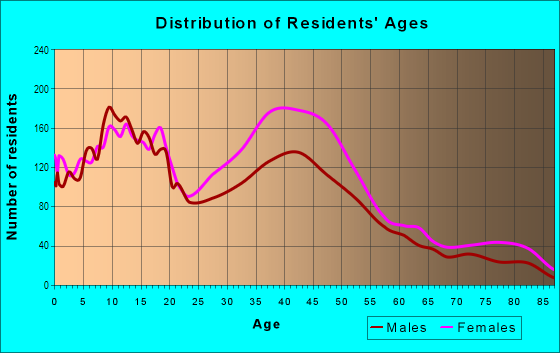
| Males: | 6,942 |
| Females: | 9,306 |
Males:
| This neighborhood: | 37.2 years |
| Whole city: | 35.0 years |
| This neighborhood: | 40.8 years |
| Whole city: | 38.2 years |
Average household size:
| Herring Run Park: | 2.5 people |
| Baltimore: | 2.2 people |
Percentage of family households:
| Herring Run Park: | 48.4% |
| Baltimore: | 34.2% |
| Here: | 17.8% |
| Baltimore: | 23.3% |
Percentage of married-couple families with children (among all households):
| Herring Run Park: | 10.7% |
| Baltimore: | 22.4% |
Percentage of single-mother households (among all households):
| Herring Run Park: | 28.6% |
| Baltimore: | 18.7% |
Percentage of never married males 15 years old and over:
Percentage of never married females 15 years old and over:
| Herring Run Park: | 24.2% |
| Baltimore: | 25.1% |
Percentage of never married females 15 years old and over:
| Herring Run Park: | 34.6% |
| city: | 27.5% |
Percentage of people that speak English not well or not at all:
| Herring Run Park: | 0.9% |
| Baltimore: | 2.3% |
Percentage of people born in this state:
Percentage of people born in another U.S. state:
Percentage of native residents but born outside the U.S.:
Percentage of foreign born residents:
| Here: | 80.1% |
| Baltimore: | 64.4% |
Percentage of people born in another U.S. state:
| Herring Run Park: | 15.5% |
| Baltimore: | 25.0% |
Percentage of native residents but born outside the U.S.:
| Here: | 1.0% |
| city: | 0.9% |
Percentage of foreign born residents:
| Here: | 3.7% |
| Baltimore: | 9.7% |
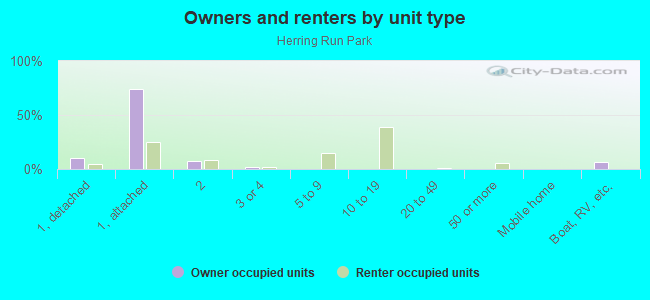
Owner-occupied
Renter-occupied

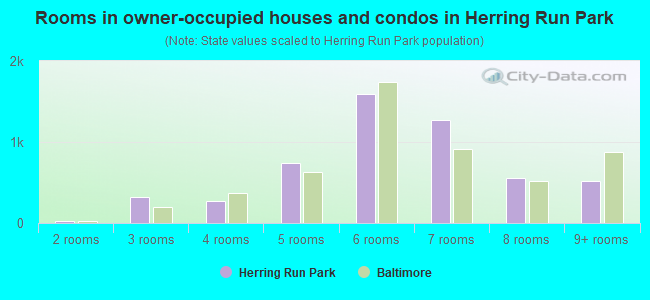
- Rooms in owner-occupied houses and condos in Herring Run Park
- 01 room
- 222 rooms
- 3153 rooms
- 2674 rooms
- 7365 rooms
- 1,5886 rooms
- 1,2707 rooms
- 5528 rooms
- 5209+ rooms
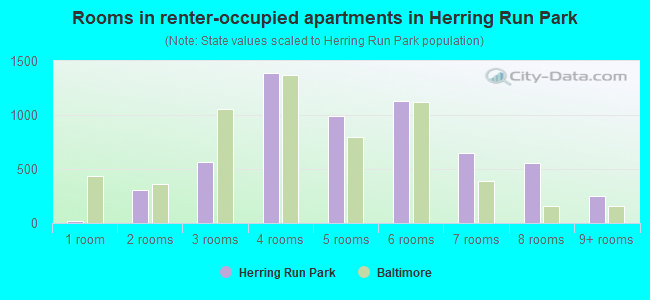
- Rooms in renter-occupied apartments in Herring Run Park
- 221 room
- 3012 rooms
- 5663 rooms
- 1,3884 rooms
- 9925 rooms
- 1,1346 rooms
- 6487 rooms
- 5538 rooms
- 2509+ rooms
Owner-occupied
Renter-occupied
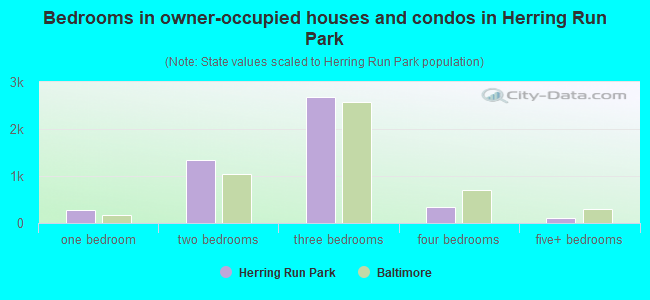
- Bedrooms in owner-occupied houses and condos in Herring Run Park
- 22no bedroom
- 2821 bedroom
- 1,3412 bedrooms
- 2,6893 bedrooms
- 3464 bedrooms
- 1175+ bedrooms
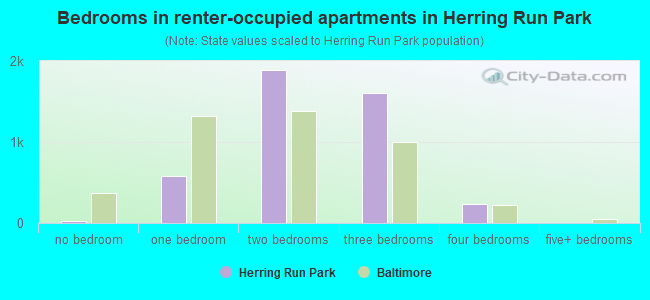
- Bedrooms in renter-occupied apartments in Herring Run Park
- 22no bedroom
- 5791 bedroom
- 1,8942 bedrooms
- 1,6103 bedrooms
- 2384 bedrooms
- 05+ bedrooms
Average number of cars or other vehicles available in houses/condos:
Average number of cars or other vehicles available in apartments:
| This neighborhood: | |
| Baltimore: |
Average number of cars or other vehicles available in apartments:
| Here: | |
| city: |
Percentage of units with a mortgage:
| Herring Run Park: | 77.1% |
| Baltimore: | 64.3% |
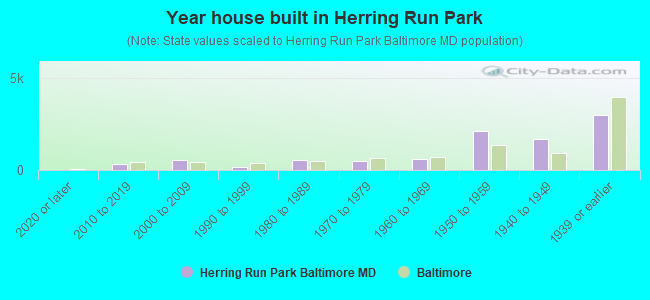
- Year house built in Herring Run Park
- 02020 or later
- 3062010 to 2019
- 5162000 to 2009
- 1641990 to 1999
- 5651980 to 1989
- 5081970 to 1979
- 5881960 to 1969
- 2,0911950 to 1959
- 1,6671940 to 1949
- 2,9531939 or earlier
Travel time to work (commute)
![Travel time to work (commute)]()
- 40Less than 5 minutes
- 1075 to 9 minutes
- 36610 to 14 minutes
- 81115 to 19 minutes
- 1,51320 to 24 minutes
- 54925 to 29 minutes
- 1,15530 to 34 minutes
- 28635 to 39 minutes
- 31440 to 44 minutes
- 70145 to 59 minutes
- 39660 to 89 minutes
- 20690 or more minutes

Means of transportation to work
![Means of transportation to work]()
- 66.9%4,481Drove a car alone
- 13.6%913Carpooled
- 17.9%1,202Bus
- 4.1%275Long-distance train or commuter rail
- 0.1%10Light rail, streetcar or trolley
- 9.4%628Taxi
- 3.7%249Bicycle
- 3.7%245Walked
- 14.5%974Other means
- 10.7%717Worked at home

Time leaving home to go to work
![Time leaving home to go to work]()
- 55612:00 a.m. to 4:59 a.m.
- 2655:00 a.m. to 5:29 a.m.
- 5395:30 a.m. to 5:59 a.m.
- 8106:00 a.m. to 6:29 a.m.
- 5146:30 a.m. to 6:59 a.m.
- 1,0667:00 a.m. to 7:29 a.m.
- 4617:30 a.m. to 7:59 a.m.
- 3748:00 a.m. to 8:29 a.m.
- 2258:30 a.m. to 8:59 a.m.
- 3639:00 a.m. to 9:59 a.m.
- 22110:00 a.m. to 10:59 a.m.
- 22511:00 a.m. to 11:59 a.m.
- 60412:00 p.m. to 3:59 p.m.
- 3514:00 p.m. to 11:59 p.m.

Occupations of males:
- Percentage of males in management occupations (except farmers):
Here: 5.0% city: 10.7%
- Percentage of males in business and financial operations occupations:
Here: 1.1% city: 5.9%
- Percentage of males in computer and mathematical occupations:
Here: 3.7% city: 6.1%
- Percentage of males in education, training, and library occupations:
Here: 3.3% city: 5.4%
- Percentage of males in healthcare practitioners and technical occupations:
Here: 3.9% city: 4.0%
- Percentage of males in service occupations:
Here: 23.1% city: 14.7%
- Percentage of males in sales and office occupations:
Here: 12.4% city: 14.2%
- Percentage of males in construction, extraction, and maintenance occupations:
Here: 4.8% city: 5.6%
- Percentage of males in production occupations:
Here: 3.2% city: 4.2%
- Percentage of males in transportation occupations:
Here: 12.5% city: 6.8%
- Percentage of males in material moving occupations:
Here: 12.9% city: 7.0%
Occupations of females:
- Percentage of females in management occupations (except farmers):
Here: 5.9% city: 10.1%
- Percentage of females in business and financial operations occupations:
Here: 3.3% city: 6.6%
- Percentage of females in computer and mathematical occupations:
Here: 1.9% city: 2.4%
- Percentage of females in community and social services occupations:
Here: 3.1% city: 3.6%
- Percentage of females in legal occupations:
Here: 1.7% city: 1.8%
- Percentage of females in education, training, and library occupations:
Here: 8.6% city: 10.7%
- Percentage of females in healthcare practitioners and technical occupations:
Here: 7.3% city: 9.8%
- Percentage of females in service occupations:
Here: 26.7% city: 20.4%
- Percentage of females in sales and office occupations:
Here: 30.3% city: 22.3%
- Percentage of females in production occupations:
Here: 2.5% city: 2.3%
- Percentage of females in transportation occupations:
Here: 1.1% city: 1.7%
- Percentage of females in material moving occupations:
Here: 5.1% city: 1.9%
Percentage of people 16-64 in Armed Forces:
| Herring Run Park: | 0.1% |
| Baltimore: | 0.4% |
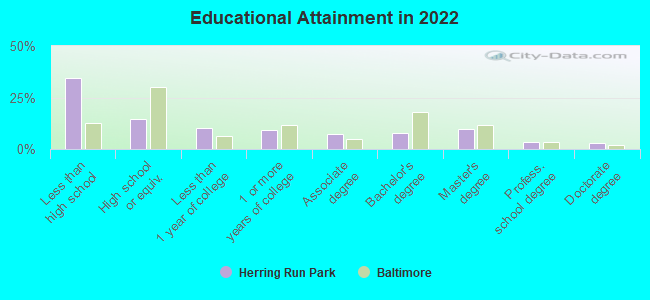
Education in this neighborhood (subdivision or community):
- Percentage of people 3 years and older in K-12 schools:
Herring Run Park: 39.7% Baltimore: 14.7%
- Percentage of people 3 years and older in undergraduate colleges:
Herring Run Park: 9.7% Baltimore: 6.0%
- Percentage of people 3 years and older in grad. or professional schools:
Herring Run Park: 5.3% Baltimore: 2.8%
- Percentage of students K-12 enrolled in private schools:
Herring Run Park: 24.6% Baltimore: 12.7%
Percentage of population below poverty level:
| Herring Run Park: | 26.5% |
| Baltimore: | 18.5% |
Percentage of married-couple families with both working:
| Herring Run Park: | 126.5% |
| Baltimore: | 79.2% |
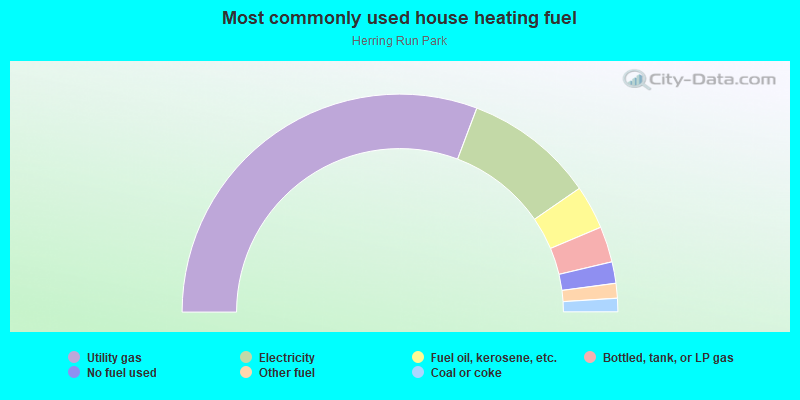
- 61.5%Utility gas
- 19.3%Electricity
- 6.5%Fuel oil, kerosene, etc.
- 5.3%Bottled, tank, or LP gas
- 3.2%No fuel used
- 2.2%Other fuel
- 2.0%Coal or coke
Highways in this neighborhood:
US Hwy 1 (Belair Rd)
Length: 0.91 miles
Direction: SW-NE
Address range: 3100 to 4386
Direction: SW-NE
Address range: 3100 to 4386
State Hwy 147 (Harford Rd)
Length: 0.40 miles
Direction: SW-NE
Address range: 3616 to 4098
Direction: SW-NE
Address range: 3616 to 4098
Roads and streets:
Erdman Ave
Length: 1.65 miles
Direction: SE-NW
Address range: 2868 to 3318
Direction: SE-NW
Address range: 2868 to 3318
Chesterfield Ave
Length: 1.61 miles
Directions: N-S, SE-NW
Address range: 2200 to 4199
Directions: N-S, SE-NW
Address range: 2200 to 4199
Brendan Ave
Length: 1.20 miles
Directions: E-W, N-S, SE-NW
Address range: 2601 to 4199
Directions: E-W, N-S, SE-NW
Address range: 2601 to 4199
Sinclair Ln
Length: 1.19 miles
Directions: E-W, SE-NW, SW-NE
Address range: 3312 to 4557
Directions: E-W, SE-NW, SW-NE
Address range: 3312 to 4557
Shannon Dr
Length: 1.15 miles
Directions: E-W, N-S, SE-NW, SW-NE
Address range: 3000 to 4298
Directions: E-W, N-S, SE-NW, SW-NE
Address range: 3000 to 4298
Lyndale Ave
Length: 1.07 miles
Directions: E-W, SW-NE
Address range: 3500 to 4099
Directions: E-W, SW-NE
Address range: 3500 to 4099
Cliftmont Ave
Length: 0.98 miles
Direction: E-W
Address range: 3200 to 3799
Direction: E-W
Address range: 3200 to 3799
Elmley Ave
Length: 0.96 miles
Direction: E-W
Address range: 3300 to 3899
Direction: E-W
Address range: 3300 to 3899
Elmora Ave
Length: 0.93 miles
Directions: E-W, N-S, SE-NW, SW-NE
Address range: 3506 to 4099
Directions: E-W, N-S, SE-NW, SW-NE
Address range: 3506 to 4099
Dudley Ave
Length: 0.87 miles
Directions: N-S, SE-NW
Address range: 3000 to 4199
Directions: N-S, SE-NW
Address range: 3000 to 4199
Kenyon Ave
Length: 0.85 miles
Directions: E-W, N-S, SE-NW
Address range: 3000 to 3999
Directions: E-W, N-S, SE-NW
Address range: 3000 to 3999
Brehms Ln
Length: 0.77 miles
Directions: E-W, SW-NE
Address range: 3124 to 4099
Directions: E-W, SW-NE
Address range: 3124 to 4099
Kentucky Ave
Length: 0.77 miles
Directions: N-S, SE-NW
Address range: 2600 to 3599
Directions: N-S, SE-NW
Address range: 2600 to 3599
Pelham Ave
Length: 0.76 miles
Directions: E-W, N-S, SE-NW, SW-NE
Address range: 2600 to 3599
Directions: E-W, N-S, SE-NW, SW-NE
Address range: 2600 to 3599
Mannasota Ave
Length: 0.72 miles
Directions: N-S, SW-NE
Address range: 3400 to 4415
Directions: N-S, SW-NE
Address range: 3400 to 4415
Ravenwood Ave
Length: 0.64 miles
Directions: E-W, SW-NE
Address range: 3608 to 3999
Directions: E-W, SW-NE
Address range: 3608 to 3999
Mayfield Ave
Length: 0.58 miles
Directions: E-W, N-S, SE-NW
Address range: 2700 to 3499
Directions: E-W, N-S, SE-NW
Address range: 2700 to 3499
Edison Hwy
Length: 0.57 miles
Directions: N-S, SW-NE
Address range: 2801 to 3198
Directions: N-S, SW-NE
Address range: 2801 to 3198
Kavon Ave
Length: 0.53 miles
Direction: SW-NE
Address range: 3400 to 4499
Direction: SW-NE
Address range: 3400 to 4499
Juneway
Length: 0.46 miles
Direction: E-W
Address range: 3406 to 3599
Direction: E-W
Address range: 3406 to 3599
Bonview Ave
Length: 0.46 miles
Directions: E-W, SW-NE
Address range: 3610 to 3899
Directions: E-W, SW-NE
Address range: 3610 to 3899
Cardenas Ave
Length: 0.36 miles
Direction: SW-NE
Address range: 3300 to 3699
Direction: SW-NE
Address range: 3300 to 3699
Raymonn Ave
Length: 0.36 miles
Directions: N-S, SE-NW
Address range: 3600 to 4199
Directions: N-S, SE-NW
Address range: 3600 to 4199
Woodstock Ave
Length: 0.33 miles
Direction: SW-NE
Address range: 3330 to 3699
Direction: SW-NE
Address range: 3330 to 3699
Lake Ave
Length: 0.33 miles
Direction: SE-NW
Address range: 2518 to 3399
Direction: SE-NW
Address range: 2518 to 3399
Lawnview Ave
Length: 0.33 miles
Directions: E-W, SE-NW
Address range: 3100 to 3399
Directions: E-W, SE-NW
Address range: 3100 to 3399
Findlay Rd
Length: 0.28 miles
Direction: SW-NE
Address range: 4300 to 4406
Direction: SW-NE
Address range: 4300 to 4406
Parklawn Ave
Length: 0.28 miles
Direction: SW-NE
Address range: 3334 to 3599
Direction: SW-NE
Address range: 3334 to 3599
Ramona Ave
Length: 0.26 miles
Direction: SE-NW
Address range: 3200 to 3499
Direction: SE-NW
Address range: 3200 to 3499
Nicholas Ave
Length: 0.22 miles
Direction: SE-NW
Address range: 4238 to 4399
Direction: SE-NW
Address range: 4238 to 4399
Sheldon Ave
Length: 0.21 miles
Direction: SE-NW
Address range: 4200 to 4324
Direction: SE-NW
Address range: 4200 to 4324
Parkside Dr
Length: 0.20 miles
Directions: N-S, SE-NW
Address range: 3300 to 4298
Directions: N-S, SE-NW
Address range: 3300 to 4298
Crossland Ave
Length: 0.19 miles
Direction: SW-NE
Direction: SW-NE
Ardley Ave
Length: 0.16 miles
Direction: SE-NW
Address range: 4000 to 4199
Direction: SE-NW
Address range: 4000 to 4199
Annetta Ave
Length: 0.16 miles
Direction: SW-NE
Address range: 3200 to 3299
Direction: SW-NE
Address range: 3200 to 3299
Shamrock Ave
Length: 0.14 miles
Direction: SE-NW
Address range: 4200 to 4299
Direction: SE-NW
Address range: 4200 to 4299
Seidel Ave
Length: 0.14 miles
Direction: SE-NW
Address range: 4200 to 4299
Direction: SE-NW
Address range: 4200 to 4299
Balfern Ave
Length: 0.13 miles
Direction: SE-NW
Address range: 3900 to 4199
Direction: SE-NW
Address range: 3900 to 4199
Richmond Ave
Length: 0.13 miles
Directions: E-W, SW-NE
Address range: 3327 to 3599
Directions: E-W, SW-NE
Address range: 3327 to 3599
Eastwood Dr
Length: 0.11 miles
Direction: SE-NW
Address range: 3600 to 3679
Direction: SE-NW
Address range: 3600 to 3679
Mareco Ave
Length: 0.10 miles
Directions: E-W, SE-NW
Address range: 3100 to 3199
Directions: E-W, SE-NW
Address range: 3100 to 3199
Clareway
Length: 0.10 miles
Directions: N-S, SE-NW, SW-NE
Address range: 4534 to 4699
Directions: N-S, SE-NW, SW-NE
Address range: 4534 to 4699
Eastmont Ave
Length: 0.09 miles
Direction: N-S
Address range: 4100 to 4199
Direction: N-S
Address range: 4100 to 4199
Coleman Ave
Length: 0.09 miles
Direction: N-S
Address range: 4100 to 4199
Direction: N-S
Address range: 4100 to 4199
Asbury Ave
Length: 0.08 miles
Direction: SW-NE
Address range: 4400 to 4499
Direction: SW-NE
Address range: 4400 to 4499
Gladden Ave
Length: 0.08 miles
Direction: N-S
Address range: 4100 to 4199
Direction: N-S
Address range: 4100 to 4199
Harwell Ave
Length: 0.08 miles
Direction: SW-NE
Address range: 3236 to 3499
Direction: SW-NE
Address range: 3236 to 3499
Teresa Ct
Length: 0.07 miles
Direction: SW-NE
Address range: 3400 to 3499
Direction: SW-NE
Address range: 3400 to 3499
Clarence Ave
Length: 0.04 miles
Direction: SW-NE
Address range: 3236 to 3299
Direction: SW-NE
Address range: 3236 to 3299
Brendle Ct
Length: 0.03 miles
Direction: SW-NE
Address range: 3200 to 3299
Direction: SW-NE
Address range: 3200 to 3299
Longview Ave
Length: 0.02 miles
Direction: N-S
Address range: 2300 to 2399
Direction: N-S
Address range: 2300 to 2399
Other features:
Herring Run
Length: 2.05 miles
Directions: E-W, N-S, SE-NW, SW-NE
Directions: E-W, N-S, SE-NW, SW-NE