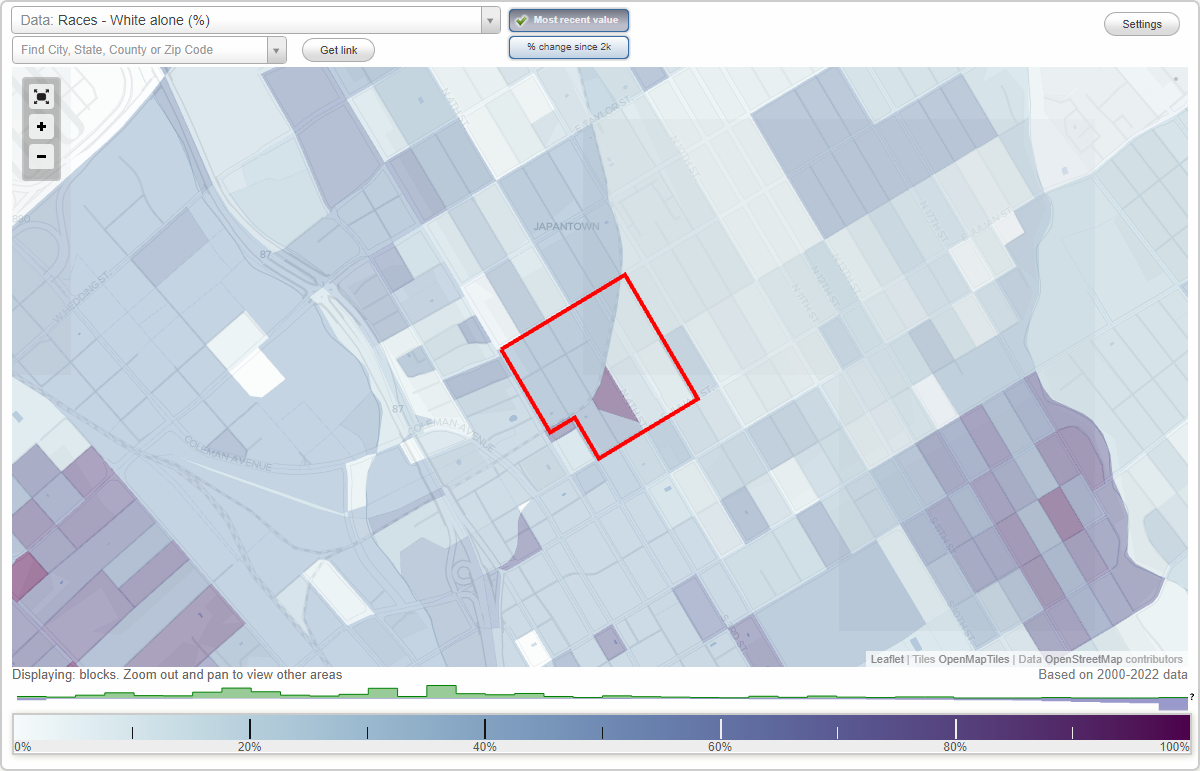
Hensley neighborhood in San Jose, California (CA), 95112 detailed profile
Settings
X

Business Search - 14 Million verified businesses
Area: 0.108 square miles
Population: 2,141
Population density:
| Hensley: | 19,837 people per square mile |
| San Jose: | 5,554 people per square mile |

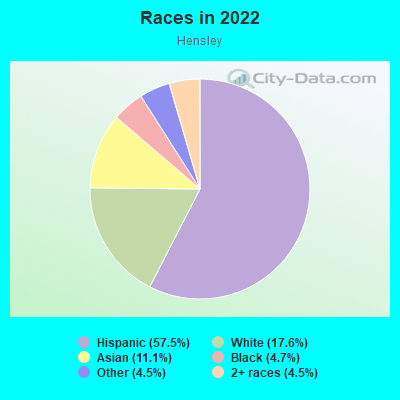
- 1,35457.5%Hispanic or Latino
- 41317.6%White
- 26211.1%Asian
- 1104.7%Black
- 1074.5%Some other race
- 1074.5%Two or more races
Median household income in 2022:
| Hensley: | $62,502 |
| San Jose: | $133,835 |
Distribution of median household income
![Distribution of median household income]()
- 66Less than $10,000
- 111$10,000 to $19,999
- 125$20,000 to $29,999
- 148$30,000 to $39,999
- 13$40,000 to $49,999
- 71$50,000 to $59,999
- 121$60,000 to $74,999
- 154$75,000 to $99,999
- 90$100,000 to $124,999
- 42$125,000 to $149,999
- 29$150,000 to $199,999
- 291$200,000 or more

Distribution of owner-occupied house/condo value
![Distribution of owner-occupied house/condo value]()
- 9$200,000 to $249,999
- 9$500,000 to $749,999
- 23$750,000 to $999,999
- 59$1,000,000 or more

Distribution of rent paid by renters
![Distribution of rent paid by renters]()
- 19Less than $100
- 9$100 to $199
- 125$200 to $299
- 13$300 to $399
- 76$400 to $499
- 29$500 to $599
- 26$700 to $799
- 90$800 to $899
- 136$900 to $999
- 44$1,000 to $1,249
- 88$1,250 to $1,499
- 148$1,500 to $1,999
- 346$2,000 or more

Median rent in 2022:
| Hensley: | $1,591 |
| San Jose: | $2,001 |
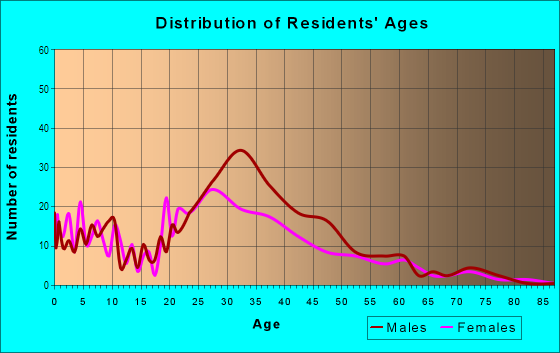
| Males: | 1,339 |
| Females: | 801 |
Males:
| This neighborhood: | 33.1 years |
| Whole city: | 37.6 years |
| This neighborhood: | 22.6 years |
| Whole city: | 39.1 years |
Average household size:
| Hensley: | 11.5 people |
| San Jose: | 2.9 people |
Percentage of family households:
| Hensley: | 20.8% |
| San Jose: | 49.9% |
| Here: | 26.4% |
| San Jose: | 53.0% |
Percentage of married-couple families with children (among all households):
| Hensley: | 46.2% |
| San Jose: | 25.8% |
Percentage of single-mother households (among all households):
| Hensley: | 8.2% |
| San Jose: | 5.2% |
Percentage of never married males 15 years old and over:
Percentage of never married females 15 years old and over:
| Hensley: | 45.3% |
| San Jose: | 20.9% |
Percentage of never married females 15 years old and over:
| Hensley: | 11.3% |
| city: | 16.7% |
Percentage of people that speak English not well or not at all:
| Hensley: | 6.5% |
| San Jose: | 11.4% |
Percentage of people born in this state:
Percentage of people born in another U.S. state:
Percentage of native residents but born outside the U.S.:
Percentage of foreign born residents:
| Here: | 52.1% |
| San Jose: | 46.1% |
Percentage of people born in another U.S. state:
| Hensley: | 13.9% |
| San Jose: | 10.4% |
Percentage of native residents but born outside the U.S.:
| Here: | 1.4% |
| city: | 1.7% |
Percentage of foreign born residents:
| Here: | 32.7% |
| San Jose: | 41.8% |
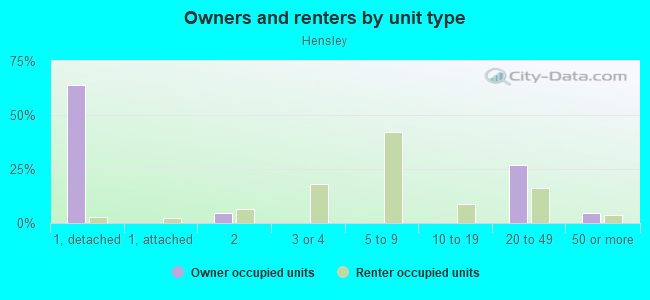
Owner-occupied
Renter-occupied

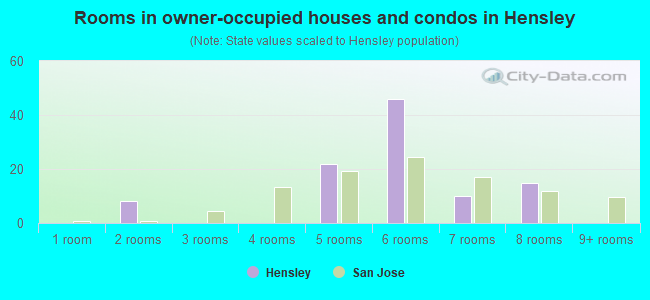
- Rooms in owner-occupied houses and condos in Hensley
- 01 room
- 82 rooms
- 03 rooms
- 04 rooms
- 225 rooms
- 466 rooms
- 107 rooms
- 158 rooms
- 09+ rooms
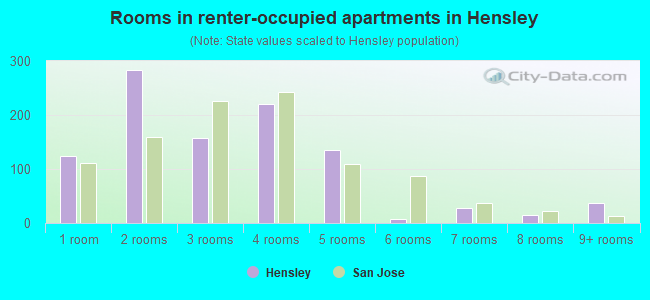
- Rooms in renter-occupied apartments in Hensley
- 1251 room
- 2842 rooms
- 1583 rooms
- 2204 rooms
- 1355 rooms
- 76 rooms
- 287 rooms
- 148 rooms
- 379+ rooms
Owner-occupied
Renter-occupied
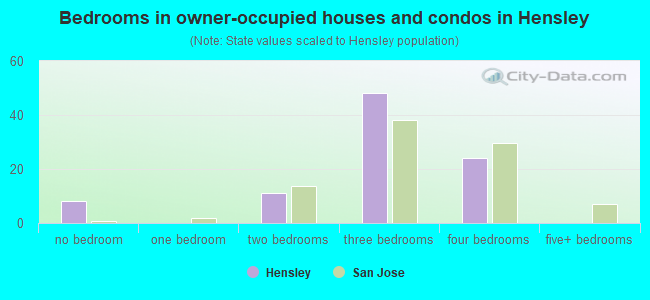
- Bedrooms in owner-occupied houses and condos in Hensley
- 8no bedroom
- 01 bedroom
- 112 bedrooms
- 483 bedrooms
- 244 bedrooms
- 05+ bedrooms
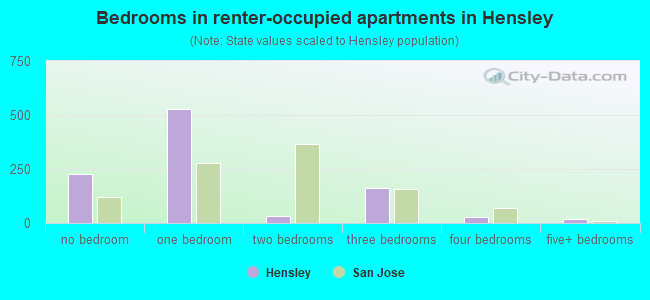
- Bedrooms in renter-occupied apartments in Hensley
- 228no bedroom
- 5291 bedroom
- 312 bedrooms
- 1633 bedrooms
- 304 bedrooms
- 205+ bedrooms
Average number of cars or other vehicles available in houses/condos:
Average number of cars or other vehicles available in apartments:
| This neighborhood: | 3.4 |
| San Jose: | 2.3 |
Average number of cars or other vehicles available in apartments:
| Here: | 0.6 |
| city: | 1.6 |
Percentage of units with a mortgage:
| Hensley: | 45.0% |
| San Jose: | 66.9% |
Average estimated value of detached houses in 2022 (3.2% of all units):
| Hensley: | $1,030,605 |
| San Jose: | $1,532,815 |
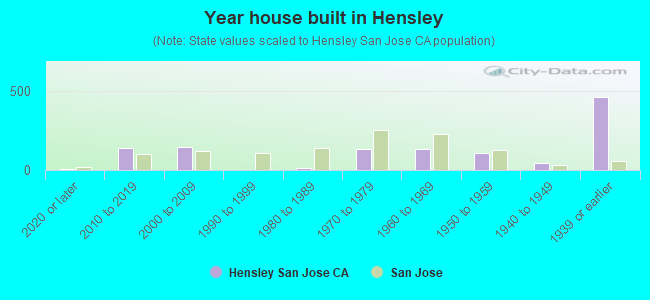
- Year house built in Hensley
- 82020 or later
- 1402010 to 2019
- 1452000 to 2009
- 01990 to 1999
- 131980 to 1989
- 1341970 to 1979
- 1321960 to 1969
- 1071950 to 1959
- 441940 to 1949
- 4621939 or earlier
City-data.com crime index for city in 2020 (higher means more crime):
| City: | 268.4 |
| U.S. average: | 219.5 |
Travel time to work (commute)
![Travel time to work (commute)]()
- 1485 to 9 minutes
- 12710 to 14 minutes
- 28515 to 19 minutes
- 11420 to 24 minutes
- 425 to 29 minutes
- 18530 to 34 minutes
- 1435 to 39 minutes
- 1740 to 44 minutes
- 2645 to 59 minutes
- 5860 to 89 minutes
- 4090 or more minutes

Means of transportation to work
![Means of transportation to work]()
- 78.3%878Drove a car alone
- 7.2%81Carpooled
- 2.2%25Bus
- 2.5%28Subway or elevated rail
- 2.8%31Long-distance train or commuter rail
- 1.8%20Light rail, streetcar or trolley
- 4.8%54Bicycle
- 6.8%76Walked
- 2.5%28Worked at home

Time leaving home to go to work
![Time leaving home to go to work]()
- 10312:00 a.m. to 4:59 a.m.
- 295:00 a.m. to 5:29 a.m.
- 405:30 a.m. to 5:59 a.m.
- 356:00 a.m. to 6:29 a.m.
- 586:30 a.m. to 6:59 a.m.
- 1797:00 a.m. to 7:29 a.m.
- 607:30 a.m. to 7:59 a.m.
- 748:00 a.m. to 8:29 a.m.
- 1178:30 a.m. to 8:59 a.m.
- 779:00 a.m. to 9:59 a.m.
- 6110:00 a.m. to 10:59 a.m.
- 11112:00 p.m. to 3:59 p.m.
- 814:00 p.m. to 11:59 p.m.

Occupations of males:
- Percentage of males in management occupations (except farmers):
Here: 16.3% city: 13.0%
- Percentage of males in computer and mathematical occupations:
Here: 17.8% city: 13.6%
- Percentage of males in architecture and engineering occupations:
Here: 7.2% city: 10.2%
- Percentage of males in sales and office occupations:
Here: 13.8% city: 12.8%
- Percentage of males in construction, extraction, and maintenance occupations:
Here: 28.2% city: 7.8%
- Percentage of males in production occupations:
Here: 4.6% city: 5.5%
- Percentage of males in material moving occupations:
Here: 10.1% city: 3.1%
Occupations of females:
- Percentage of females in business and financial operations occupations:
Here: 17.0% city: 8.6%
- Percentage of females in computer and mathematical occupations:
Here: 23.9% city: 5.4%
- Percentage of females in healthcare practitioners and technical occupations:
Here: 15.2% city: 6.8%
- Percentage of females in service occupations:
Here: 7.9% city: 21.7%
- Percentage of females in sales and office occupations:
Here: 50.5% city: 22.0%
- Percentage of females in material moving occupations:
Here: 3.0% city: 1.5%
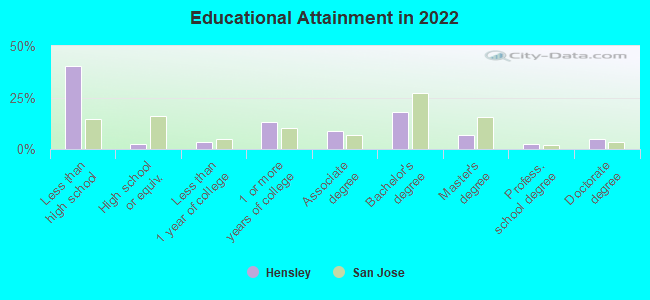
Education in this neighborhood (subdivision or community):
- Percentage of people 3 years and older in K-12 schools:
Hensley: 25.4% San Jose: 16.1%
- Percentage of people 3 years and older in undergraduate colleges:
Hensley: 5.4% San Jose: 6.5%
- Percentage of people 3 years and older in grad. or professional schools:
Hensley: 5.5% San Jose: 2.0%
- Percentage of students K-12 enrolled in private schools:
Hensley: 2.4% San Jose: 14.9%
Percentage of population below poverty level:
| Hensley: | 14.6% |
| San Jose: | 9.0% |
Median year renter moved in (as recorded in 2022):
| Hensley: | 2015 |
| San Jose: | 2020 |
Percentage of married-couple families with both working:
| Hensley: | 53.0% |
| San Jose: | 72.5% |
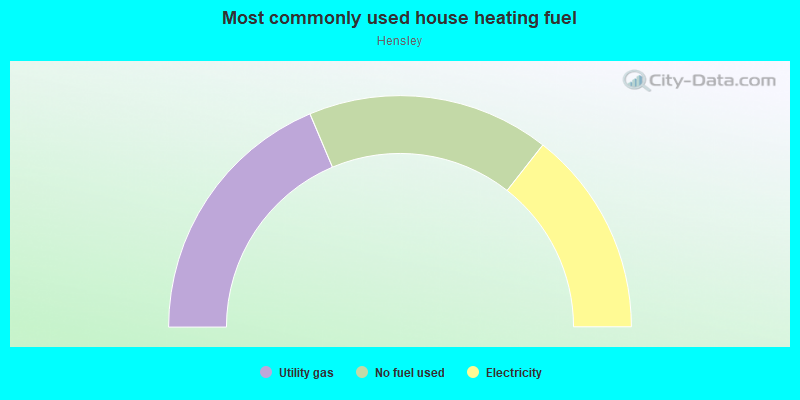
- 37.3%Utility gas
- 33.9%No fuel used
- 28.8%Electricity
Roads and streets:
N 5th St
Length: 0.27 miles
Direction: SE-NW
Address range: 300 to 454
Direction: SE-NW
Address range: 300 to 454
N 3rd St
Length: 0.27 miles
Direction: SE-NW
Address range: 300 to 450
Direction: SE-NW
Address range: 300 to 450
N 4th St
Length: 0.26 miles
Direction: SE-NW
Address range: 301 to 454
Direction: SE-NW
Address range: 301 to 454
E Julian St
Length: 0.25 miles
Directions: E-W, SW-NE
Address range: 100 to 249
Directions: E-W, SW-NE
Address range: 100 to 249
N 6th St
Length: 0.18 miles
Direction: SE-NW
Address range: 300 to 399
Direction: SE-NW
Address range: 300 to 399
Washington St
Length: 0.17 miles
Direction: SW-NE
Address range: 100 to 249
Direction: SW-NE
Address range: 100 to 249
Hensley St
Length: 0.16 miles
Direction: SW-NE
Address range: 51 to 199
Direction: SW-NE
Address range: 51 to 199
N 2nd St
Length: 0.14 miles
Direction: SE-NW
Address range: 390 to 449
Direction: SE-NW
Address range: 390 to 449
Railroad features:
Union Pacific RR
Length: 0.43 miles
Directions: E-W, N-S, SW-NE
Directions: E-W, N-S, SW-NE