Hellyer neighborhood in San Jose, California (CA), 95111, 95121 detailed profile
Settings
X


Business Search - 14 Million verified businesses
Area: 0.175 square miles
Population: 1,331
Population density:
| Hellyer: | 7,620 people per square mile |
| San Jose: | 5,554 people per square mile |

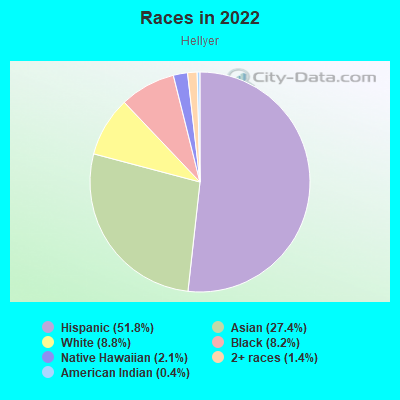
- 68751.8%Hispanic or Latino
- 36327.4%Asian
- 1178.8%White
- 1098.2%Black
- 282.1%Native Hawaiian and Other
Pacific Islander - 181.4%Two or more races
- 50.4%American Indian
Median household income in 2022:
| Hellyer: | $118,594 |
| San Jose: | $133,835 |
Distribution of median household income
![Distribution of median household income]()
- 6Less than $10,000
- 5$10,000 to $19,999
- 25$20,000 to $29,999
- 9$30,000 to $39,999
- 21$40,000 to $49,999
- 26$50,000 to $59,999
- 28$60,000 to $74,999
- 29$75,000 to $99,999
- 26$100,000 to $124,999
- 21$125,000 to $149,999
- 74$150,000 to $199,999
- 54$200,000 or more

Distribution of owner-occupied house/condo value
![Distribution of owner-occupied house/condo value]()
- 8$300,000 to $399,999
- 2$400,000 to $499,999
- 36$500,000 to $749,999
- 152$750,000 to $999,999
- 50$1,000,000 or more

Distribution of rent paid by renters
![Distribution of rent paid by renters]()
- 2$300 to $399
- 2$600 to $699
- 19$700 to $799
- 4$900 to $999
- 5$1,500 to $1,999
- 64$2,000 or more

Median rent in 2022:
| Hellyer: | $2,184 |
| San Jose: | $2,001 |
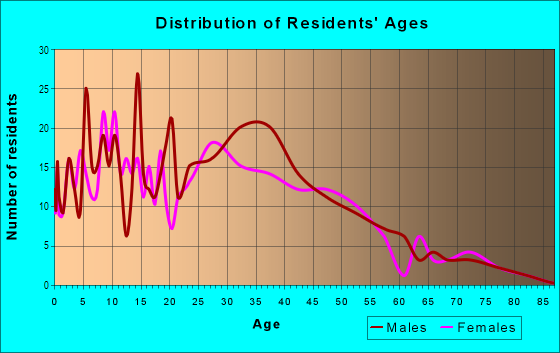
| Males: | 727 |
| Females: | 603 |
Males:
| This neighborhood: | 35.6 years |
| Whole city: | 37.6 years |
| This neighborhood: | 41.5 years |
| Whole city: | 39.1 years |
Average household size:
| Hellyer: | 4.5 people |
| San Jose: | 2.9 people |
Percentage of family households:
| Hellyer: | 60.3% |
| San Jose: | 49.9% |
| Here: | 59.1% |
| San Jose: | 53.0% |
Percentage of married-couple families with children (among all households):
| Hellyer: | 17.6% |
| San Jose: | 25.8% |
Percentage of single-mother households (among all households):
| Hellyer: | 4.8% |
| San Jose: | 5.2% |
Percentage of never married males 15 years old and over:
Percentage of never married females 15 years old and over:
| Hellyer: | 27.8% |
| San Jose: | 20.9% |
Percentage of never married females 15 years old and over:
| Hellyer: | 15.7% |
| city: | 16.7% |
Percentage of people that speak English not well or not at all:
| Hellyer: | 12.5% |
| San Jose: | 11.4% |
Percentage of people born in this state:
Percentage of people born in another U.S. state:
Percentage of native residents but born outside the U.S.:
Percentage of foreign born residents:
| Here: | 45.3% |
| San Jose: | 46.1% |
Percentage of people born in another U.S. state:
| Hellyer: | 4.9% |
| San Jose: | 10.4% |
Percentage of native residents but born outside the U.S.:
| Here: | 0.0% |
| city: | 1.7% |
Percentage of foreign born residents:
| Here: | 49.8% |
| San Jose: | 41.8% |
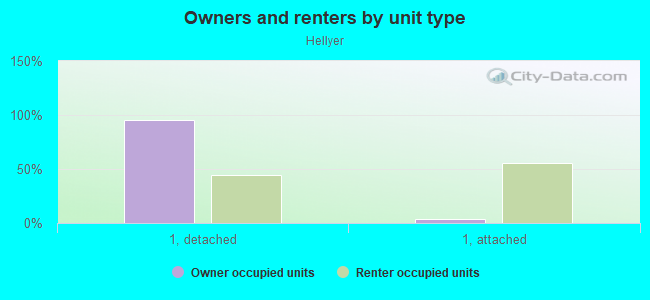
Owner-occupied
Renter-occupied

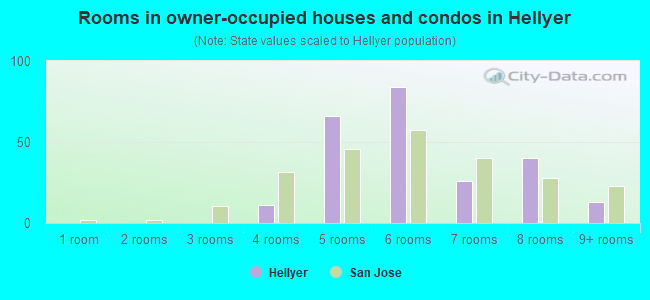
- Rooms in owner-occupied houses and condos in Hellyer
- 01 room
- 02 rooms
- 03 rooms
- 114 rooms
- 665 rooms
- 846 rooms
- 267 rooms
- 408 rooms
- 139+ rooms
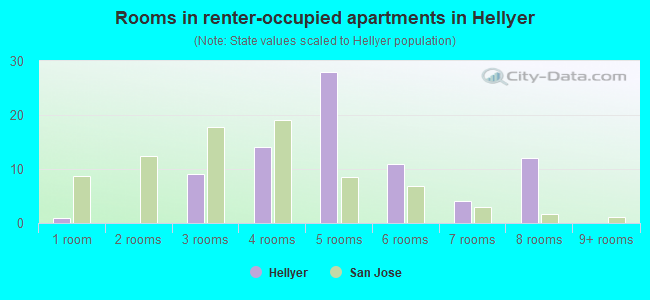
- Rooms in renter-occupied apartments in Hellyer
- 11 room
- 02 rooms
- 93 rooms
- 144 rooms
- 285 rooms
- 116 rooms
- 47 rooms
- 128 rooms
- 09+ rooms
Owner-occupied
Renter-occupied
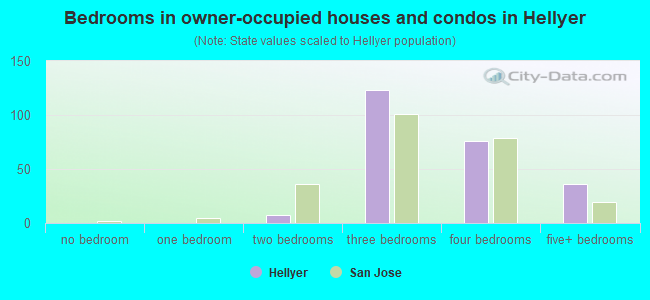
- Bedrooms in owner-occupied houses and condos in Hellyer
- 0no bedroom
- 01 bedroom
- 72 bedrooms
- 1233 bedrooms
- 764 bedrooms
- 365+ bedrooms
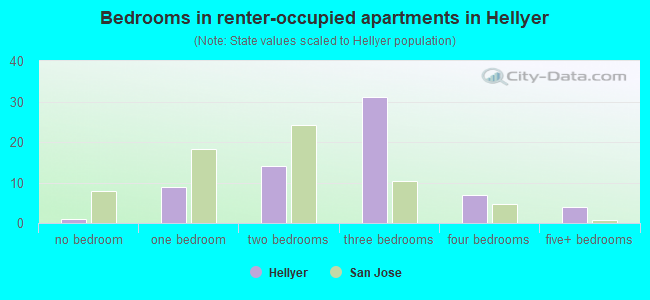
- Bedrooms in renter-occupied apartments in Hellyer
- 1no bedroom
- 91 bedroom
- 142 bedrooms
- 313 bedrooms
- 74 bedrooms
- 45+ bedrooms
Average number of cars or other vehicles available in houses/condos:
Average number of cars or other vehicles available in apartments:
| This neighborhood: | 2.6 |
| San Jose: | 2.3 |
Average number of cars or other vehicles available in apartments:
| Here: | 1.9 |
| city: | 1.6 |
Percentage of units with a mortgage:
| Hellyer: | 57.7% |
| San Jose: | 66.9% |
Average estimated value of detached houses in 2022 (99.7% of all units):
| Hellyer: | $1,011,692 |
| San Jose: | $1,532,815 |
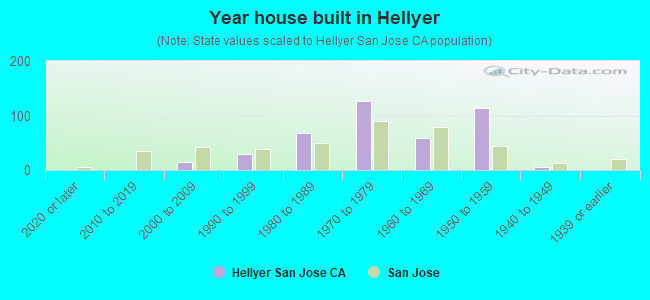
- Year house built in Hellyer
- 02020 or later
- 02010 to 2019
- 142000 to 2009
- 291990 to 1999
- 671980 to 1989
- 1261970 to 1979
- 581960 to 1969
- 1141950 to 1959
- 61940 to 1949
- 01939 or earlier
City-data.com crime index for city in 2020 (higher means more crime):
| City: | 268.4 |
| U.S. average: | 219.5 |
Travel time to work (commute)
![Travel time to work (commute)]()
- 55 to 9 minutes
- 8610 to 14 minutes
- 14415 to 19 minutes
- 10420 to 24 minutes
- 9425 to 29 minutes
- 17530 to 34 minutes
- 2435 to 39 minutes
- 2940 to 44 minutes
- 7845 to 59 minutes
- 4760 to 89 minutes
- 890 or more minutes

Means of transportation to work
![Means of transportation to work]()
- 84.3%567Drove a car alone
- 11.3%76Carpooled
- 1.3%9Bus
- 0.6%4Subway or elevated rail
- 0.6%4Bicycle
- 0.3%2Other means
- 3.7%25Worked at home

Time leaving home to go to work
![Time leaving home to go to work]()
- 4412:00 a.m. to 4:59 a.m.
- 145:00 a.m. to 5:29 a.m.
- 215:30 a.m. to 5:59 a.m.
- 486:00 a.m. to 6:29 a.m.
- 1016:30 a.m. to 6:59 a.m.
- 1357:00 a.m. to 7:29 a.m.
- 757:30 a.m. to 7:59 a.m.
- 808:00 a.m. to 8:29 a.m.
- 628:30 a.m. to 8:59 a.m.
- 419:00 a.m. to 9:59 a.m.
- 3910:00 a.m. to 10:59 a.m.
- 711:00 a.m. to 11:59 a.m.
- 7912:00 p.m. to 3:59 p.m.
- 724:00 p.m. to 11:59 p.m.

Occupations of males:
- Percentage of males in management occupations (except farmers):
Here: 12.7% city: 13.0%
- Percentage of males in computer and mathematical occupations:
Here: 1.6% city: 13.6%
- Percentage of males in architecture and engineering occupations:
Here: 4.7% city: 10.2%
- Percentage of males in life, physical, and social science occupations:
Here: 2.0% city: 1.1%
- Percentage of males in healthcare practitioners and technical occupations:
Here: 1.6% city: 2.0%
- Percentage of males in service occupations:
Here: 15.2% city: 12.7%
- Percentage of males in sales and office occupations:
Here: 27.9% city: 12.8%
- Percentage of males in construction, extraction, and maintenance occupations:
Here: 8.8% city: 7.8%
- Percentage of males in production occupations:
Here: 5.1% city: 5.5%
- Percentage of males in transportation occupations:
Here: 6.7% city: 3.6%
- Percentage of males in material moving occupations:
Here: 12.9% city: 3.1%
Occupations of females:
- Percentage of females in management occupations (except farmers):
Here: 7.3% city: 11.0%
- Percentage of females in business and financial operations occupations:
Here: 6.7% city: 8.6%
- Percentage of females in architecture and engineering occupations:
Here: 2.7% city: 2.8%
- Percentage of females in arts, design, entertainment, sports, and media occupations:
Here: 2.7% city: 2.0%
- Percentage of females in healthcare practitioners and technical occupations:
Here: 10.8% city: 6.8%
- Percentage of females in service occupations:
Here: 42.7% city: 21.7%
- Percentage of females in sales and office occupations:
Here: 23.2% city: 22.0%
- Percentage of females in production occupations:
Here: 2.2% city: 4.0%
Education in this neighborhood (subdivision or community):
- Percentage of people 3 years and older in K-12 schools:
Hellyer: 15.9% San Jose: 16.1%
- Percentage of people 3 years and older in undergraduate colleges:
Hellyer: 8.1% San Jose: 6.5%
- Percentage of people 3 years and older in grad. or professional schools:
Hellyer: 3.1% San Jose: 2.0%
- Percentage of students K-12 enrolled in private schools:
Hellyer: 16.8% San Jose: 14.9%
Percentage of population below poverty level:
| Hellyer: | 2.7% |
| San Jose: | 9.0% |
Median year owner moved in (as recorded in 2022):
Median year renter moved in (as recorded in 2022):
| Hellyer: | 2001 |
| San Jose: | 2008 |
Median year renter moved in (as recorded in 2022):
| Hellyer: | 2012 |
| San Jose: | 2020 |
Percentage of married-couple families with both working:
| Hellyer: | 71.5% |
| San Jose: | 72.5% |
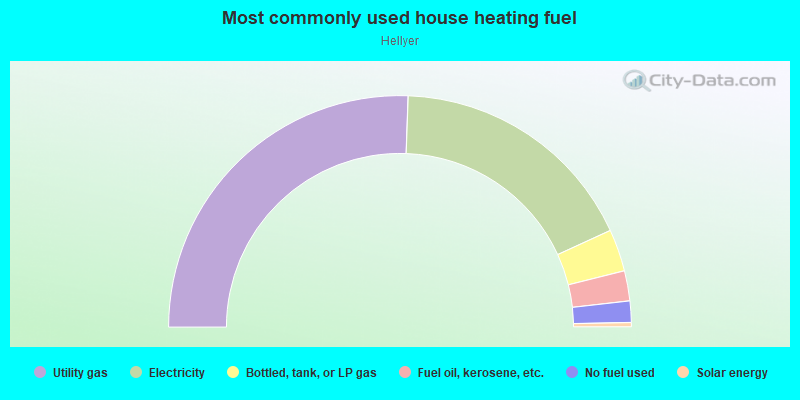
- 51.2%Utility gas
- 35.2%Electricity
- 5.9%Bottled, tank, or LP gas
- 4.2%Fuel oil, kerosene, etc.
- 3.0%No fuel used
- 0.6%Solar energy
Roads and streets:
Sylvandale Ave
Length: 0.39 miles
Direction: E-W
Address range: 623 to 999
Direction: E-W
Address range: 623 to 999
Ambler Way
Length: 0.32 miles
Directions: E-W, N-S, SE-NW
Address range: 3900 to 4159
Directions: E-W, N-S, SE-NW
Address range: 3900 to 4159
Faris Dr
Length: 0.22 miles
Direction: E-W
Address range: 900 to 999
Direction: E-W
Address range: 900 to 999
Burman Dr
Length: 0.21 miles
Direction: E-W
Address range: 900 to 999
Direction: E-W
Address range: 900 to 999
Park Johnson Pl
Length: 0.17 miles
Direction: E-W
Address range: 543 to 599
Direction: E-W
Address range: 543 to 599
Jana Ln
Length: 0.13 miles
Direction: E-W
Address range: 800 to 899
Direction: E-W
Address range: 800 to 899
Brock Way
Length: 0.12 miles
Directions: N-S, SW-NE
Address range: 4000 to 4099
Directions: N-S, SW-NE
Address range: 4000 to 4099
Nash Ct
Length: 0.09 miles
Direction: N-S
Address range: 3700 to 3899
Direction: N-S
Address range: 3700 to 3899
Leyte Ct
Length: 0.09 miles
Direction: E-W
Address range: 800 to 899
Direction: E-W
Address range: 800 to 899
Masters Ct
Length: 0.09 miles
Direction: N-S
Address range: 3700 to 3899
Direction: N-S
Address range: 3700 to 3899
Chilton Ct
Length: 0.08 miles
Directions: E-W, N-S, SE-NW
Address range: 3700 to 3899
Directions: E-W, N-S, SE-NW
Address range: 3700 to 3899
Palisade Dr
Length: 0.07 miles
Directions: N-S, SW-NE
Address range: 4200 to 4249
Directions: N-S, SW-NE
Address range: 4200 to 4249
Ambler Ct
Length: 0.06 miles
Direction: N-S
Address range: 3900 to 3999
Direction: N-S
Address range: 3900 to 3999
Oahu Dr
Length: 0.06 miles
Directions: E-W, SW-NE
Directions: E-W, SW-NE
Ashton Ln
Length: 0.05 miles
Direction: N-S
Address range: 3700 to 3817
Direction: N-S
Address range: 3700 to 3817
Park Charles Ct
Length: 0.04 miles
Direction: N-S
Address range: 3926 to 3999
Direction: N-S
Address range: 3926 to 3999
Honolulu Ct
Length: 0.04 miles
Direction: N-S
Address range: 3926 to 3999
Direction: N-S
Address range: 3926 to 3999
Maui Ct
Length: 0.04 miles
Directions: N-S, SW-NE
Address range: 3900 to 3999
Directions: N-S, SW-NE
Address range: 3900 to 3999
Trimar Ct
Length: 0.03 miles
Direction: N-S
Address range: 3900 to 3999
Direction: N-S
Address range: 3900 to 3999
Ashton Ct
Length: 0.03 miles
Directions: N-S, SW-NE
Address range: 3700 to 3899
Directions: N-S, SW-NE
Address range: 3700 to 3899
Maui Dr
Length: 0.02 miles
Direction: N-S
Direction: N-S