Hayward Park neighborhood in San Mateo, California (CA), 94401, 94402 detailed profile
Settings
X

Business Search - 14 Million verified businesses
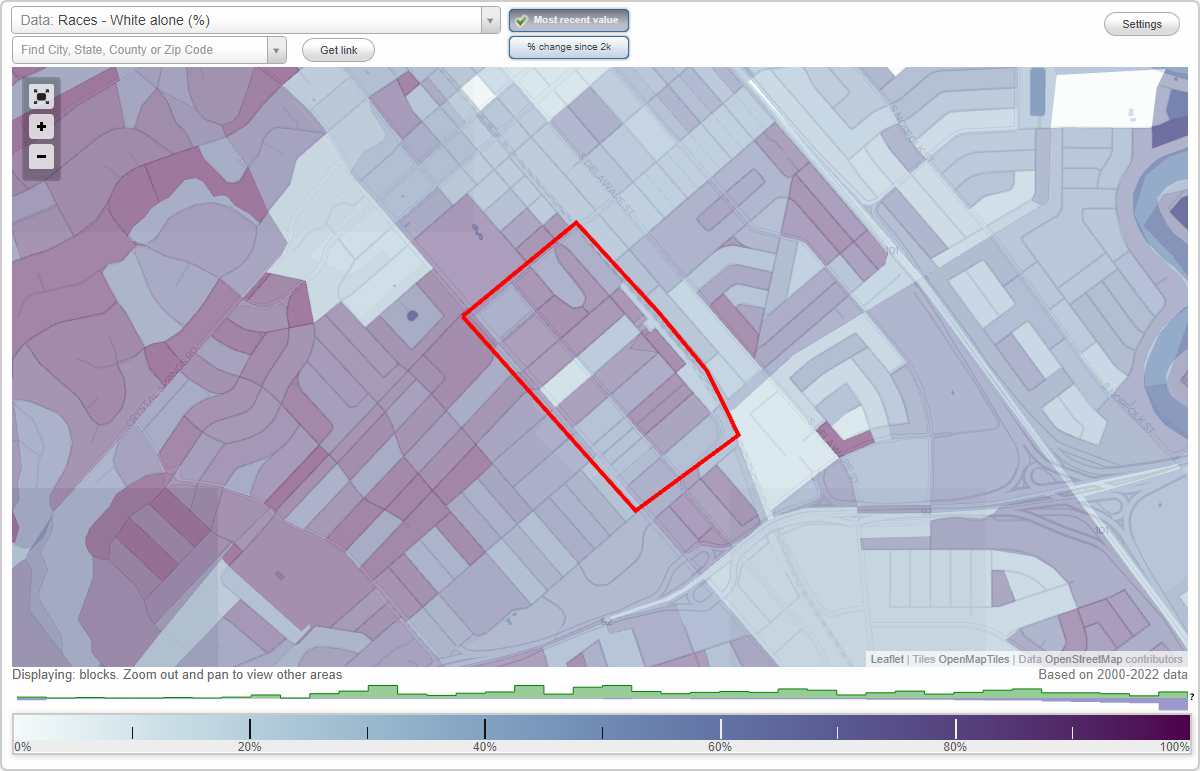
Area: 0.212 square miles
Population: 2,198
Population density:
| Hayward Park: | 10,366 people per square mile |
| San Mateo: | 8,266 people per square mile |

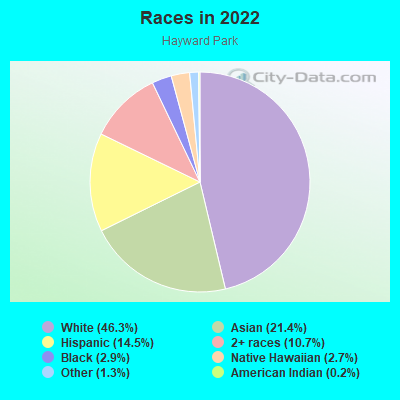
- 1,08446.3%White
- 50021.4%Asian
- 33914.5%Hispanic or Latino
- 25010.7%Two or more races
- 692.9%Black
- 622.7%Native Hawaiian and Other
Pacific Islander - 311.3%Some other race
- 40.2%American Indian
Median household income in 2022:
| Hayward Park: | $144,593 |
| San Mateo: | $159,275 |
Distribution of median household income
![Distribution of median household income]()
- 79Less than $10,000
- 148$10,000 to $19,999
- 175$20,000 to $29,999
- 35$30,000 to $39,999
- 84$40,000 to $49,999
- 123$50,000 to $59,999
- 72$60,000 to $74,999
- 47$75,000 to $99,999
- 38$100,000 to $124,999
- 50$125,000 to $149,999
- 99$150,000 to $199,999
- 413$200,000 or more

Distribution of owner-occupied house/condo value
![Distribution of owner-occupied house/condo value]()
- 7Less than $50,000
- 32$50,000 to $99,999
- 8$250,000 to $299,999
- 22$300,000 to $399,999
- 22$400,000 to $499,999
- 136$500,000 to $749,999
- 31$750,000 to $999,999
- 458$1,000,000 or more

Distribution of rent paid by renters
![Distribution of rent paid by renters]()
- 22$100 to $199
- 45$200 to $299
- 150$300 to $399
- 7$400 to $499
- 77$500 to $599
- 23$600 to $699
- 16$700 to $799
- 8$900 to $999
- 81$1,000 to $1,249
- 19$1,250 to $1,499
- 43$1,500 to $1,999
- 409$2,000 or more

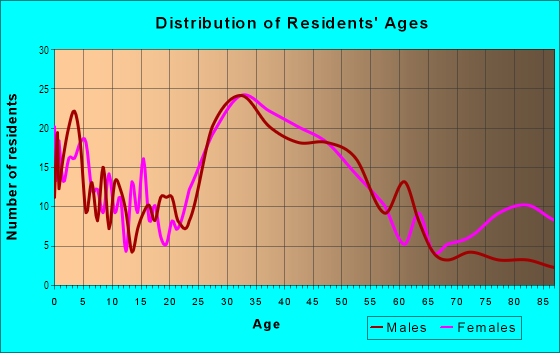
| Males: | 915 |
| Females: | 1,283 |
Males:
| This neighborhood: | 44.7 years |
| Whole city: | 37.8 years |
| This neighborhood: | 42.9 years |
| Whole city: | 40.5 years |
Average household size:
| Hayward Park: | 2.3 people |
| San Mateo: | 2.6 people |
Percentage of family households:
| Hayward Park: | 42.9% |
| San Mateo: | 41.3% |
| Here: | 46.2% |
| San Mateo: | 48.9% |
Percentage of married-couple families with children (among all households):
| Hayward Park: | 27.4% |
| San Mateo: | 29.2% |
Percentage of single-mother households (among all households):
| Hayward Park: | 13.3% |
| San Mateo: | 5.8% |
Percentage of never married males 15 years old and over:
Percentage of never married females 15 years old and over:
| Hayward Park: | 12.6% |
| San Mateo: | 18.2% |
Percentage of never married females 15 years old and over:
| Hayward Park: | 16.3% |
| city: | 17.0% |
Percentage of people that speak English not well or not at all:
| Hayward Park: | 2.7% |
| San Mateo: | 6.3% |
Percentage of people born in this state:
Percentage of people born in another U.S. state:
Percentage of native residents but born outside the U.S.:
Percentage of foreign born residents:
| Here: | 49.4% |
| San Mateo: | 48.0% |
Percentage of people born in another U.S. state:
| Hayward Park: | 18.2% |
| San Mateo: | 14.4% |
Percentage of native residents but born outside the U.S.:
| Here: | 1.4% |
| city: | 1.1% |
Percentage of foreign born residents:
| Here: | 31.0% |
| San Mateo: | 36.5% |
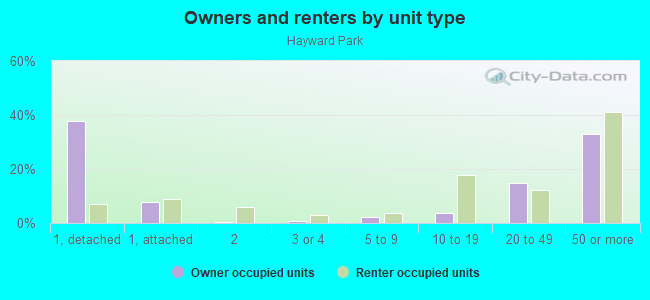
Owner-occupied
Renter-occupied

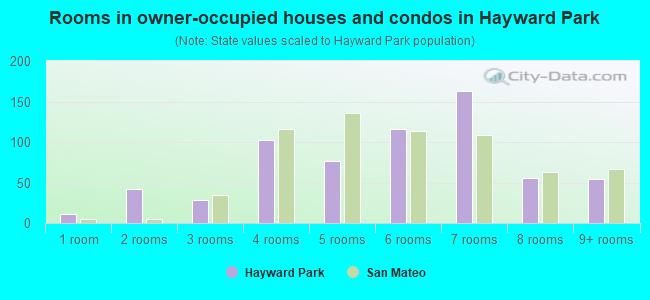
- Rooms in owner-occupied houses and condos in Hayward Park
- 111 room
- 422 rooms
- 283 rooms
- 1024 rooms
- 775 rooms
- 1166 rooms
- 1637 rooms
- 558 rooms
- 549+ rooms
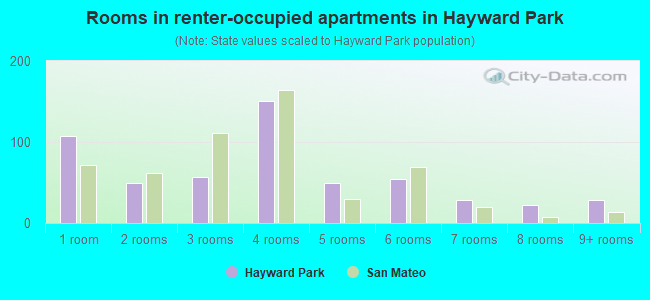
- Rooms in renter-occupied apartments in Hayward Park
- 1081 room
- 492 rooms
- 573 rooms
- 1504 rooms
- 505 rooms
- 546 rooms
- 287 rooms
- 228 rooms
- 299+ rooms
Owner-occupied
Renter-occupied
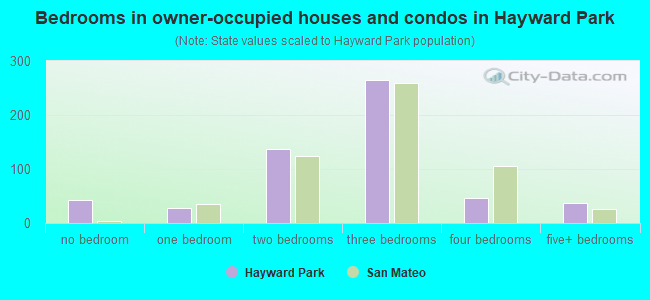
- Bedrooms in owner-occupied houses and condos in Hayward Park
- 42no bedroom
- 271 bedroom
- 1372 bedrooms
- 2643 bedrooms
- 474 bedrooms
- 375+ bedrooms
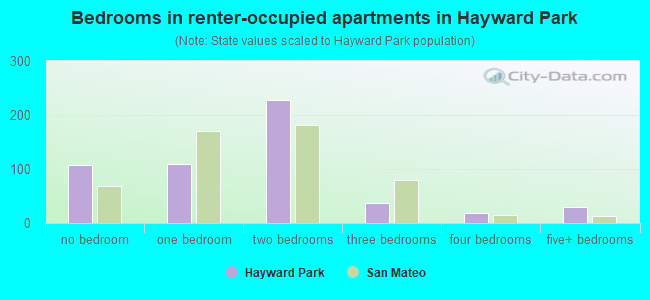
- Bedrooms in renter-occupied apartments in Hayward Park
- 108no bedroom
- 1091 bedroom
- 2272 bedrooms
- 373 bedrooms
- 184 bedrooms
- 295+ bedrooms
Average number of cars or other vehicles available in houses/condos:
Average number of cars or other vehicles available in apartments:
| This neighborhood: | 1.9 |
| San Mateo: | 2.0 |
Average number of cars or other vehicles available in apartments:
| Here: | 1.2 |
| city: | 1.4 |
Percentage of units with a mortgage:
| Hayward Park: | 69.9% |
| San Mateo: | 70.1% |
Housing prices:
- Average estimated value of detached houses in 2022 (40.0% of all units):
Hayward Park: $1,733,343 California: $988,808
- Average estimated '22 value of housing units in 5-or-more-unit structures (39.8% of all units):
Hayward Park: $40,529 California: $730,996
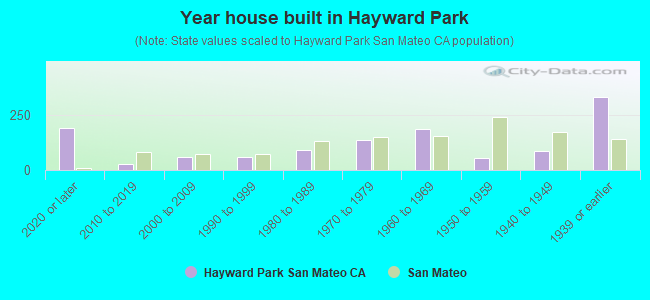
- Year house built in Hayward Park
- 1912020 or later
- 282010 to 2019
- 612000 to 2009
- 571990 to 1999
- 911980 to 1989
- 1371970 to 1979
- 1841960 to 1969
- 561950 to 1959
- 851940 to 1949
- 3291939 or earlier
City-data.com crime index for city in 2020 (higher means more crime):
| City: | 202.6 |
| U.S. average: | 219.5 |
Travel time to work (commute)
![Travel time to work (commute)]()
- 9Less than 5 minutes
- 835 to 9 minutes
- 10310 to 14 minutes
- 8115 to 19 minutes
- 14620 to 24 minutes
- 4725 to 29 minutes
- 10430 to 34 minutes
- 2735 to 39 minutes
- 7240 to 44 minutes
- 14945 to 59 minutes
- 13560 to 89 minutes
- 5090 or more minutes

Means of transportation to work
![Means of transportation to work]()
- 61.6%639Drove a car alone
- 2.7%28Carpooled
- 5.3%55Bus
- 2.9%30Subway or elevated rail
- 5.5%57Long-distance train or commuter rail
- 1.7%18Motorcycle
- 6.3%65Bicycle
- 7.6%79Walked
- 2.5%26Other means
- 21.4%222Worked at home

Time leaving home to go to work
![Time leaving home to go to work]()
- 1812:00 a.m. to 4:59 a.m.
- 345:00 a.m. to 5:29 a.m.
- 205:30 a.m. to 5:59 a.m.
- 526:00 a.m. to 6:29 a.m.
- 496:30 a.m. to 6:59 a.m.
- 1167:00 a.m. to 7:29 a.m.
- 1947:30 a.m. to 7:59 a.m.
- 1728:00 a.m. to 8:29 a.m.
- 1888:30 a.m. to 8:59 a.m.
- 1499:00 a.m. to 9:59 a.m.
- 3010:00 a.m. to 10:59 a.m.
- 1411:00 a.m. to 11:59 a.m.
- 2412:00 p.m. to 3:59 p.m.
- 164:00 p.m. to 11:59 p.m.

Occupations of males:
- Percentage of males in management occupations (except farmers):
Here: 15.4% city: 17.3%
- Percentage of males in business and financial operations occupations:
Here: 6.9% city: 5.6%
- Percentage of males in computer and mathematical occupations:
Here: 12.6% city: 15.5%
- Percentage of males in architecture and engineering occupations:
Here: 15.5% city: 4.6%
- Percentage of males in life, physical, and social science occupations:
Here: 10.2% city: 2.6%
- Percentage of males in education, training, and library occupations:
Here: 2.1% city: 3.1%
- Percentage of males in arts, design, entertainment, sports, and media occupations:
Here: 6.1% city: 2.2%
- Percentage of males in healthcare practitioners and technical occupations:
Here: 2.2% city: 3.6%
- Percentage of males in service occupations:
Here: 1.3% city: 11.1%
- Percentage of males in sales and office occupations:
Here: 14.6% city: 12.6%
- Percentage of males in construction, extraction, and maintenance occupations:
Here: 4.2% city: 6.3%
Occupations of females:
- Percentage of females in management occupations (except farmers):
Here: 22.6% city: 15.9%
- Percentage of females in business and financial operations occupations:
Here: 20.0% city: 11.0%
- Percentage of females in computer and mathematical occupations:
Here: 7.3% city: 6.6%
- Percentage of females in architecture and engineering occupations:
Here: 2.8% city: 1.6%
- Percentage of females in life, physical, and social science occupations:
Here: 2.2% city: 3.9%
- Percentage of females in education, training, and library occupations:
Here: 6.4% city: 6.9%
- Percentage of females in arts, design, entertainment, sports, and media occupations:
Here: 2.8% city: 3.2%
- Percentage of females in healthcare practitioners and technical occupations:
Here: 2.5% city: 8.3%
- Percentage of females in service occupations:
Here: 7.4% city: 16.0%
- Percentage of females in sales and office occupations:
Here: 24.8% city: 19.6%
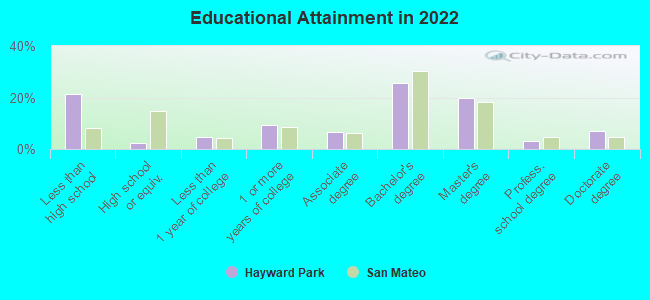
Education in this neighborhood (subdivision or community):
- Percentage of people 3 years and older in K-12 schools:
Hayward Park: 20.1% San Mateo: 15.7%
- Percentage of people 3 years and older in undergraduate colleges:
Hayward Park: 5.3% San Mateo: 4.9%
- Percentage of people 3 years and older in grad. or professional schools:
Hayward Park: 4.2% San Mateo: 1.2%
- Percentage of students K-12 enrolled in private schools:
Hayward Park: 47.2% San Mateo: 18.6%
Percentage of population below poverty level:
| Hayward Park: | 5.2% |
| San Mateo: | 8.3% |
Median year owner moved in (as recorded in 2022):
| Hayward Park: | 2006 |
| San Mateo: | 2009 |
Percentage of married-couple families with both working:
| Hayward Park: | 84.1% |
| San Mateo: | 66.4% |
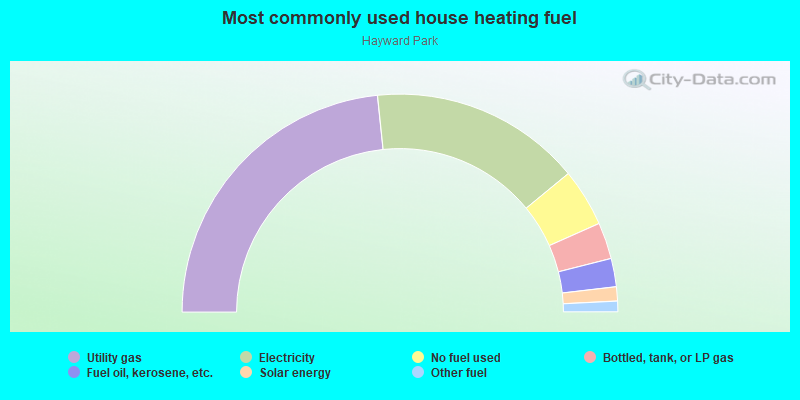
- 46.7%Utility gas
- 31.4%Electricity
- 8.6%No fuel used
- 5.4%Bottled, tank, or LP gas
- 4.2%Fuel oil, kerosene, etc.
- 2.1%Solar energy
- 1.6%Other fuel
Highways in this neighborhood:
State Hwy 82 (S el Camino Real)
Length: 0.67 miles
Direction: SE-NW
Address range: 900 to 1699
Direction: SE-NW
Address range: 900 to 1699
Roads and streets:
Palm Ave
Length: 0.77 miles
Directions: SE-NW, SW-NE
Address range: 900 to 1665
Directions: SE-NW, SW-NE
Address range: 900 to 1665
S B St
Length: 0.69 miles
Directions: SE-NW, SW-NE
Address range: 900 to 1599
Directions: SE-NW, SW-NE
Address range: 900 to 1599
9th Ave
Length: 0.37 miles
Direction: SW-NE
Address range: 1 to 445
Direction: SW-NE
Address range: 1 to 445
10th Ave
Length: 0.35 miles
Direction: SW-NE
Address range: 1 to 299
Direction: SW-NE
Address range: 1 to 299
14th Ave
Length: 0.34 miles
Direction: SW-NE
Address range: 1 to 222
Direction: SW-NE
Address range: 1 to 222
16th Ave
Length: 0.33 miles
Direction: SW-NE
Address range: 1 to 199
Direction: SW-NE
Address range: 1 to 199
12th Ave
Length: 0.33 miles
Direction: SW-NE
Address range: 1 to 222
Direction: SW-NE
Address range: 1 to 222
15th Ave
Length: 0.31 miles
Direction: SW-NE
Address range: 1 to 199
Direction: SW-NE
Address range: 1 to 199
13th Ave
Length: 0.31 miles
Direction: SW-NE
Address range: 1 to 199
Direction: SW-NE
Address range: 1 to 199
11th Ave
Length: 0.31 miles
Direction: SW-NE
Address range: 1 to 199
Direction: SW-NE
Address range: 1 to 199
Railroad Ave
Length: 0.25 miles
Directions: SE-NW, SW-NE
Address range: 1000 to 1399
Directions: SE-NW, SW-NE
Address range: 1000 to 1399
South Blvd
Length: 0.22 miles
Directions: N-S, SE-NW, SW-NE
Address range: 100 to 199
Directions: N-S, SE-NW, SW-NE
Address range: 100 to 199
Rosewood Dr
Length: 0.21 miles
Directions: N-S, SE-NW, SW-NE
Address range: 900 to 999
Directions: N-S, SE-NW, SW-NE
Address range: 900 to 999
Hayward Ave
Length: 0.20 miles
Direction: SW-NE
Address range: 1 to 199
Direction: SW-NE
Address range: 1 to 199
Laurel Ave
Length: 0.19 miles
Directions: E-W, SE-NW, SW-NE
Address range: 900 to 999
Directions: E-W, SE-NW, SW-NE
Address range: 900 to 999
S Railroad Ave
Length: 0.05 miles
Directions: SE-NW, SW-NE
Directions: SE-NW, SW-NE
Hanrahan Ct
Length: 0.04 miles
Direction: SW-NE
Address range: 200 to 222
Direction: SW-NE
Address range: 200 to 222
Railroad features:
Joint Powers Authority RR (Union Pacific RR)
Length: 0.62 miles
Direction: SE-NW
Direction: SE-NW
Caltrain
Length: 0.14 miles
Direction: SE-NW
Direction: SE-NW