Hathaway neighborhood in San Jose, California (CA), 95130 detailed profile
Settings
X

Business Search - 14 Million verified businesses
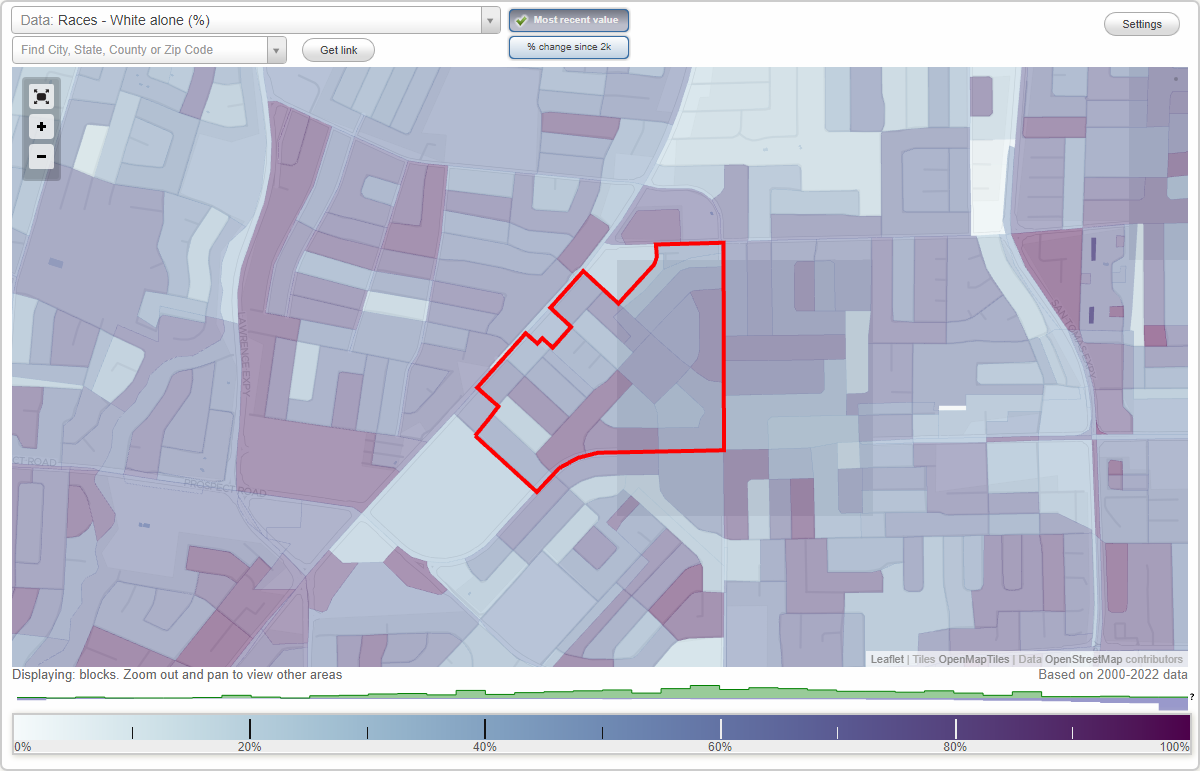
Area: 0.220 square miles
Population: 1,396
Population density:
| Hathaway: | 6,355 people per square mile |
| San Jose: | 5,554 people per square mile |

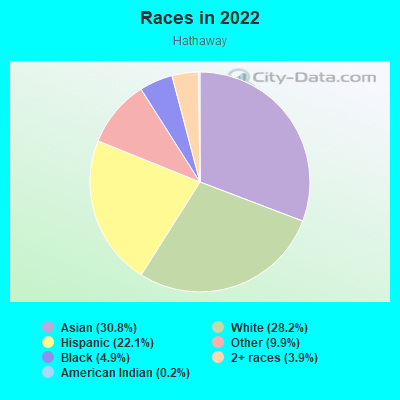
- 49430.8%Asian
- 45328.2%White
- 35422.1%Hispanic or Latino
- 1599.9%Some other race
- 784.9%Black
- 623.9%Two or more races
- 40.2%American Indian
Median household income in 2022:
| Hathaway: | $125,733 |
| San Jose: | $133,835 |
Distribution of median household income
![Distribution of median household income]()
- 8Less than $10,000
- 48$10,000 to $19,999
- 39$20,000 to $29,999
- 39$30,000 to $39,999
- 46$40,000 to $49,999
- 9$50,000 to $59,999
- 65$60,000 to $74,999
- 90$75,000 to $99,999
- 28$100,000 to $124,999
- 26$125,000 to $149,999
- 52$150,000 to $199,999
- 182$200,000 or more

Distribution of owner-occupied house/condo value
![Distribution of owner-occupied house/condo value]()
- 7Less than $50,000
- 7$100,000 to $149,999
- 4$150,000 to $199,999
- 7$200,000 to $249,999
- 9$300,000 to $399,999
- 7$500,000 to $749,999
- 22$750,000 to $999,999
- 190$1,000,000 or more

Distribution of rent paid by renters
![Distribution of rent paid by renters]()
- 5$300 to $399
- 39$1,000 to $1,249
- 24$1,250 to $1,499
- 84$1,500 to $1,999
- 168$2,000 or more

Median rent in 2022:
| Hathaway: | $2,093 |
| San Jose: | $2,001 |
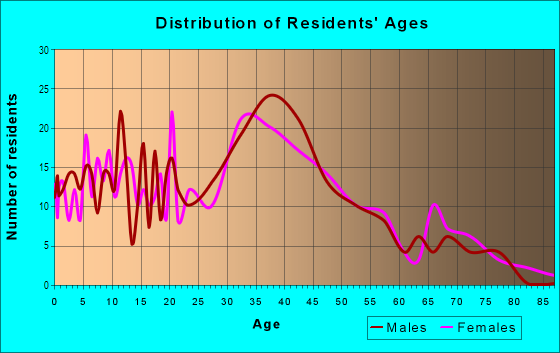
| Males: | 700 |
| Females: | 695 |
Males:
| This neighborhood: | 41.0 years |
| Whole city: | 37.6 years |
| This neighborhood: | 38.6 years |
| Whole city: | 39.1 years |
Average household size:
| Hathaway: | 2.8 people |
| San Jose: | 2.9 people |
Percentage of family households:
| Hathaway: | 49.1% |
| San Jose: | 49.9% |
| Here: | 47.8% |
| San Jose: | 53.0% |
Percentage of married-couple families with children (among all households):
| Hathaway: | 26.3% |
| San Jose: | 25.8% |
Percentage of single-mother households (among all households):
| Hathaway: | 9.7% |
| San Jose: | 5.2% |
Percentage of never married males 15 years old and over:
Percentage of never married females 15 years old and over:
| Hathaway: | 19.5% |
| San Jose: | 20.9% |
Percentage of never married females 15 years old and over:
| Hathaway: | 16.6% |
| city: | 16.7% |
Percentage of people that speak English not well or not at all:
| Hathaway: | 4.8% |
| San Jose: | 11.4% |
Percentage of people born in this state:
Percentage of people born in another U.S. state:
Percentage of native residents but born outside the U.S.:
Percentage of foreign born residents:
| Here: | 45.7% |
| San Jose: | 46.1% |
Percentage of people born in another U.S. state:
| Hathaway: | 12.2% |
| San Jose: | 10.4% |
Percentage of native residents but born outside the U.S.:
| Here: | 0.4% |
| city: | 1.7% |
Percentage of foreign born residents:
| Here: | 41.7% |
| San Jose: | 41.8% |
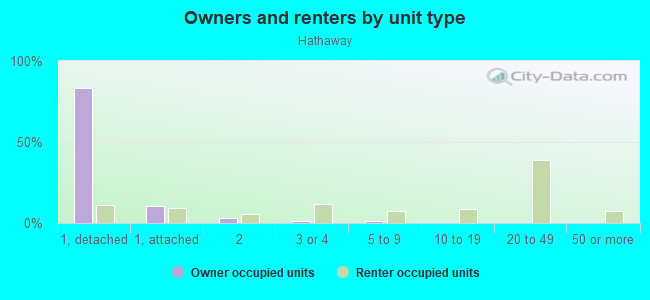
Owner-occupied
Renter-occupied

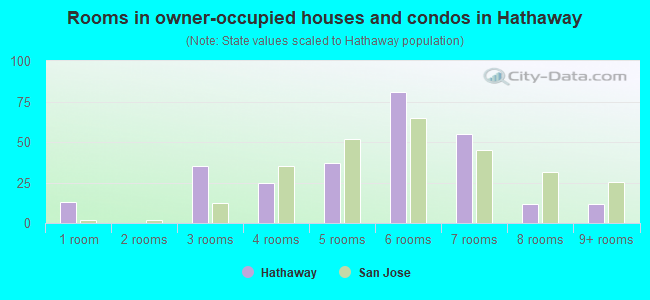
- Rooms in owner-occupied houses and condos in Hathaway
- 131 room
- 02 rooms
- 353 rooms
- 254 rooms
- 375 rooms
- 816 rooms
- 557 rooms
- 128 rooms
- 129+ rooms
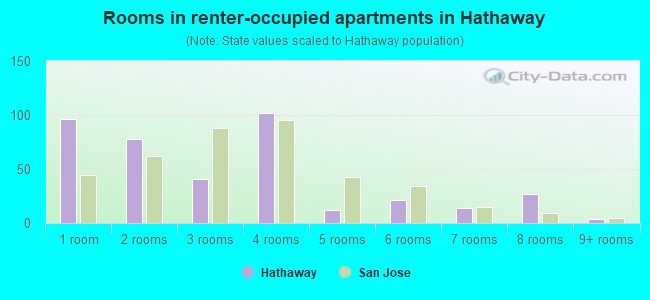
- Rooms in renter-occupied apartments in Hathaway
- 961 room
- 782 rooms
- 413 rooms
- 1024 rooms
- 125 rooms
- 216 rooms
- 147 rooms
- 278 rooms
- 49+ rooms
Owner-occupied
Renter-occupied
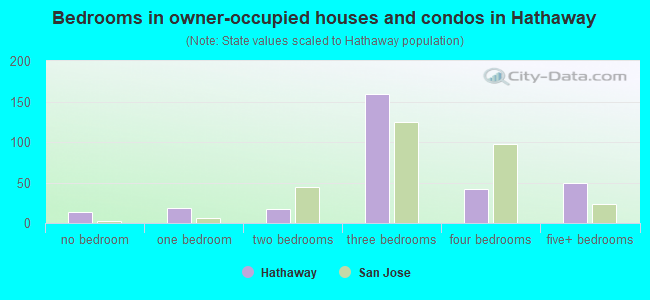
- Bedrooms in owner-occupied houses and condos in Hathaway
- 13no bedroom
- 181 bedroom
- 172 bedrooms
- 1593 bedrooms
- 424 bedrooms
- 505+ bedrooms
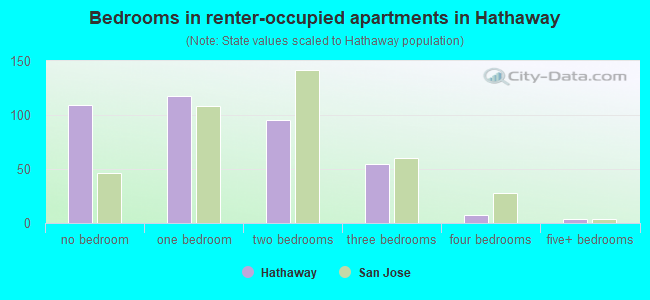
- Bedrooms in renter-occupied apartments in Hathaway
- 109no bedroom
- 1181 bedroom
- 952 bedrooms
- 553 bedrooms
- 74 bedrooms
- 45+ bedrooms
Average number of cars or other vehicles available in houses/condos:
Average number of cars or other vehicles available in apartments:
| This neighborhood: | 2.1 |
| San Jose: | 2.3 |
Average number of cars or other vehicles available in apartments:
| Here: | 1.8 |
| city: | 1.6 |
Percentage of units with a mortgage:
| Hathaway: | 64.6% |
| San Jose: | 66.9% |
Average estimated value of detached houses in 2022 (47.4% of all units):
| Hathaway: | $1,907,548 |
| San Jose: | $1,532,815 |
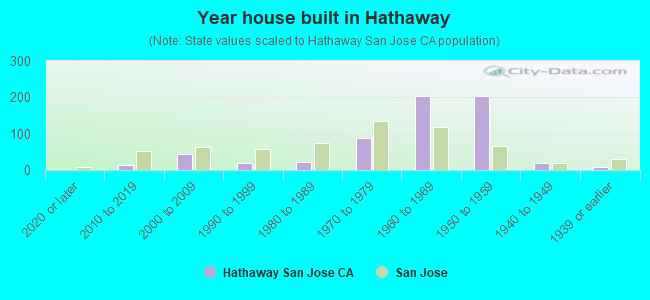
- Year house built in Hathaway
- 02020 or later
- 142010 to 2019
- 452000 to 2009
- 191990 to 1999
- 221980 to 1989
- 871970 to 1979
- 2031960 to 1969
- 2051950 to 1959
- 201940 to 1949
- 81939 or earlier
City-data.com crime index for city in 2020 (higher means more crime):
| City: | 268.4 |
| U.S. average: | 219.5 |
Travel time to work (commute)
![Travel time to work (commute)]()
- 19Less than 5 minutes
- 355 to 9 minutes
- 12010 to 14 minutes
- 14015 to 19 minutes
- 12820 to 24 minutes
- 1825 to 29 minutes
- 10730 to 34 minutes
- 2035 to 39 minutes
- 740 to 44 minutes
- 5445 to 59 minutes
- 1760 to 89 minutes
- 690 or more minutes

Means of transportation to work
![Means of transportation to work]()
- 74.4%581Drove a car alone
- 4.9%38Carpooled
- 1.4%11Bus
- 1.5%12Subway or elevated rail
- 1.8%14Long-distance train or commuter rail
- 0.6%5Taxi
- 0.9%7Motorcycle
- 0.4%3Bicycle
- 2.8%22Walked
- 0.8%6Other means
- 14.7%115Worked at home

Time leaving home to go to work
![Time leaving home to go to work]()
- 2812:00 a.m. to 4:59 a.m.
- 145:00 a.m. to 5:29 a.m.
- 165:30 a.m. to 5:59 a.m.
- 166:00 a.m. to 6:29 a.m.
- 676:30 a.m. to 6:59 a.m.
- 647:00 a.m. to 7:29 a.m.
- 697:30 a.m. to 7:59 a.m.
- 1258:00 a.m. to 8:29 a.m.
- 548:30 a.m. to 8:59 a.m.
- 1299:00 a.m. to 9:59 a.m.
- 5010:00 a.m. to 10:59 a.m.
- 611:00 a.m. to 11:59 a.m.
- 3412:00 p.m. to 3:59 p.m.
- 74:00 p.m. to 11:59 p.m.

Occupations of males:
- Percentage of males in management occupations (except farmers):
Here: 11.9% city: 13.0%
- Percentage of males in business and financial operations occupations:
Here: 5.9% city: 4.6%
- Percentage of males in computer and mathematical occupations:
Here: 12.2% city: 13.6%
- Percentage of males in architecture and engineering occupations:
Here: 9.7% city: 10.2%
- Percentage of males in education, training, and library occupations:
Here: 3.7% city: 2.8%
- Percentage of males in arts, design, entertainment, sports, and media occupations:
Here: 1.1% city: 1.8%
- Percentage of males in healthcare practitioners and technical occupations:
Here: 2.8% city: 2.0%
- Percentage of males in service occupations:
Here: 11.1% city: 12.7%
- Percentage of males in sales and office occupations:
Here: 17.1% city: 12.8%
- Percentage of males in construction, extraction, and maintenance occupations:
Here: 6.6% city: 7.8%
- Percentage of males in production occupations:
Here: 6.0% city: 5.5%
- Percentage of males in transportation occupations:
Here: 5.7% city: 3.6%
- Percentage of males in material moving occupations:
Here: 1.8% city: 3.1%
Occupations of females:
- Percentage of females in management occupations (except farmers):
Here: 15.3% city: 11.0%
- Percentage of females in business and financial operations occupations:
Here: 10.9% city: 8.6%
- Percentage of females in computer and mathematical occupations:
Here: 1.6% city: 5.4%
- Percentage of females in architecture and engineering occupations:
Here: 2.8% city: 2.8%
- Percentage of females in community and social services occupations:
Here: 1.7% city: 1.8%
- Percentage of females in education, training, and library occupations:
Here: 7.7% city: 8.1%
- Percentage of females in arts, design, entertainment, sports, and media occupations:
Here: 4.0% city: 2.0%
- Percentage of females in healthcare practitioners and technical occupations:
Here: 2.7% city: 6.8%
- Percentage of females in service occupations:
Here: 20.2% city: 21.7%
- Percentage of females in sales and office occupations:
Here: 27.2% city: 22.0%
- Percentage of females in production occupations:
Here: 3.3% city: 4.0%
- Percentage of females in material moving occupations:
Here: 2.6% city: 1.5%
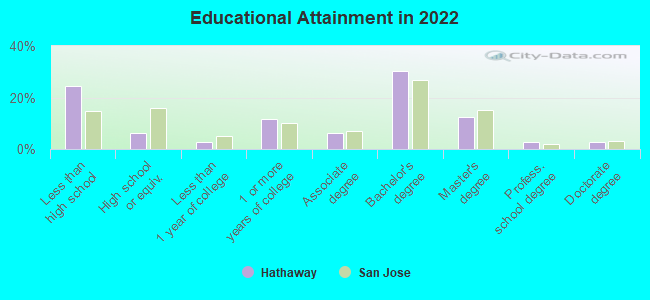
Education in this neighborhood (subdivision or community):
- Percentage of people 3 years and older in K-12 schools:
Hathaway: 16.3% San Jose: 16.1%
- Percentage of people 3 years and older in undergraduate colleges:
Hathaway: 6.3% San Jose: 6.5%
- Percentage of people 3 years and older in grad. or professional schools:
Hathaway: 3.1% San Jose: 2.0%
- Percentage of students K-12 enrolled in private schools:
Hathaway: 23.1% San Jose: 14.9%
Percentage of population below poverty level:
| Hathaway: | 3.2% |
| San Jose: | 9.0% |
Median year owner moved in (as recorded in 2022):
Median year renter moved in (as recorded in 2022):
| Hathaway: | 2003 |
| San Jose: | 2008 |
Median year renter moved in (as recorded in 2022):
| Hathaway: | 2015 |
| San Jose: | 2020 |
Percentage of married-couple families with both working:
| Hathaway: | 64.8% |
| San Jose: | 72.5% |

- 57.5%Utility gas
- 34.9%Electricity
- 2.8%Bottled, tank, or LP gas
- 2.8%No fuel used
- 1.2%Solar energy
- 0.8%Wood
Roads and streets:
Vallejo Dr
Length: 0.69 miles
Directions: E-W, SW-NE
Address range: 1300 to 17999
Directions: E-W, SW-NE
Address range: 1300 to 17999
Hamilton Ave
Length: 0.58 miles
Directions: E-W, SW-NE
Address range: 4200 to 4689
Directions: E-W, SW-NE
Address range: 4200 to 4689
San Tomas Aquino Rd
Length: 0.43 miles
Direction: N-S
Address range: 1329 to 1599
Direction: N-S
Address range: 1329 to 1599
Colombo Dr
Length: 0.42 miles
Directions: E-W, SE-NW
Address range: 4200 to 17799
Directions: E-W, SE-NW
Address range: 4200 to 17799
Latimer Ave
Length: 0.36 miles
Directions: N-S, SE-NW
Address range: 4347 to 4549
Directions: N-S, SE-NW
Address range: 4347 to 4549
Lamore Dr
Length: 0.33 miles
Directions: N-S, SE-NW, SW-NE
Address range: 1400 to 1599
Directions: N-S, SE-NW, SW-NE
Address range: 1400 to 1599
McKinnon Dr
Length: 0.33 miles
Directions: N-S, SE-NW, SW-NE
Address range: 4200 to 17729
Directions: N-S, SE-NW, SW-NE
Address range: 4200 to 17729
Garrans Dr
Length: 0.30 miles
Directions: E-W, SW-NE
Address range: 1300 to 1399
Directions: E-W, SW-NE
Address range: 1300 to 1399
Hilton Ave
Length: 0.30 miles
Directions: E-W, SE-NW
Address range: 4200 to 4499
Directions: E-W, SE-NW
Address range: 4200 to 4499
Parkview Ave
Length: 0.23 miles
Directions: N-S, SW-NE
Address range: 1500 to 1599
Directions: N-S, SW-NE
Address range: 1500 to 1599
Southwood Dr
Length: 0.21 miles
Direction: SW-NE
Address range: 11600 to 11838
Direction: SW-NE
Address range: 11600 to 11838
Los Olivos Dr
Length: 0.16 miles
Direction: SE-NW
Address range: 17900 to 17999
Direction: SE-NW
Address range: 17900 to 17999
Los Felice Dr
Length: 0.16 miles
Direction: SE-NW
Address range: 17800 to 17956
Direction: SE-NW
Address range: 17800 to 17956
Los Alamos Dr
Length: 0.16 miles
Direction: SE-NW
Address range: 17800 to 17999
Direction: SE-NW
Address range: 17800 to 17999
Parkwest Dr
Length: 0.07 miles
Direction: SE-NW
Address range: 4650 to 4699
Direction: SE-NW
Address range: 4650 to 4699
Bayne Pl
Length: 0.05 miles
Direction: E-W
Address range: 4300 to 4399
Direction: E-W
Address range: 4300 to 4399
Bongate Ct
Length: 0.05 miles
Direction: SW-NE
Address range: 1400 to 1499
Direction: SW-NE
Address range: 1400 to 1499
Sunland Ct
Length: 0.05 miles
Direction: SW-NE
Address range: 1400 to 1499
Direction: SW-NE
Address range: 1400 to 1499
McKinnon Ct
Length: 0.03 miles
Direction: SW-NE
Address range: 1500 to 1599
Direction: SW-NE
Address range: 1500 to 1599
Hilton Ct
Length: 0.03 miles
Direction: N-S
Address range: 1500 to 1599
Direction: N-S
Address range: 1500 to 1599