Harlem neighborhood in Kansas City, Missouri (MO), 64116 detailed profile
Settings
X

Business Search - 14 Million verified businesses
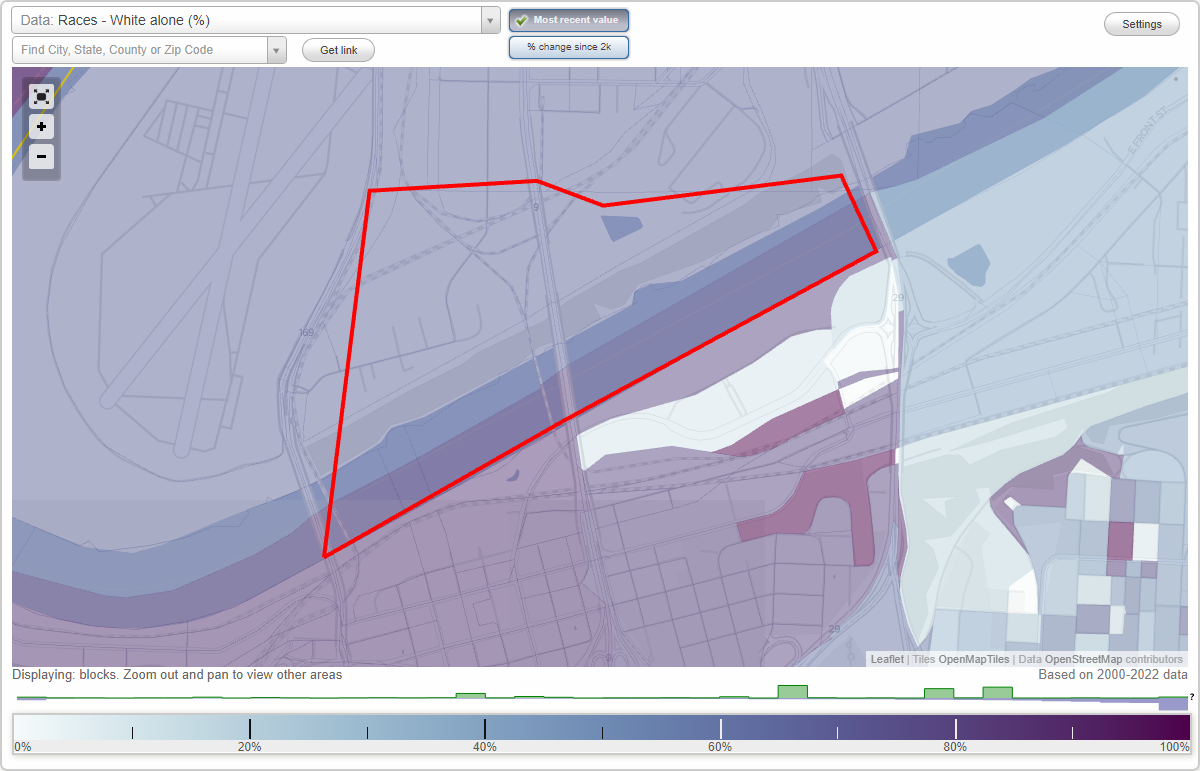
Area: 0.574 square miles
Population: 1,161
Population density:
| Harlem: | 2,024 people per square mile |
| Kansas City: | 1,624 people per square mile |

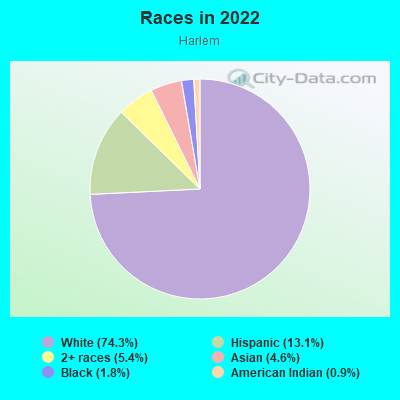
- 91074.3%White
- 16013.1%Hispanic or Latino
- 665.4%Two or more races
- 564.6%Asian
- 221.8%Black
- 110.9%American Indian
Median household income in 2022:
| Harlem: | $63,750 |
| Kansas City: | $62,175 |
Distribution of median household income
![Distribution of median household income]()
- 21Less than $10,000
- 87$10,000 to $19,999
- 56$20,000 to $29,999
- 81$30,000 to $39,999
- 53$40,000 to $49,999
- 15$50,000 to $59,999
- 128$60,000 to $74,999
- 43$75,000 to $99,999
- 37$100,000 to $124,999
- 78$125,000 to $149,999
- 30$150,000 to $199,999
- 37$200,000 or more

Distribution of owner-occupied house/condo value
![Distribution of owner-occupied house/condo value]()
- 11Less than $50,000
- 11$50,000 to $99,999
- 12$100,000 to $149,999
- 44$150,000 to $199,999
- 72$200,000 to $249,999
- 20$250,000 to $299,999
- 39$300,000 to $399,999
- 20$400,000 to $499,999
- 13$500,000 to $749,999

Distribution of rent paid by renters
![Distribution of rent paid by renters]()
- 36$100 to $199
- 42$200 to $299
- 70$300 to $399
- 12$400 to $499
- 24$500 to $599
- 11$600 to $699
- 18$700 to $799
- 51$800 to $899
- 22$900 to $999
- 40$1,000 to $1,249
- 70$1,250 to $1,499
- 89$1,500 to $1,999
- 17$2,000 or more

Median rent in 2022:
| Harlem: | $950 |
| Kansas City: | $959 |
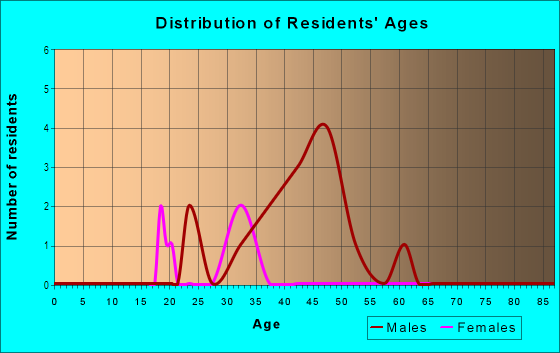
| Males: | 531 |
| Females: | 629 |
Males:
| This neighborhood: | 39.3 years |
| Whole city: | 35.3 years |
| This neighborhood: | 38.1 years |
| Whole city: | 36.6 years |
Average household size:
| Harlem: | 1.8 people |
| Kansas City: | 2.2 people |
Percentage of family households:
| Harlem: | 32.2% |
| Kansas City: | 37.9% |
| Here: | 24.6% |
| Kansas City: | 35.0% |
Percentage of married-couple families with children (among all households):
| Harlem: | 10.5% |
| Kansas City: | 26.7% |
Percentage of single-mother households (among all households):
| Harlem: | 45.0% |
| Kansas City: | 14.3% |
Percentage of never married males 15 years old and over:
Percentage of never married females 15 years old and over:
| Harlem: | 25.1% |
| Kansas City: | 20.0% |
Percentage of never married females 15 years old and over:
| Harlem: | 27.7% |
| city: | 20.0% |
Percentage of people that speak English not well or not at all:
| Harlem: | 7.4% |
| Kansas City: | 2.5% |
Percentage of people born in this state:
Percentage of people born in another U.S. state:
Percentage of native residents but born outside the U.S.:
Percentage of foreign born residents:
| Here: | 48.7% |
| Kansas City: | 53.2% |
Percentage of people born in another U.S. state:
| Harlem: | 33.6% |
| Kansas City: | 38.2% |
Percentage of native residents but born outside the U.S.:
| Here: | 0.7% |
| city: | 1.0% |
Percentage of foreign born residents:
| Here: | 17.0% |
| Kansas City: | 7.6% |
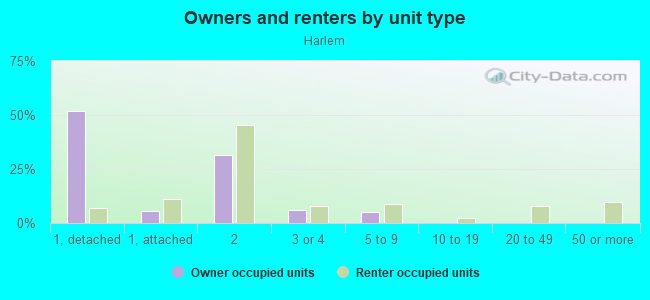
Owner-occupied
Renter-occupied

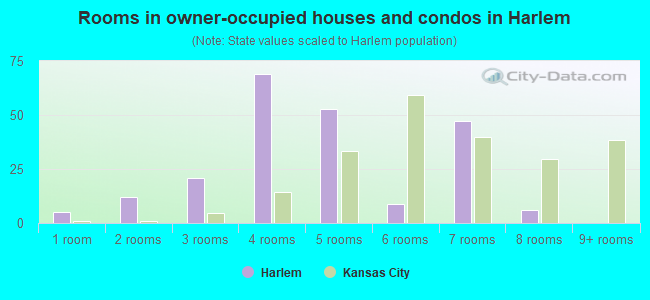
- Rooms in owner-occupied houses and condos in Harlem
- 51 room
- 122 rooms
- 213 rooms
- 694 rooms
- 535 rooms
- 96 rooms
- 477 rooms
- 68 rooms
- 09+ rooms
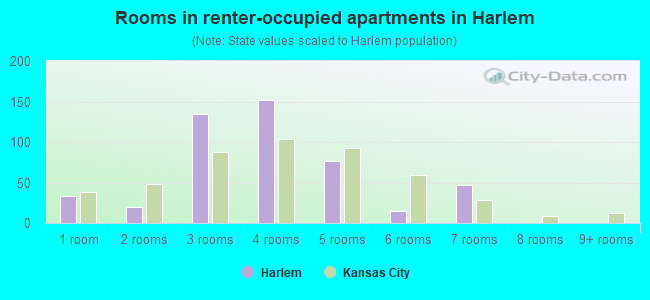
- Rooms in renter-occupied apartments in Harlem
- 331 room
- 202 rooms
- 1343 rooms
- 1524 rooms
- 775 rooms
- 156 rooms
- 477 rooms
- 08 rooms
- 09+ rooms
Owner-occupied
Renter-occupied
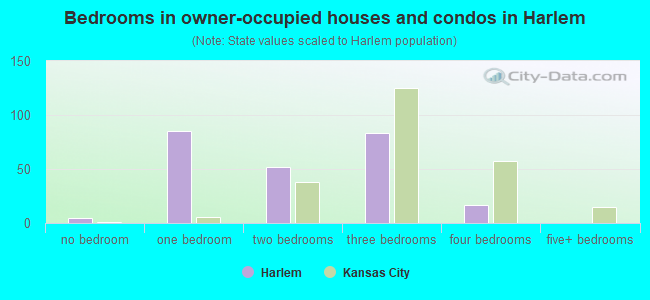
- Bedrooms in owner-occupied houses and condos in Harlem
- 5no bedroom
- 851 bedroom
- 522 bedrooms
- 833 bedrooms
- 174 bedrooms
- 05+ bedrooms
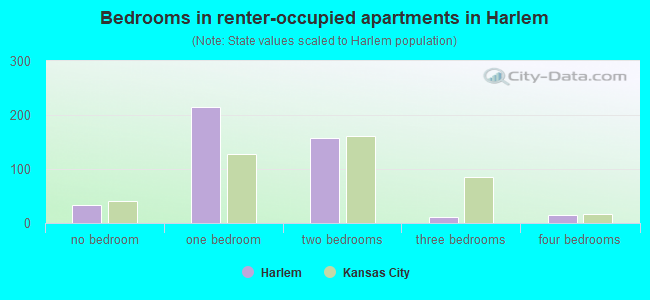
- Bedrooms in renter-occupied apartments in Harlem
- 33no bedroom
- 2151 bedroom
- 1582 bedrooms
- 113 bedrooms
- 154 bedrooms
- 05+ bedrooms
Average number of cars or other vehicles available in houses/condos:
Average number of cars or other vehicles available in apartments:
| This neighborhood: | 1.4 |
| Kansas City: | 1.9 |
Average number of cars or other vehicles available in apartments:
| Here: | 1.0 |
| city: | 1.2 |
Percentage of units with a mortgage:
| Harlem: | 84.9% |
| Kansas City: | 62.2% |
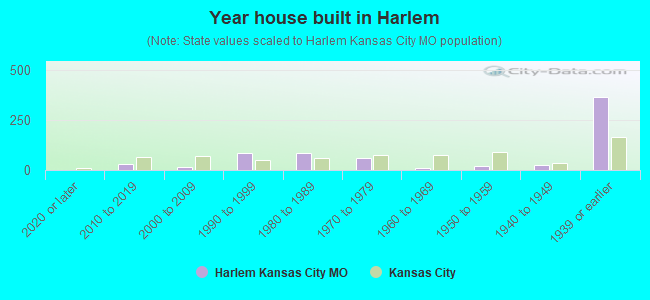
- Year house built in Harlem
- 02020 or later
- 312010 to 2019
- 132000 to 2009
- 871990 to 1999
- 871980 to 1989
- 611970 to 1979
- 121960 to 1969
- 201950 to 1959
- 231940 to 1949
- 3631939 or earlier
City-data.com crime index for city in 2020 (higher means more crime):
| City: | 671.9 |
| U.S. average: | 219.5 |
Travel time to work (commute)
![Travel time to work (commute)]()
- 52Less than 5 minutes
- 1635 to 9 minutes
- 19010 to 14 minutes
- 19215 to 19 minutes
- 22920 to 24 minutes
- 1025 to 29 minutes
- 10530 to 34 minutes
- 2135 to 39 minutes
- 1340 to 44 minutes
- 2245 to 59 minutes

Means of transportation to work
![Means of transportation to work]()
- 63.2%488Drove a car alone
- 3.8%29Carpooled
- 1.7%13Bus
- 1.4%11Light rail, streetcar or trolley
- 0.3%2Motorcycle
- 1.2%9Bicycle
- 7.9%61Walked
- 2.8%22Other means
- 18.9%146Worked at home

Time leaving home to go to work
![Time leaving home to go to work]()
- 1612:00 a.m. to 4:59 a.m.
- 25:30 a.m. to 5:59 a.m.
- 626:00 a.m. to 6:29 a.m.
- 766:30 a.m. to 6:59 a.m.
- 1727:00 a.m. to 7:29 a.m.
- 1417:30 a.m. to 7:59 a.m.
- 848:00 a.m. to 8:29 a.m.
- 908:30 a.m. to 8:59 a.m.
- 1639:00 a.m. to 9:59 a.m.
- 1810:00 a.m. to 10:59 a.m.
- 11112:00 p.m. to 3:59 p.m.
- 754:00 p.m. to 11:59 p.m.

Occupations of males:
- Percentage of males in management occupations (except farmers):
Here: 2.9% city: 11.5%
- Percentage of males in business and financial operations occupations:
Here: 5.6% city: 5.6%
- Percentage of males in computer and mathematical occupations:
Here: 3.2% city: 6.1%
- Percentage of males in architecture and engineering occupations:
Here: 2.9% city: 3.4%
- Percentage of males in arts, design, entertainment, sports, and media occupations:
Here: 10.4% city: 2.4%
- Percentage of males in service occupations:
Here: 19.3% city: 13.8%
- Percentage of males in sales and office occupations:
Here: 29.4% city: 16.1%
- Percentage of males in production occupations:
Here: 3.5% city: 6.9%
- Percentage of males in transportation occupations:
Here: 7.8% city: 6.2%
- Percentage of males in material moving occupations:
Here: 14.2% city: 6.3%
Occupations of females:
- Percentage of females in management occupations (except farmers):
Here: 2.7% city: 9.9%
- Percentage of females in business and financial operations occupations:
Here: 8.7% city: 7.2%
- Percentage of females in computer and mathematical occupations:
Here: 2.4% city: 2.4%
- Percentage of females in education, training, and library occupations:
Here: 35.7% city: 8.0%
- Percentage of females in arts, design, entertainment, sports, and media occupations:
Here: 14.4% city: 2.7%
- Percentage of females in healthcare practitioners and technical occupations:
Here: 7.4% city: 10.3%
- Percentage of females in service occupations:
Here: 11.1% city: 18.7%
- Percentage of females in sales and office occupations:
Here: 14.4% city: 26.2%
- Percentage of females in production occupations:
Here: 5.7% city: 3.3%
- Percentage of females in transportation occupations:
Here: 3.4% city: 1.3%
- Percentage of females in material moving occupations:
Here: 4.8% city: 3.0%
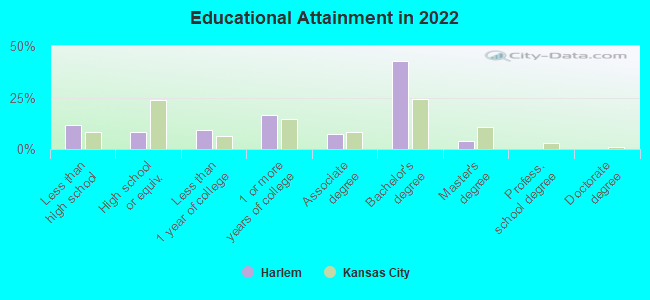
Education in this neighborhood (subdivision or community):
- Percentage of people 3 years and older in K-12 schools:
Harlem: 33.2% Kansas City: 15.8%
- Percentage of people 3 years and older in undergraduate colleges:
Harlem: 5.6% Kansas City: 5.0%
- Percentage of people 3 years and older in grad. or professional schools:
Harlem: 2.9% Kansas City: 1.7%
- Percentage of students K-12 enrolled in private schools:
Harlem: 3.0% Kansas City: 14.7%
Percentage of population below poverty level:
| Harlem: | 34.3% |
| Kansas City: | 14.6% |
Median year owner moved in (as recorded in 2022):
Median year renter moved in (as recorded in 2022):
| Harlem: | 2003 |
| Kansas City: | 2012 |
Median year renter moved in (as recorded in 2022):
| Harlem: | 2016 |
| Kansas City: | 2020 |
Percentage of married-couple families with both working:
| Harlem: | 232.0% |
| Kansas City: | 76.6% |
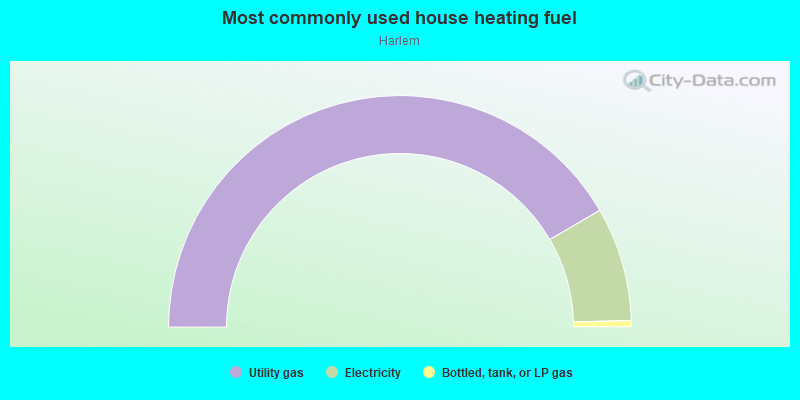
- 83.2%Utility gas
- 15.9%Electricity
- 0.9%Bottled, tank, or LP gas
Highways in this neighborhood:
Burlington St (US Hwy 71, State Hwy 9)
Length: 0.83 miles
Direction: N-S
Direction: N-S
Roads and streets:
Levee Rd
Length: 0.67 miles
Directions: E-W, SW-NE
Directions: E-W, SW-NE
NE Levee Rd
Length: 0.58 miles
Direction: SW-NE
Address range: 2 to 398
Direction: SW-NE
Address range: 2 to 398
NE Harlem Rd
Length: 0.27 miles
Directions: E-W, N-S, SW-NE
Address range: 1 to 399
Directions: E-W, N-S, SW-NE
Address range: 1 to 399
Atlantic St
Length: 0.26 miles
Directions: N-S, SW-NE
Address range: 400 to 599
Directions: N-S, SW-NE
Address range: 400 to 599
N Main St
Length: 0.15 miles
Directions: E-W, N-S, SE-NW
Address range: 200 to 399
Directions: E-W, N-S, SE-NW
Address range: 200 to 399
N Grand Ave
Length: 0.13 miles
Directions: N-S, SW-NE
Address range: 300 to 399
Directions: N-S, SW-NE
Address range: 300 to 399
NW Harlem Rd
Length: 0.12 miles
Direction: E-W
Address range: 1 to 107
Direction: E-W
Address range: 1 to 107
N Walnut St
Length: 0.10 miles
Directions: N-S, SE-NW
Address range: 300 to 399
Directions: N-S, SE-NW
Address range: 300 to 399
N Mc Gee St
Length: 0.09 miles
Direction: N-S
Address range: 300 to 399
Direction: N-S
Address range: 300 to 399
N Riley Ave
Length: 0.08 miles
Directions: E-W, N-S, SE-NW, SW-NE
Address range: 200 to 299
Directions: E-W, N-S, SE-NW, SW-NE
Address range: 200 to 299
N Oak St
Length: 0.06 miles
Direction: N-S
Address range: 300 to 399
Direction: N-S
Address range: 300 to 399
N Baltimore Ave
Length: 0.04 miles
Direction: N-S
Direction: N-S
Railroad features:
Bnsf RR (Burlington Northern Santa Fe RR)
Length: 0.85 miles
Directions: E-W, N-S, SE-NW, SW-NE
Directions: E-W, N-S, SE-NW, SW-NE
National Starch RR (Ns RR)
Length: 0.79 miles
Directions: E-W, N-S, SW-NE
Directions: E-W, N-S, SW-NE
Chicago Burlington and Quincy RR
Length: 0.63 miles
Directions: E-W, N-S, SE-NW, SW-NE
Directions: E-W, N-S, SE-NW, SW-NE
Rock Island RR
Length: 0.22 miles
Directions: E-W, SW-NE
Directions: E-W, SW-NE
Burlington Northern Santa Fe RR
Length: 0.01 miles
Direction: N-S
Direction: N-S
Highways in this neighborhood:
Heart of America Brg (State Hwy 9)
Length: 0.03 miles
Direction: N-S
Direction: N-S
Railroad features:
Burlington Northern Santa Fe RR
Length: 0.01 miles
Direction: N-S
Direction: N-S