Harismus Cove neighborhood in Jersey City, New Jersey (NJ), 07302 detailed profile
Settings
X


Business Search - 14 Million verified businesses
Area: 0.109 square miles
Population: 4,700
Population density:
| Harismus Cove: | 43,102 people per square mile |
| Jersey City: | 19,218 people per square mile |

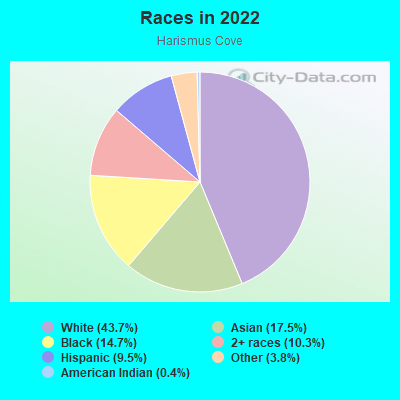
- 2,06143.7%White
- 82617.5%Asian
- 69214.7%Black
- 48710.3%Two or more races
- 4509.5%Hispanic or Latino
- 1813.8%Some other race
- 170.4%American Indian
Median household income in 2022:
| Harismus Cove: | $126,443 |
| Jersey City: | $94,080 |
Distribution of median household income
![Distribution of median household income]()
- 81Less than $10,000
- 77$10,000 to $19,999
- 295$20,000 to $29,999
- 187$30,000 to $39,999
- 164$40,000 to $49,999
- 35$50,000 to $59,999
- 314$60,000 to $74,999
- 210$75,000 to $99,999
- 380$100,000 to $124,999
- 154$125,000 to $149,999
- 194$150,000 to $199,999
- 865$200,000 or more

Distribution of owner-occupied house/condo value
![Distribution of owner-occupied house/condo value]()
- 61$200,000 to $249,999
- 16$250,000 to $299,999
- 58$300,000 to $399,999
- 31$400,000 to $499,999
- 208$500,000 to $749,999
- 230$750,000 to $999,999
- 321$1,000,000 or more

Distribution of rent paid by renters
![Distribution of rent paid by renters]()
- 78$600 to $699
- 83$800 to $899
- 219$1,000 to $1,249
- 347$1,250 to $1,499
- 387$1,500 to $1,999
- 921$2,000 or more

Median rent in 2022:
| Harismus Cove: | $1,994 |
| Jersey City: | $1,738 |
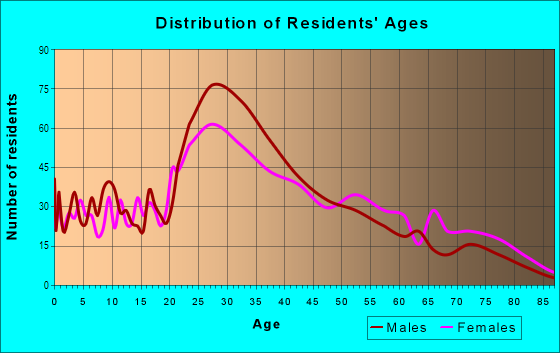
| Males: | 2,576 |
| Females: | 2,124 |
Males:
| This neighborhood: | 33.3 years |
| Whole city: | 34.1 years |
| This neighborhood: | 36.0 years |
| Whole city: | 36.2 years |
Average household size:
| Harismus Cove: | 1.9 people |
| Jersey City: | 2.2 people |
Percentage of family households:
| Harismus Cove: | 37.5% |
| Jersey City: | 39.8% |
| Here: | 36.3% |
| Jersey City: | 34.2% |
Percentage of married-couple families with children (among all households):
| Harismus Cove: | 42.0% |
| Jersey City: | 29.4% |
Percentage of single-mother households (among all households):
| Harismus Cove: | 10.8% |
| Jersey City: | 13.3% |
Percentage of never married males 15 years old and over:
Percentage of never married females 15 years old and over:
| Harismus Cove: | 26.0% |
| Jersey City: | 23.6% |
Percentage of never married females 15 years old and over:
| Harismus Cove: | 19.4% |
| city: | 22.6% |
Percentage of people that speak English not well or not at all:
| Harismus Cove: | 2.5% |
| Jersey City: | 7.2% |
Percentage of people born in this state:
Percentage of people born in another U.S. state:
Percentage of native residents but born outside the U.S.:
Percentage of foreign born residents:
| Here: | 26.2% |
| Jersey City: | 34.5% |
Percentage of people born in another U.S. state:
| Harismus Cove: | 44.1% |
| Jersey City: | 22.1% |
Percentage of native residents but born outside the U.S.:
| Here: | 2.1% |
| city: | 3.8% |
Percentage of foreign born residents:
| Here: | 27.6% |
| Jersey City: | 39.6% |
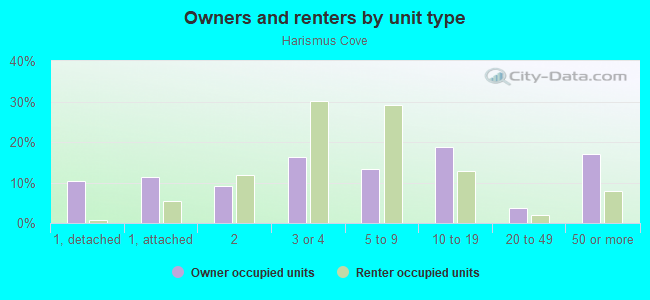
Owner-occupied
Renter-occupied

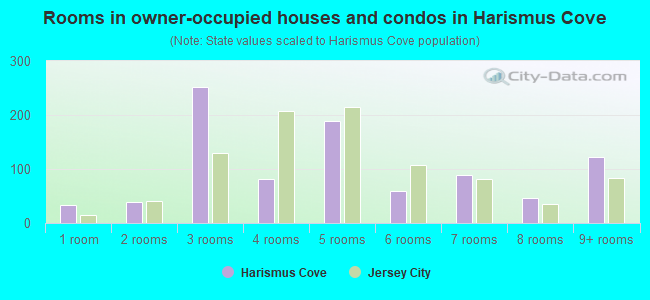
- Rooms in owner-occupied houses and condos in Harismus Cove
- 331 room
- 382 rooms
- 2523 rooms
- 824 rooms
- 1885 rooms
- 606 rooms
- 897 rooms
- 478 rooms
- 1239+ rooms
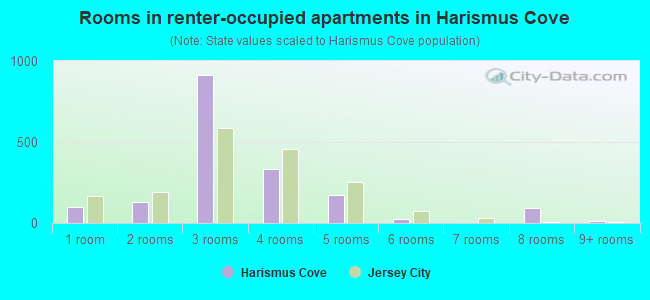
- Rooms in renter-occupied apartments in Harismus Cove
- 1011 room
- 1272 rooms
- 9163 rooms
- 3314 rooms
- 1725 rooms
- 226 rooms
- 07 rooms
- 938 rooms
- 139+ rooms
Owner-occupied
Renter-occupied
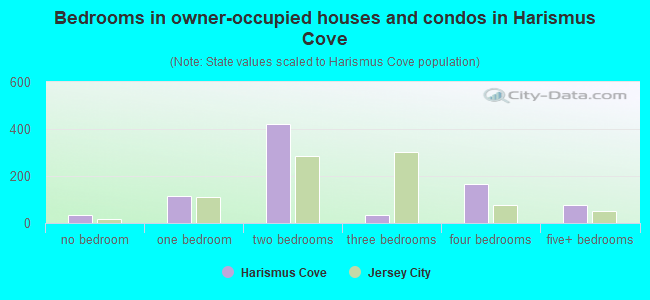
- Bedrooms in owner-occupied houses and condos in Harismus Cove
- 33no bedroom
- 1161 bedroom
- 4222 bedrooms
- 363 bedrooms
- 1664 bedrooms
- 755+ bedrooms
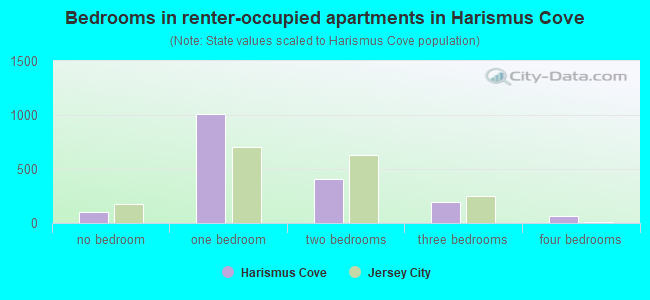
- Bedrooms in renter-occupied apartments in Harismus Cove
- 101no bedroom
- 1,0111 bedroom
- 4082 bedrooms
- 1963 bedrooms
- 654 bedrooms
- 05+ bedrooms
Average number of cars or other vehicles available in houses/condos:
Average number of cars or other vehicles available in apartments:
| This neighborhood: | 1.0 |
| Jersey City: | 1.3 |
Average number of cars or other vehicles available in apartments:
| Here: | 0.7 |
| city: | 0.6 |
Percentage of units with a mortgage:
| Harismus Cove: | 75.8% |
| Jersey City: | 69.4% |
Housing prices:
- Average estimated value of detached houses in 2022 (3.9% of all units):
Harismus Cove: $816,814 Jersey City: $732,576
- Average estimated value of townhouses or other attached units in 2022 (8.4% of all units):
This neighborhood: $1,633,904 city: $695,567
- Average estimated value of housing units in 2-unit structures in 2022 (10.8% of all units):
This neighborhood: $1,082,883 Jersey City: $571,976
- Average estimated '22 value of housing units in 3-to-4-unit structures (31.6% of all units):
Harismus Cove: $880,996 city: $581,467
- Average estimated '22 value of housing units in 5-or-more-unit structures (11.8% of all units):
Harismus Cove: $809,758 Jersey City: $666,445
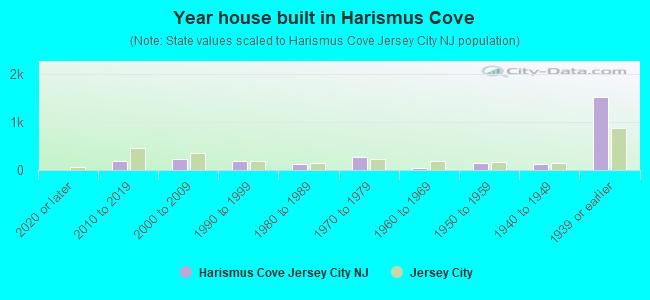
- Year house built in Harismus Cove
- 02020 or later
- 1932010 to 2019
- 2282000 to 2009
- 1891990 to 1999
- 1321980 to 1989
- 2761970 to 1979
- 381960 to 1969
- 1361950 to 1959
- 1221940 to 1949
- 1,5111939 or earlier
City-data.com crime index for city in 2020 (higher means more crime):
| City: | 198.8 |
| U.S. average: | 219.5 |
Travel time to work (commute)
![Travel time to work (commute)]()
- 15Less than 5 minutes
- 35 to 9 minutes
- 15010 to 14 minutes
- 15415 to 19 minutes
- 32620 to 24 minutes
- 17025 to 29 minutes
- 26330 to 34 minutes
- 21935 to 39 minutes
- 22740 to 44 minutes
- 69945 to 59 minutes
- 32360 to 89 minutes
- 18690 or more minutes

Means of transportation to work
![Means of transportation to work]()
- 22.4%750Drove a car alone
- 3.7%124Carpooled
- 2.0%68Bus
- 32.6%1,091Subway or elevated rail
- 7.1%237Long-distance train or commuter rail
- 2.8%93Light rail, streetcar or trolley
- 0.7%25Ferryboat
- 2.8%95Taxi
- 1.1%38Bicycle
- 5.1%172Walked
- 1.2%39Other means
- 30.8%1,030Worked at home

Time leaving home to go to work
![Time leaving home to go to work]()
- 1005:30 a.m. to 5:59 a.m.
- 2186:00 a.m. to 6:29 a.m.
- 736:30 a.m. to 6:59 a.m.
- 4227:00 a.m. to 7:29 a.m.
- 3647:30 a.m. to 7:59 a.m.
- 5598:00 a.m. to 8:29 a.m.
- 4018:30 a.m. to 8:59 a.m.
- 4909:00 a.m. to 9:59 a.m.
- 4210:00 a.m. to 10:59 a.m.
- 2111:00 a.m. to 11:59 a.m.
- 8212:00 p.m. to 3:59 p.m.
- 394:00 p.m. to 11:59 p.m.

Occupations of males:
- Percentage of males in management occupations (except farmers):
Here: 24.2% city: 12.9%
- Percentage of males in business and financial operations occupations:
Here: 16.1% city: 9.9%
- Percentage of males in computer and mathematical occupations:
Here: 12.8% city: 13.5%
- Percentage of males in architecture and engineering occupations:
Here: 1.3% city: 3.7%
- Percentage of males in life, physical, and social science occupations:
Here: 1.7% city: 1.1%
- Percentage of males in community and social services occupations:
Here: 1.1% city: 0.7%
- Percentage of males in legal occupations:
Here: 1.2% city: 1.8%
- Percentage of males in education, training, and library occupations:
Here: 8.6% city: 3.6%
- Percentage of males in arts, design, entertainment, sports, and media occupations:
Here: 9.9% city: 3.5%
- Percentage of males in healthcare practitioners and technical occupations:
Here: 2.0% city: 2.6%
- Percentage of males in service occupations:
Here: 1.6% city: 10.4%
- Percentage of males in sales and office occupations:
Here: 14.8% city: 13.4%
- Percentage of males in construction, extraction, and maintenance occupations:
Here: 4.0% city: 5.6%
Occupations of females:
- Percentage of females in management occupations (except farmers):
Here: 25.0% city: 11.5%
- Percentage of females in business and financial operations occupations:
Here: 7.8% city: 11.7%
- Percentage of females in computer and mathematical occupations:
Here: 6.0% city: 5.3%
- Percentage of females in architecture and engineering occupations:
Here: 2.7% city: 1.1%
- Percentage of females in community and social services occupations:
Here: 1.2% city: 2.2%
- Percentage of females in legal occupations:
Here: 4.7% city: 2.6%
- Percentage of females in education, training, and library occupations:
Here: 11.7% city: 8.3%
- Percentage of females in arts, design, entertainment, sports, and media occupations:
Here: 7.3% city: 4.9%
- Percentage of females in healthcare practitioners and technical occupations:
Here: 7.4% city: 6.5%
- Percentage of females in service occupations:
Here: 7.3% city: 17.9%
- Percentage of females in sales and office occupations:
Here: 17.6% city: 21.2%
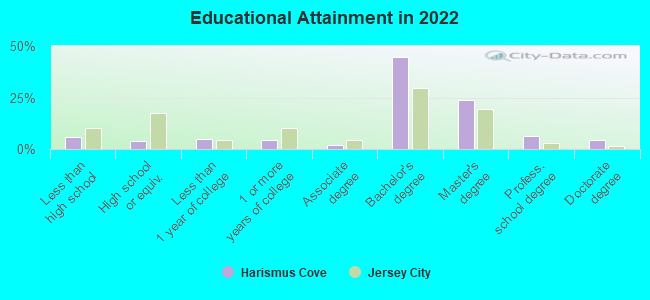
Education in this neighborhood (subdivision or community):
- Percentage of people 3 years and older in K-12 schools:
Harismus Cove: 15.4% Jersey City: 12.9%
- Percentage of people 3 years and older in undergraduate colleges:
Harismus Cove: 3.7% Jersey City: 4.5%
- Percentage of people 3 years and older in grad. or professional schools:
Harismus Cove: 5.1% Jersey City: 2.2%
- Percentage of students K-12 enrolled in private schools:
Harismus Cove: 34.2% Jersey City: 10.8%
Percentage of population below poverty level:
| Harismus Cove: | 3.7% |
| Jersey City: | 12.8% |
Median year owner moved in (as recorded in 2022):
Median year renter moved in (as recorded in 2022):
| Harismus Cove: | 2014 |
| Jersey City: | 2010 |
Median year renter moved in (as recorded in 2022):
| Harismus Cove: | 2018 |
| Jersey City: | 2019 |
Percentage of married-couple families with both working:
| Harismus Cove: | 74.4% |
| Jersey City: | 63.9% |
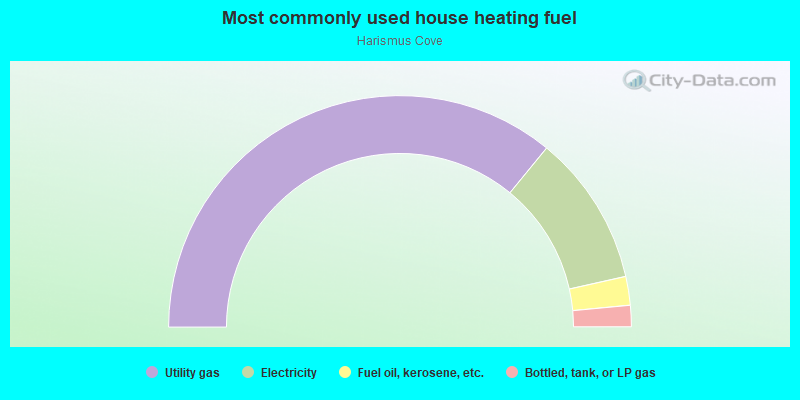
- 71.8%Utility gas
- 21.1%Electricity
- 4.0%Fuel oil, kerosene, etc.
- 3.0%Bottled, tank, or LP gas
Roads and streets:
Co Rd 628 (4th St)
Length: 0.46 miles
Direction: E-W
Address range: 101 to 298
Direction: E-W
Address range: 101 to 298
3rd St (Co Rd 626)
Length: 0.46 miles
Direction: E-W
Address range: 113 to 291
Direction: E-W
Address range: 113 to 291
2nd St
Length: 0.46 miles
Direction: E-W
Address range: 187 to 322
Direction: E-W
Address range: 187 to 322
1st St
Length: 0.41 miles
Direction: E-W
Address range: 200 to 282
Direction: E-W
Address range: 200 to 282
Co Rd 639 (Newark Ave)
Length: 0.37 miles
Direction: SE-NW
Address range: 119 to 225
Direction: SE-NW
Address range: 119 to 225
Bay St
Length: 0.29 miles
Direction: E-W
Address range: 182 to 299
Direction: E-W
Address range: 182 to 299
Co Rd 637 (Henderson St, Luis Munoz Marin Blvd)
Length: 0.25 miles
Direction: N-S
Address range: 331 to 410
Direction: N-S
Address range: 331 to 410
Co Rd 633 (Erie St)
Length: 0.22 miles
Direction: N-S
Address range: 1 to 70
Direction: N-S
Address range: 1 to 70
Grove St (Co Rd 635)
Length: 0.21 miles
Direction: N-S
Address range: 329 to 370
Direction: N-S
Address range: 329 to 370
Jersey Ave (Co Rd 631)
Length: 0.18 miles
Direction: N-S
Address range: 543 to 594
Direction: N-S
Address range: 543 to 594
Coles St
Length: 0.13 miles
Direction: N-S
Address range: 25 to 70
Direction: N-S
Address range: 25 to 70
Morgan St
Length: 0.11 miles
Direction: E-W
Address range: 178 to 299
Direction: E-W
Address range: 178 to 299
Co Rd 635 (Manila Ave)
Length: 0.10 miles
Direction: N-S
Address range: 360 to 522
Direction: N-S
Address range: 360 to 522
Saddlewood Ct
Length: 0.03 miles
Direction: N-S
Address range: 1 to 99
Direction: N-S
Address range: 1 to 99
Laurel Ct
Length: 0.03 miles
Direction: N-S
Address range: 1 to 100
Direction: N-S
Address range: 1 to 100