Hammer neighborhood in San Jose, California (CA), 95118 detailed profile
Settings
X

Business Search - 14 Million verified businesses
Area: 0.142 square miles
Population: 1,576
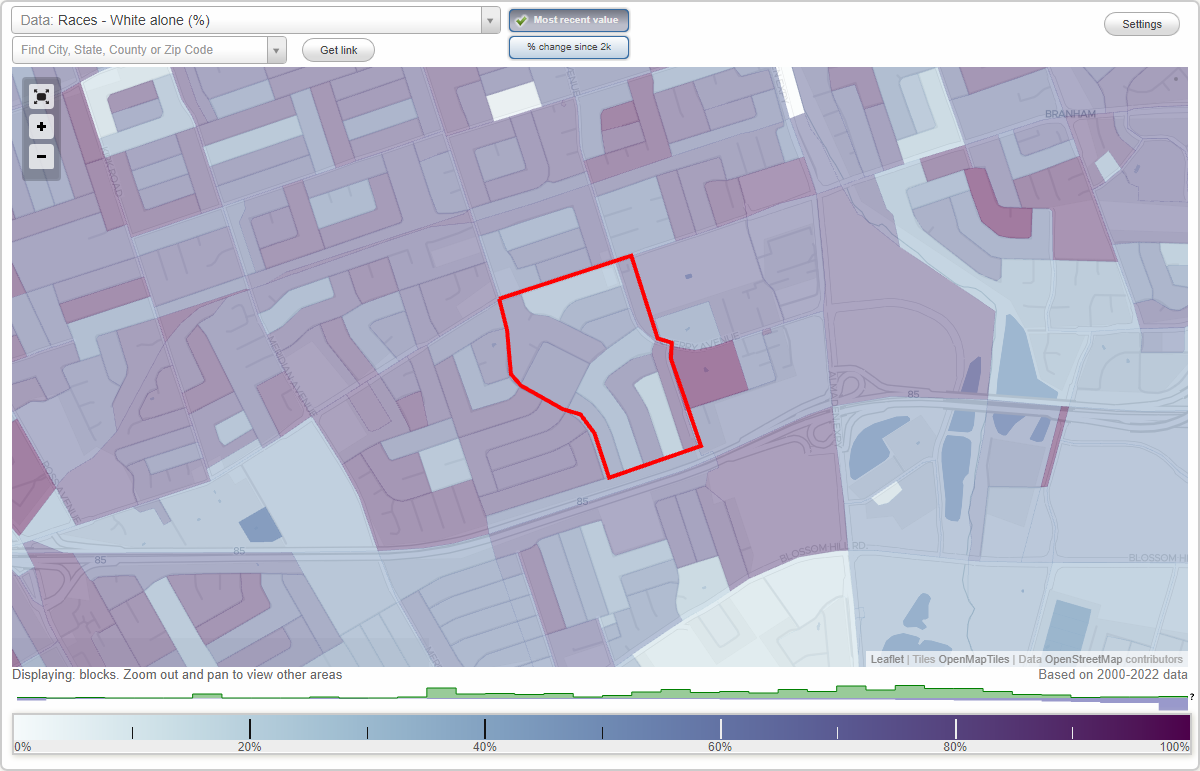
Population density:
| Hammer: | 11,088 people per square mile |
| San Jose: | 5,554 people per square mile |

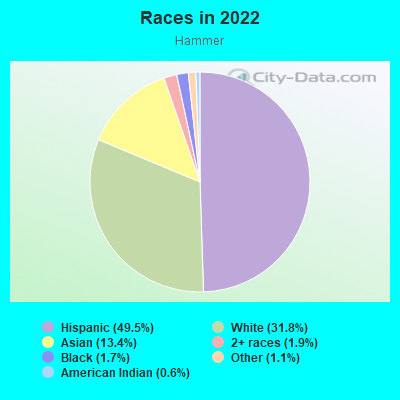
- 79249.5%Hispanic or Latino
- 50931.8%White
- 21513.4%Asian
- 311.9%Two or more races
- 271.7%Black
- 181.1%Some other race
- 90.6%American Indian
Median household income in 2022:
| Hammer: | $137,749 |
| San Jose: | $133,835 |
Distribution of median household income
![Distribution of median household income]()
- 23Less than $10,000
- 37$10,000 to $19,999
- 50$20,000 to $29,999
- 39$30,000 to $39,999
- 51$40,000 to $49,999
- 46$50,000 to $59,999
- 49$60,000 to $74,999
- 45$75,000 to $99,999
- 96$100,000 to $124,999
- 41$125,000 to $149,999
- 138$150,000 to $199,999
- 116$200,000 or more

Distribution of owner-occupied house/condo value
![Distribution of owner-occupied house/condo value]()
- 3Less than $50,000
- 9$50,000 to $99,999
- 10$100,000 to $149,999
- 3$150,000 to $199,999
- 62$400,000 to $499,999
- 158$500,000 to $749,999
- 19$750,000 to $999,999
- 145$1,000,000 or more

Distribution of rent paid by renters
![Distribution of rent paid by renters]()
- 7Less than $100
- 8$200 to $299
- 42$300 to $399
- 3$400 to $499
- 33$500 to $599
- 19$600 to $699
- 4$700 to $799
- 7$800 to $899
- 38$900 to $999
- 61$1,000 to $1,249
- 13$1,250 to $1,499
- 46$1,500 to $1,999
- 241$2,000 or more

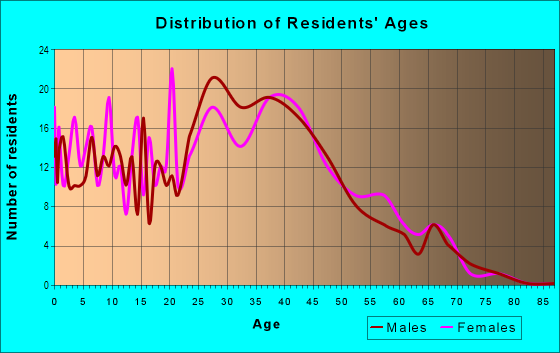
| Males: | 761 |
| Females: | 815 |
Males:
| This neighborhood: | 39.7 years |
| Whole city: | 37.6 years |
| This neighborhood: | 41.9 years |
| Whole city: | 39.1 years |
Average household size:
| Hammer: | 2.6 people |
| San Jose: | 2.9 people |
Percentage of family households:
| Hammer: | 66.3% |
| San Jose: | 49.9% |
| Here: | 34.9% |
| San Jose: | 53.0% |
Percentage of married-couple families with children (among all households):
| Hammer: | 16.2% |
| San Jose: | 25.8% |
Percentage of single-mother households (among all households):
| Hammer: | 23.3% |
| San Jose: | 5.2% |
Percentage of never married males 15 years old and over:
Percentage of never married females 15 years old and over:
| Hammer: | 19.3% |
| San Jose: | 20.9% |
Percentage of never married females 15 years old and over:
| Hammer: | 22.7% |
| city: | 16.7% |
Percentage of people that speak English not well or not at all:
| Hammer: | 3.9% |
| San Jose: | 11.4% |
Percentage of people born in this state:
Percentage of people born in another U.S. state:
Percentage of native residents but born outside the U.S.:
Percentage of foreign born residents:
| Here: | 59.3% |
| San Jose: | 46.1% |
Percentage of people born in another U.S. state:
| Hammer: | 11.1% |
| San Jose: | 10.4% |
Percentage of native residents but born outside the U.S.:
| Here: | 1.1% |
| city: | 1.7% |
Percentage of foreign born residents:
| Here: | 28.5% |
| San Jose: | 41.8% |
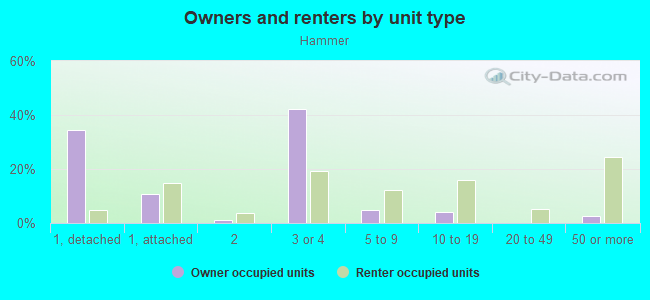
Owner-occupied
Renter-occupied

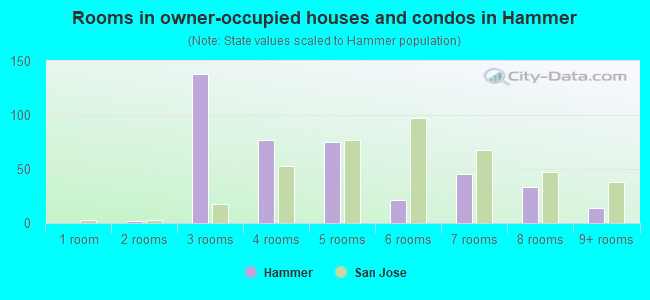
- Rooms in owner-occupied houses and condos in Hammer
- 01 room
- 22 rooms
- 1383 rooms
- 774 rooms
- 755 rooms
- 216 rooms
- 457 rooms
- 338 rooms
- 149+ rooms
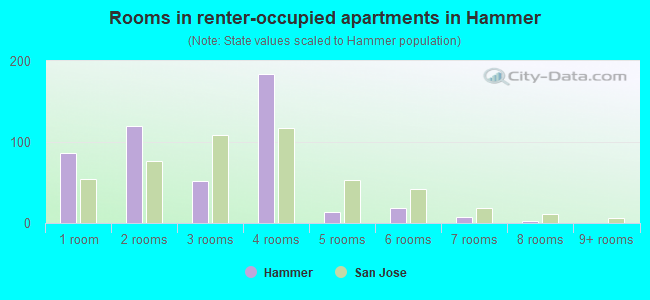
- Rooms in renter-occupied apartments in Hammer
- 871 room
- 1202 rooms
- 523 rooms
- 1844 rooms
- 145 rooms
- 196 rooms
- 87 rooms
- 28 rooms
- 09+ rooms
Owner-occupied
Renter-occupied
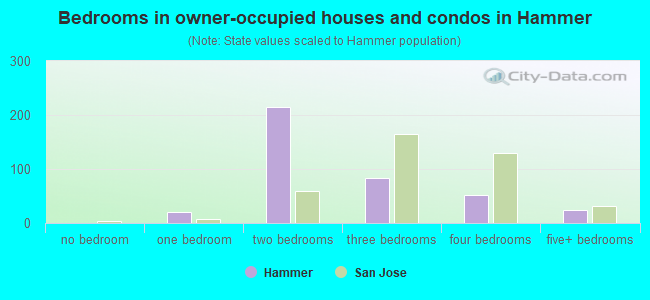
- Bedrooms in owner-occupied houses and condos in Hammer
- 0no bedroom
- 201 bedroom
- 2152 bedrooms
- 843 bedrooms
- 514 bedrooms
- 255+ bedrooms
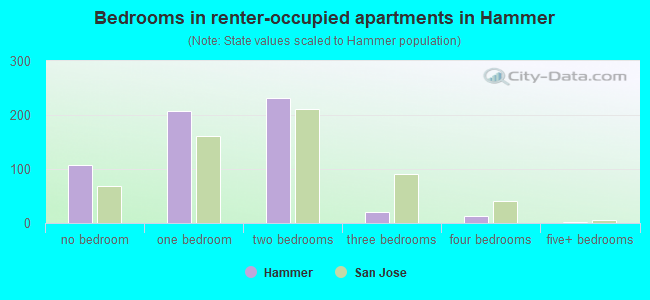
- Bedrooms in renter-occupied apartments in Hammer
- 107no bedroom
- 2071 bedroom
- 2322 bedrooms
- 203 bedrooms
- 134 bedrooms
- 25+ bedrooms
Average number of cars or other vehicles available in houses/condos:
Average number of cars or other vehicles available in apartments:
| This neighborhood: | 1.7 |
| San Jose: | 2.3 |
Average number of cars or other vehicles available in apartments:
| Here: | 1.5 |
| city: | 1.6 |
Percentage of units with a mortgage:
| Hammer: | 81.0% |
| San Jose: | 66.9% |
Average estimated value of detached houses in 2022 (28.7% of all units):
| Hammer: | $1,696,563 |
| San Jose: | $1,532,815 |
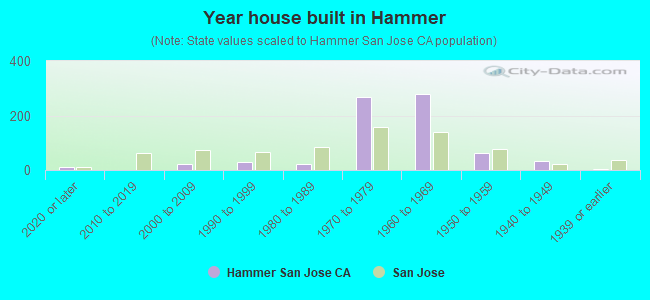
- Year house built in Hammer
- 112020 or later
- 02010 to 2019
- 222000 to 2009
- 291990 to 1999
- 231980 to 1989
- 2681970 to 1979
- 2781960 to 1969
- 611950 to 1959
- 321940 to 1949
- 51939 or earlier
City-data.com crime index for city in 2020 (higher means more crime):
| City: | 268.4 |
| U.S. average: | 219.5 |
Travel time to work (commute)
![Travel time to work (commute)]()
- 10Less than 5 minutes
- 215 to 9 minutes
- 6910 to 14 minutes
- 11115 to 19 minutes
- 15620 to 24 minutes
- 3525 to 29 minutes
- 14730 to 34 minutes
- 2435 to 39 minutes
- 2740 to 44 minutes
- 6945 to 59 minutes
- 5160 to 89 minutes
- 3690 or more minutes

Means of transportation to work
![Means of transportation to work]()
- 74.9%650Drove a car alone
- 6.2%54Carpooled
- 1.0%9Bus
- 1.5%13Long-distance train or commuter rail
- 1.8%16Light rail, streetcar or trolley
- 0.2%2Taxi
- 1.2%10Motorcycle
- 2.0%17Bicycle
- 3.5%30Walked
- 2.8%24Other means
- 10.9%95Worked at home

Time leaving home to go to work
![Time leaving home to go to work]()
- 3912:00 a.m. to 4:59 a.m.
- 145:00 a.m. to 5:29 a.m.
- 365:30 a.m. to 5:59 a.m.
- 646:00 a.m. to 6:29 a.m.
- 626:30 a.m. to 6:59 a.m.
- 1297:00 a.m. to 7:29 a.m.
- 1087:30 a.m. to 7:59 a.m.
- 608:00 a.m. to 8:29 a.m.
- 538:30 a.m. to 8:59 a.m.
- 659:00 a.m. to 9:59 a.m.
- 2010:00 a.m. to 10:59 a.m.
- 511:00 a.m. to 11:59 a.m.
- 3512:00 p.m. to 3:59 p.m.
- 614:00 p.m. to 11:59 p.m.

Occupations of males:
- Percentage of males in management occupations (except farmers):
Here: 25.6% city: 13.0%
- Percentage of males in business and financial operations occupations:
Here: 7.4% city: 4.6%
- Percentage of males in computer and mathematical occupations:
Here: 3.2% city: 13.6%
- Percentage of males in architecture and engineering occupations:
Here: 8.5% city: 10.2%
- Percentage of males in education, training, and library occupations:
Here: 5.9% city: 2.8%
- Percentage of males in arts, design, entertainment, sports, and media occupations:
Here: 7.5% city: 1.8%
- Percentage of males in service occupations:
Here: 10.4% city: 12.7%
- Percentage of males in sales and office occupations:
Here: 5.2% city: 12.8%
- Percentage of males in farming, fishing, and forestry occupations:
Here: 3.1% city: 0.4%
- Percentage of males in construction, extraction, and maintenance occupations:
Here: 9.5% city: 7.8%
- Percentage of males in production occupations:
Here: 5.3% city: 5.5%
- Percentage of males in transportation occupations:
Here: 5.1% city: 3.6%
Occupations of females:
- Percentage of females in management occupations (except farmers):
Here: 13.5% city: 11.0%
- Percentage of females in business and financial operations occupations:
Here: 9.6% city: 8.6%
- Percentage of females in education, training, and library occupations:
Here: 14.3% city: 8.1%
- Percentage of females in arts, design, entertainment, sports, and media occupations:
Here: 4.7% city: 2.0%
- Percentage of females in healthcare practitioners and technical occupations:
Here: 2.7% city: 6.8%
- Percentage of females in service occupations:
Here: 20.0% city: 21.7%
- Percentage of females in sales and office occupations:
Here: 12.5% city: 22.0%
- Percentage of females in construction, extraction, and maintenance occupations:
Here: 13.2% city: 0.2%
- Percentage of females in material moving occupations:
Here: 9.0% city: 1.5%
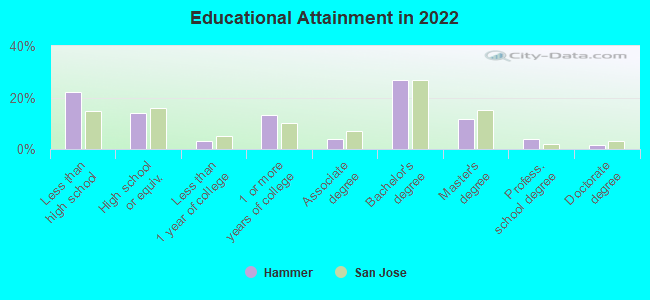
Education in this neighborhood (subdivision or community):
- Percentage of people 3 years and older in K-12 schools:
Hammer: 18.8% San Jose: 16.1%
- Percentage of people 3 years and older in undergraduate colleges:
Hammer: 3.2% San Jose: 6.5%
- Percentage of people 3 years and older in grad. or professional schools:
Hammer: 1.9% San Jose: 2.0%
- Percentage of students K-12 enrolled in private schools:
Hammer: 27.6% San Jose: 14.9%
Percentage of population below poverty level:
| Hammer: | 3.1% |
| San Jose: | 9.0% |
Median year owner moved in (as recorded in 2022):
| Hammer: | 2003 |
| San Jose: | 2008 |
Percentage of married-couple families with both working:
| Hammer: | 44.3% |
| San Jose: | 72.5% |
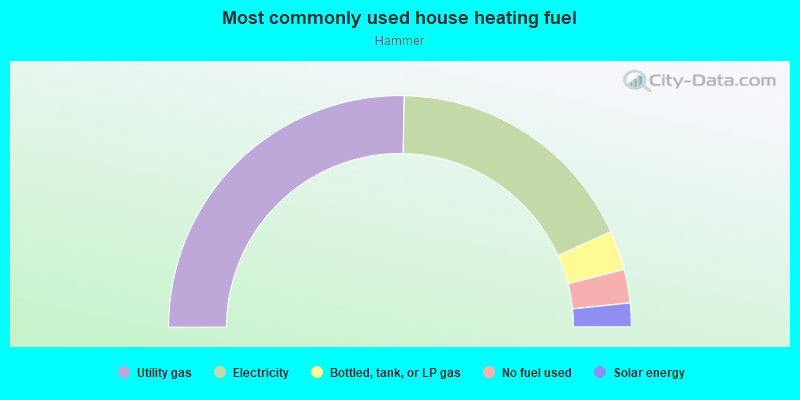
- 50.6%Utility gas
- 35.9%Electricity
- 5.5%Bottled, tank, or LP gas
- 4.7%No fuel used
- 3.3%Solar energy
Roads and streets:
Corbin Ave
Length: 0.39 miles
Directions: E-W, N-S, SE-NW, SW-NE
Address range: 4900 to 5099
Directions: E-W, N-S, SE-NW, SW-NE
Address range: 4900 to 5099
Wayland Ave
Length: 0.28 miles
Directions: N-S, SE-NW, SW-NE
Address range: 4900 to 5099
Directions: N-S, SE-NW, SW-NE
Address range: 4900 to 5099
Trenary Way
Length: 0.28 miles
Directions: E-W, N-S, SE-NW, SW-NE
Address range: 5000 to 5099
Directions: E-W, N-S, SE-NW, SW-NE
Address range: 5000 to 5099
Tifton Way
Length: 0.25 miles
Directions: N-S, SE-NW
Address range: 4900 to 5099
Directions: N-S, SE-NW
Address range: 4900 to 5099
Bouret Dr
Length: 0.25 miles
Direction: SW-NE
Address range: 1200 to 1330
Direction: SW-NE
Address range: 1200 to 1330
Cherry Ave
Length: 0.24 miles
Directions: E-W, N-S, SE-NW
Address range: 4655 to 4899
Directions: E-W, N-S, SE-NW
Address range: 4655 to 4899
Capay Dr
Length: 0.24 miles
Directions: E-W, SE-NW
Address range: 4700 to 4899
Directions: E-W, SE-NW
Address range: 4700 to 4899
Shawn Dr
Length: 0.21 miles
Directions: E-W, SW-NE
Address range: 1300 to 1399
Directions: E-W, SW-NE
Address range: 1300 to 1399
Lansing Ave
Length: 0.21 miles
Direction: E-W
Address range: 1200 to 1325
Direction: E-W
Address range: 1200 to 1325
Scossa Ave
Length: 0.20 miles
Directions: E-W, SW-NE
Address range: 1300 to 1358
Directions: E-W, SW-NE
Address range: 1300 to 1358
Russo Dr
Length: 0.16 miles
Directions: N-S, SE-NW
Directions: N-S, SE-NW
Joplin Dr
Length: 0.16 miles
Directions: E-W, SW-NE
Address range: 1300 to 1399
Directions: E-W, SW-NE
Address range: 1300 to 1399
Cosmo Pl
Length: 0.04 miles
Directions: E-W, N-S
Directions: E-W, N-S
Capay Ct
Length: 0.02 miles
Direction: SW-NE
Address range: 4600 to 4699
Direction: SW-NE
Address range: 4600 to 4699