Guilford Hills neighborhood in Greensboro, North Carolina (NC), 27408 detailed profile
Settings
X


Business Search - 14 Million verified businesses
Area: 0.594 square miles
Population: 1,586
Population density:
| Guilford Hills: | 2,669 people per square mile |
| Greensboro: | 2,876 people per square mile |

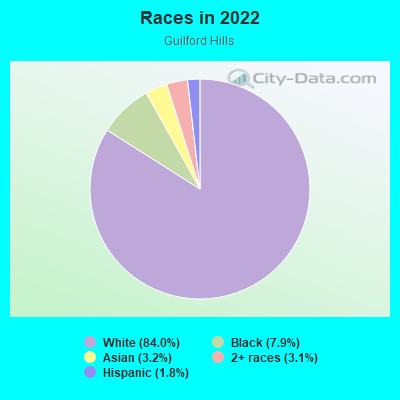
- 1,33784.0%White
- 1257.9%Black
- 513.2%Asian
- 503.1%Two or more races
- 281.8%Hispanic or Latino
Distribution of median household income
![Distribution of median household income]()
- 16Less than $10,000
- 68$10,000 to $19,999
- 102$20,000 to $29,999
- 35$30,000 to $39,999
- 118$40,000 to $49,999
- 71$50,000 to $59,999
- 70$60,000 to $74,999
- 89$75,000 to $99,999
- 79$100,000 to $124,999
- 56$125,000 to $149,999
- 73$150,000 to $199,999
- 34$200,000 or more

Distribution of owner-occupied house/condo value
![Distribution of owner-occupied house/condo value]()
- 8Less than $50,000
- 77$100,000 to $149,999
- 178$150,000 to $199,999
- 149$200,000 to $249,999
- 100$250,000 to $299,999
- 67$300,000 to $399,999
- 50$400,000 to $499,999
- 42$500,000 to $749,999
- 8$750,000 to $999,999
- 4$1,000,000 or more

Distribution of rent paid by renters
![Distribution of rent paid by renters]()
- 11$200 to $299
- 17$700 to $799
- 42$800 to $899
- 11$900 to $999
- 25$1,000 to $1,249
- 65$1,250 to $1,499
- 47$1,500 to $1,999
- 5$2,000 or more

Median rent in 2022:
| Guilford Hills: | $1,226 |
| Greensboro: | $915 |
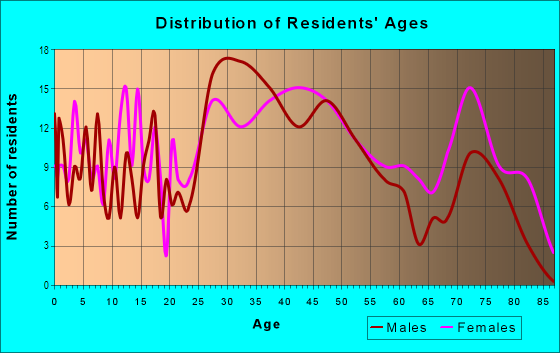
| Males: | 718 |
| Females: | 868 |
Males:
| This neighborhood: | 46.5 years |
| Whole city: | 32.4 years |
| This neighborhood: | 50.2 years |
| Whole city: | 35.3 years |
Average household size:
| Guilford Hills: | 2.4 people |
| Greensboro: | 2.3 people |
Percentage of family households:
| Guilford Hills: | 28.4% |
| Greensboro: | 43.6% |
| Here: | 31.9% |
| Greensboro: | 36.2% |
Percentage of married-couple families with children (among all households):
| Guilford Hills: | 28.5% |
| Greensboro: | 22.4% |
Percentage of single-mother households (among all households):
| Guilford Hills: | 7.6% |
| Greensboro: | 15.5% |
Percentage of never married males 15 years old and over:
Percentage of never married females 15 years old and over:
| Guilford Hills: | 19.7% |
| Greensboro: | 20.8% |
Percentage of never married females 15 years old and over:
| Guilford Hills: | 15.5% |
| city: | 23.9% |
Percentage of people that speak English not well or not at all:
| Guilford Hills: | 2.0% |
| Greensboro: | 2.7% |
Percentage of people born in this state:
Percentage of people born in another U.S. state:
Percentage of native residents but born outside the U.S.:
Percentage of foreign born residents:
| Here: | 55.6% |
| Greensboro: | 52.7% |
Percentage of people born in another U.S. state:
| Guilford Hills: | 38.0% |
| Greensboro: | 33.7% |
Percentage of native residents but born outside the U.S.:
| Here: | 2.2% |
| city: | 1.6% |
Percentage of foreign born residents:
| Here: | 4.2% |
| Greensboro: | 12.0% |
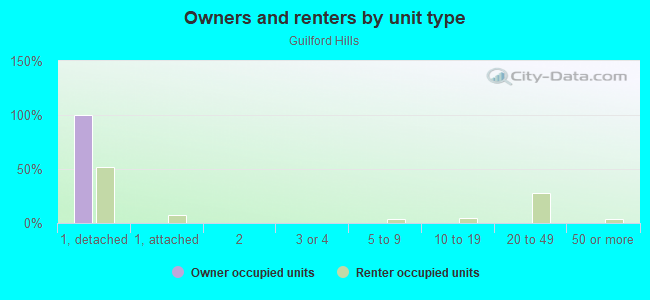
Owner-occupied
Renter-occupied

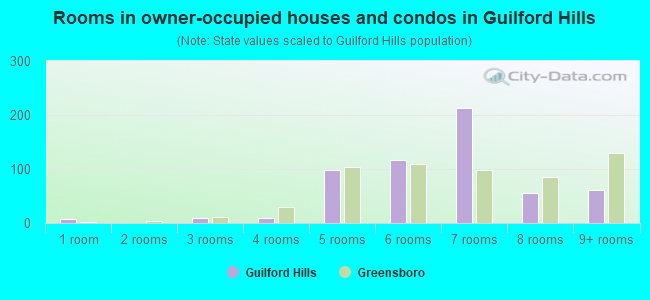
- Rooms in owner-occupied houses and condos in Guilford Hills
- 81 room
- 02 rooms
- 103 rooms
- 94 rooms
- 985 rooms
- 1166 rooms
- 2137 rooms
- 568 rooms
- 619+ rooms
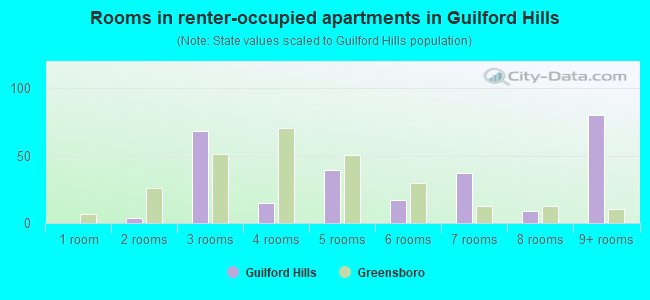
- Rooms in renter-occupied apartments in Guilford Hills
- 01 room
- 42 rooms
- 683 rooms
- 154 rooms
- 395 rooms
- 176 rooms
- 377 rooms
- 98 rooms
- 809+ rooms
Owner-occupied
Renter-occupied
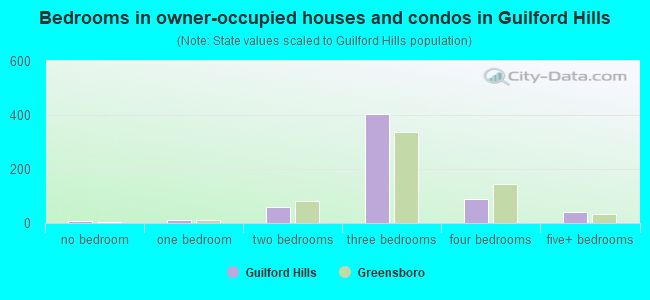
- Bedrooms in owner-occupied houses and condos in Guilford Hills
- 8no bedroom
- 101 bedroom
- 612 bedrooms
- 4023 bedrooms
- 884 bedrooms
- 395+ bedrooms
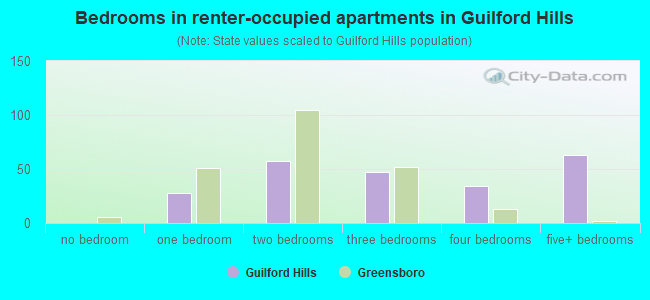
- Bedrooms in renter-occupied apartments in Guilford Hills
- 0no bedroom
- 281 bedroom
- 572 bedrooms
- 473 bedrooms
- 344 bedrooms
- 635+ bedrooms
Average number of cars or other vehicles available in houses/condos:
Average number of cars or other vehicles available in apartments:
| This neighborhood: | 1.7 |
| Greensboro: | 2.0 |
Average number of cars or other vehicles available in apartments:
| Here: | 1.9 |
| city: | 1.4 |
Percentage of units with a mortgage:
| Guilford Hills: | 60.8% |
| Greensboro: | 67.4% |
Average estimated value of detached houses in 2022 (92.3% of all units):
| Guilford Hills: | $218,921 |
| Greensboro: | $297,193 |
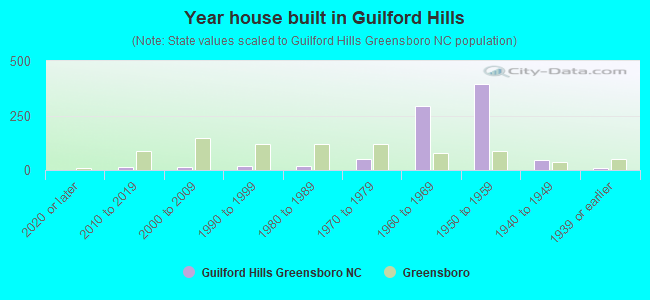
- Year house built in Guilford Hills
- 12020 or later
- 142010 to 2019
- 122000 to 2009
- 171990 to 1999
- 191980 to 1989
- 491970 to 1979
- 2921960 to 1969
- 3931950 to 1959
- 471940 to 1949
- 101939 or earlier
City-data.com crime index for city in 2020 (higher means more crime):
| City: | 435.6 |
| U.S. average: | 219.5 |
Travel time to work (commute)
![Travel time to work (commute)]()
- 12Less than 5 minutes
- 755 to 9 minutes
- 7810 to 14 minutes
- 8615 to 19 minutes
- 3720 to 24 minutes
- 1925 to 29 minutes
- 5030 to 34 minutes
- 1235 to 39 minutes
- 740 to 44 minutes
- 945 to 59 minutes
- 860 to 89 minutes
- 390 or more minutes

Means of transportation to work
![Means of transportation to work]()
- 77.2%565Drove a car alone
- 4.0%29Carpooled
- 3.0%22Motorcycle
- 1.2%9Walked
- 3.0%22Other means
- 15.8%116Worked at home

Time leaving home to go to work
![Time leaving home to go to work]()
- 412:00 a.m. to 4:59 a.m.
- 195:00 a.m. to 5:29 a.m.
- 35:30 a.m. to 5:59 a.m.
- 276:00 a.m. to 6:29 a.m.
- 136:30 a.m. to 6:59 a.m.
- 557:00 a.m. to 7:29 a.m.
- 747:30 a.m. to 7:59 a.m.
- 638:00 a.m. to 8:29 a.m.
- 368:30 a.m. to 8:59 a.m.
- 519:00 a.m. to 9:59 a.m.
- 2810:00 a.m. to 10:59 a.m.
- 311:00 a.m. to 11:59 a.m.
- 512:00 p.m. to 3:59 p.m.
- 164:00 p.m. to 11:59 p.m.

Occupations of males:
- Percentage of males in management occupations (except farmers):
Here: 10.9% city: 10.2%
- Percentage of males in business and financial operations occupations:
Here: 3.9% city: 4.8%
- Percentage of males in computer and mathematical occupations:
Here: 4.5% city: 3.9%
- Percentage of males in architecture and engineering occupations:
Here: 1.7% city: 3.1%
- Percentage of males in community and social services occupations:
Here: 1.8% city: 1.4%
- Percentage of males in education, training, and library occupations:
Here: 6.7% city: 4.0%
- Percentage of males in arts, design, entertainment, sports, and media occupations:
Here: 1.6% city: 1.5%
- Percentage of males in healthcare practitioners and technical occupations:
Here: 5.5% city: 3.1%
- Percentage of males in service occupations:
Here: 15.8% city: 14.3%
- Percentage of males in sales and office occupations:
Here: 16.2% city: 17.1%
- Percentage of males in construction, extraction, and maintenance occupations:
Here: 12.3% city: 6.0%
- Percentage of males in production occupations:
Here: 8.3% city: 7.5%
- Percentage of males in transportation occupations:
Here: 7.8% city: 6.8%
- Percentage of males in material moving occupations:
Here: 2.8% city: 9.6%
Occupations of females:
- Percentage of females in management occupations (except farmers):
Here: 9.3% city: 7.8%
- Percentage of females in business and financial operations occupations:
Here: 10.7% city: 5.5%
- Percentage of females in computer and mathematical occupations:
Here: 3.3% city: 2.1%
- Percentage of females in life, physical, and social science occupations:
Here: 1.6% city: 1.0%
- Percentage of females in community and social services occupations:
Here: 4.6% city: 3.2%
- Percentage of females in education, training, and library occupations:
Here: 6.9% city: 10.3%
- Percentage of females in arts, design, entertainment, sports, and media occupations:
Here: 1.4% city: 1.8%
- Percentage of females in healthcare practitioners and technical occupations:
Here: 10.6% city: 8.6%
- Percentage of females in service occupations:
Here: 18.0% city: 19.4%
- Percentage of females in sales and office occupations:
Here: 29.0% city: 29.0%
- Percentage of females in production occupations:
Here: 3.1% city: 5.2%
- Percentage of females in material moving occupations:
Here: 1.3% city: 2.7%
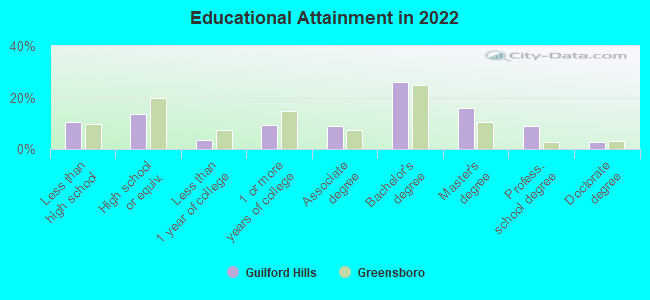
Education in this neighborhood (subdivision or community):
- Percentage of people 3 years and older in K-12 schools:
Guilford Hills: 19.2% Greensboro: 17.6%
- Percentage of people 3 years and older in undergraduate colleges:
Guilford Hills: 3.2% Greensboro: 11.2%
- Percentage of people 3 years and older in grad. or professional schools:
Guilford Hills: 1.9% Greensboro: 2.6%
- Percentage of students K-12 enrolled in private schools:
Guilford Hills: 30.6% Greensboro: 13.3%
Percentage of population below poverty level:
| Guilford Hills: | 15.7% |
| Greensboro: | 21.9% |
Median year owner moved in (as recorded in 2022):
Median year renter moved in (as recorded in 2022):
| Guilford Hills: | 2003 |
| Greensboro: | 2010 |
Median year renter moved in (as recorded in 2022):
| Guilford Hills: | 2014 |
| Greensboro: | 2020 |
Percentage of married-couple families with both working:
| Guilford Hills: | 113.7% |
| Greensboro: | 70.9% |
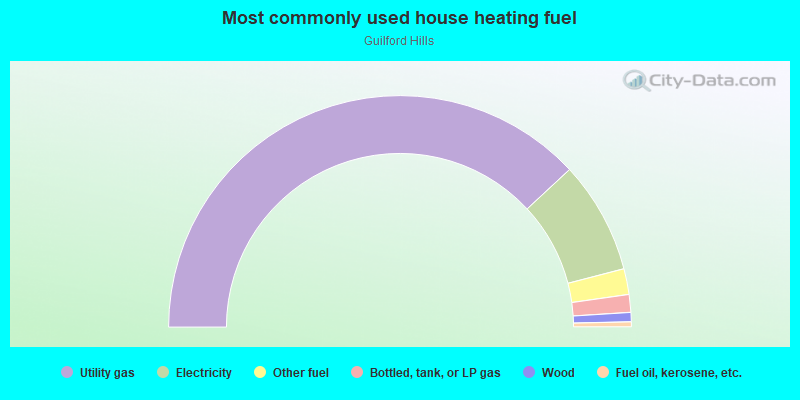
- 76.2%Utility gas
- 15.7%Electricity
- 3.6%Other fuel
- 2.5%Bottled, tank, or LP gas
- 1.3%Wood
- 0.7%Fuel oil, kerosene, etc.
Highways in this neighborhood:
US Hwy 220 (Battleground Ave)
Length: 0.31 miles
Direction: SE-NW
Address range: 2000 to 2359
Direction: SE-NW
Address range: 2000 to 2359
Roads and streets:
W Cornwallis Dr
Length: 0.88 miles
Directions: E-W, SW-NE
Address range: 2100 to 2699
Directions: E-W, SW-NE
Address range: 2100 to 2699
Fernwood Dr
Length: 0.82 miles
Direction: E-W
Address range: 2300 to 2607
Direction: E-W
Address range: 2300 to 2607
N Elam Ave
Length: 0.77 miles
Directions: N-S, SW-NE
Address range: 600 to 1599
Directions: N-S, SW-NE
Address range: 600 to 1599
Westmoreland Dr
Length: 0.58 miles
Directions: E-W, SW-NE
Address range: 2500 to 2715
Directions: E-W, SW-NE
Address range: 2500 to 2715
Surry Dr
Length: 0.55 miles
Directions: N-S, SE-NW
Address range: 1000 to 1399
Directions: N-S, SE-NW
Address range: 1000 to 1399
Quail Dr
Length: 0.45 miles
Directions: N-S, SE-NW
Address range: 1100 to 1799
Directions: N-S, SE-NW
Address range: 1100 to 1799
Pembroke Rd
Length: 0.42 miles
Directions: E-W, N-S, SW-NE
Address range: 1101 to 1399
Directions: E-W, N-S, SW-NE
Address range: 1101 to 1399
Overbrook Dr
Length: 0.41 miles
Direction: E-W
Address range: 2500 to 2699
Direction: E-W
Address range: 2500 to 2699
Albright Dr
Length: 0.38 miles
Direction: E-W
Address range: 2300 to 2399
Direction: E-W
Address range: 2300 to 2399
Netherwood Dr
Length: 0.37 miles
Directions: E-W, SW-NE
Address range: 2500 to 2699
Directions: E-W, SW-NE
Address range: 2500 to 2699
Shadylawn Dr
Length: 0.36 miles
Directions: N-S, SE-NW, SW-NE
Address range: 2500 to 2699
Directions: N-S, SE-NW, SW-NE
Address range: 2500 to 2699
Benjamin Pkwy
Length: 0.34 miles
Directions: SE-NW, SW-NE
Address range: 1500 to 1539
Directions: SE-NW, SW-NE
Address range: 1500 to 1539
Fortune Ln
Length: 0.33 miles
Direction: E-W
Address range: 2300 to 2399
Direction: E-W
Address range: 2300 to 2399
Timber Ln
Length: 0.30 miles
Directions: E-W, SW-NE
Address range: 2500 to 2599
Directions: E-W, SW-NE
Address range: 2500 to 2599
Gracewood Dr
Length: 0.29 miles
Directions: N-S, SE-NW
Address range: 1200 to 1405
Directions: N-S, SE-NW
Address range: 1200 to 1405
Woodview Dr
Length: 0.28 miles
Directions: E-W, SW-NE
Address range: 2500 to 2699
Directions: E-W, SW-NE
Address range: 2500 to 2699
Hill-N-Dale Dr
Length: 0.26 miles
Directions: N-S, SE-NW
Address range: 2600 to 2799
Directions: N-S, SE-NW
Address range: 2600 to 2799
Chatham Dr
Length: 0.24 miles
Directions: E-W, SE-NW
Address range: 2300 to 2499
Directions: E-W, SE-NW
Address range: 2300 to 2499
Honeysuckle Dr
Length: 0.24 miles
Directions: N-S, SW-NE
Address range: 800 to 1099
Directions: N-S, SW-NE
Address range: 800 to 1099
Pender Ln
Length: 0.21 miles
Directions: N-S, SE-NW, SW-NE
Address range: 1101 to 1199
Directions: N-S, SE-NW, SW-NE
Address range: 1101 to 1199
N Holden Rd
Length: 0.20 miles
Direction: E-W
Address range: 1700 to 1899
Direction: E-W
Address range: 1700 to 1899
Cherokee Dr
Length: 0.15 miles
Directions: E-W, SE-NW
Address range: 2300 to 2399
Directions: E-W, SE-NW
Address range: 2300 to 2399
Hiawatha Dr
Length: 0.15 miles
Direction: E-W
Address range: 2300 to 2399
Direction: E-W
Address range: 2300 to 2399
Bonaventure Rd
Length: 0.12 miles
Direction: SE-NW
Address range: 1500 to 1699
Direction: SE-NW
Address range: 1500 to 1699
Piper Pl
Length: 0.09 miles
Direction: N-S
Address range: 1600 to 1799
Direction: N-S
Address range: 1600 to 1799
David Caldwell Dr
Length: 0.07 miles
Direction: SW-NE
Address range: 2700 to 2799
Direction: SW-NE
Address range: 2700 to 2799