Greylands neighborhood in San Jose, California (CA), 95125 detailed profile
Settings
X

Business Search - 14 Million verified businesses
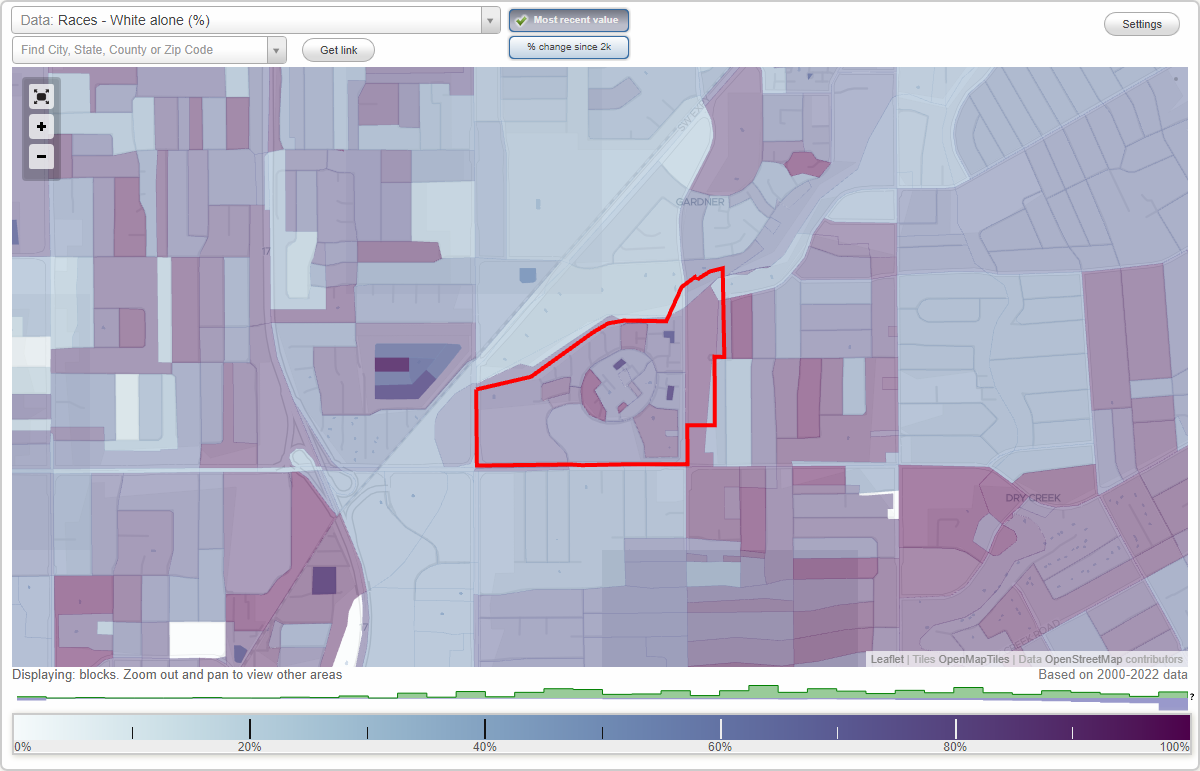
Area: 0.167 square miles
Population: 1,118
Population density:
| Greylands: | 6,693 people per square mile |
| San Jose: | 5,554 people per square mile |

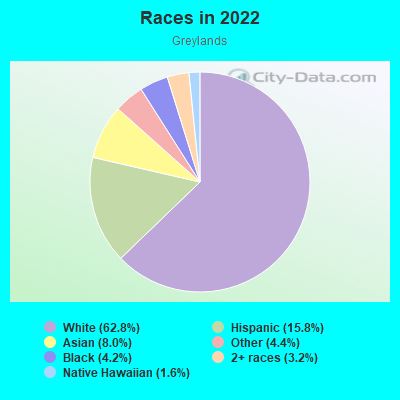
- 72962.8%White
- 18415.8%Hispanic or Latino
- 938.0%Asian
- 514.4%Some other race
- 494.2%Black
- 373.2%Two or more races
- 181.6%Native Hawaiian and Other
Pacific Islander
Median household income in 2022:
| Greylands: | $123,490 |
| San Jose: | $133,835 |
Distribution of median household income
![Distribution of median household income]()
- 41Less than $10,000
- 36$10,000 to $19,999
- 48$20,000 to $29,999
- 48$30,000 to $39,999
- 81$40,000 to $49,999
- 42$50,000 to $59,999
- 11$60,000 to $74,999
- 77$75,000 to $99,999
- 81$100,000 to $124,999
- 14$125,000 to $149,999
- 85$150,000 to $199,999
- 134$200,000 or more

Distribution of owner-occupied house/condo value
![Distribution of owner-occupied house/condo value]()
- 6Less than $50,000
- 21$50,000 to $99,999
- 9$200,000 to $249,999
- 21$500,000 to $749,999
- 198$750,000 to $999,999
- 160$1,000,000 or more

Distribution of rent paid by renters
![Distribution of rent paid by renters]()
- 33$200 to $299
- 12$300 to $399
- 12$500 to $599
- 18$1,000 to $1,249
- 10$1,250 to $1,499
- 46$1,500 to $1,999
- 233$2,000 or more

Median rent in 2022:
| Greylands: | $2,601 |
| San Jose: | $2,001 |
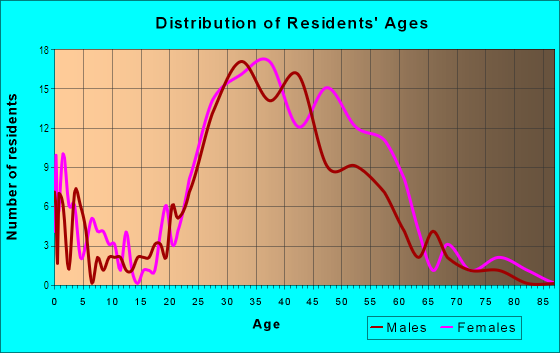
| Males: | 355 |
| Females: | 763 |
Males:
| This neighborhood: | 45.3 years |
| Whole city: | 37.6 years |
| This neighborhood: | 40.0 years |
| Whole city: | 39.1 years |
Average household size:
| Greylands: | 2.0 people |
| San Jose: | 2.9 people |
Percentage of family households:
| Greylands: | 32.4% |
| San Jose: | 49.9% |
| Here: | 22.4% |
| San Jose: | 53.0% |
Percentage of married-couple families with children (among all households):
| Greylands: | 14.8% |
| San Jose: | 25.8% |
Percentage of single-mother households (among all households):
| Greylands: | 24.6% |
| San Jose: | 5.2% |
Percentage of never married males 15 years old and over:
Percentage of never married females 15 years old and over:
| Greylands: | 14.7% |
| San Jose: | 20.9% |
Percentage of never married females 15 years old and over:
| Greylands: | 23.3% |
| city: | 16.7% |
Percentage of people that speak English not well or not at all:
| Greylands: | 7.2% |
| San Jose: | 11.4% |
Percentage of people born in this state:
Percentage of people born in another U.S. state:
Percentage of native residents but born outside the U.S.:
Percentage of foreign born residents:
| Here: | 56.2% |
| San Jose: | 46.1% |
Percentage of people born in another U.S. state:
| Greylands: | 18.0% |
| San Jose: | 10.4% |
Percentage of native residents but born outside the U.S.:
| Here: | 0.2% |
| city: | 1.7% |
Percentage of foreign born residents:
| Here: | 25.7% |
| San Jose: | 41.8% |
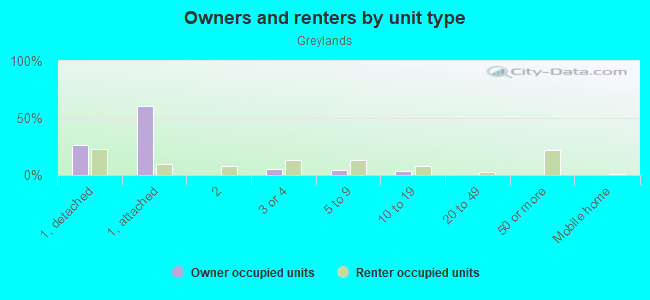
Owner-occupied
Renter-occupied

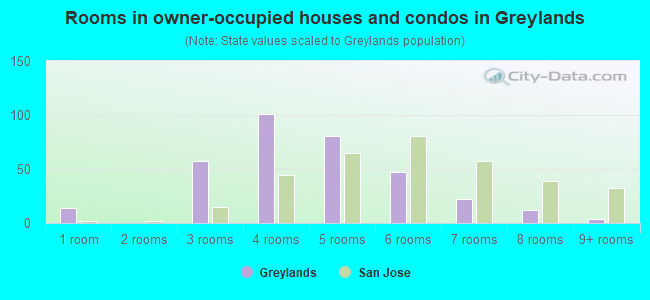
- Rooms in owner-occupied houses and condos in Greylands
- 141 room
- 02 rooms
- 573 rooms
- 1014 rooms
- 815 rooms
- 476 rooms
- 227 rooms
- 128 rooms
- 49+ rooms
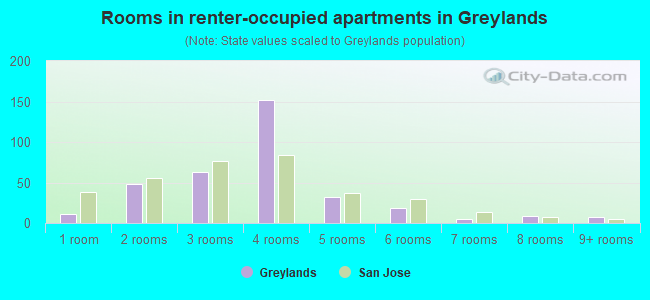
- Rooms in renter-occupied apartments in Greylands
- 111 room
- 482 rooms
- 633 rooms
- 1524 rooms
- 325 rooms
- 186 rooms
- 57 rooms
- 98 rooms
- 89+ rooms
Owner-occupied
Renter-occupied
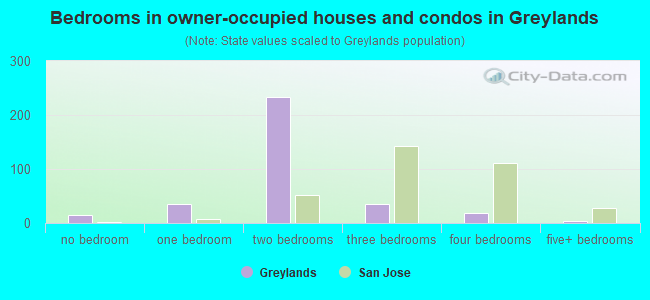
- Bedrooms in owner-occupied houses and condos in Greylands
- 14no bedroom
- 361 bedroom
- 2342 bedrooms
- 363 bedrooms
- 184 bedrooms
- 45+ bedrooms
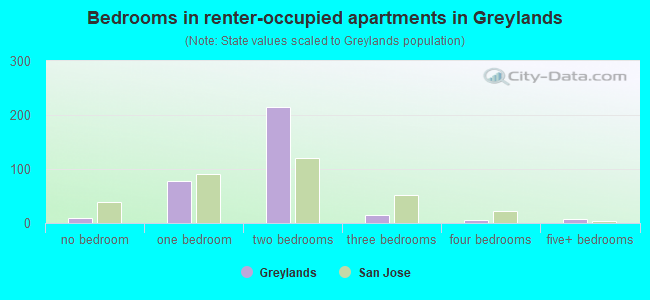
- Bedrooms in renter-occupied apartments in Greylands
- 9no bedroom
- 771 bedroom
- 2152 bedrooms
- 143 bedrooms
- 54 bedrooms
- 85+ bedrooms
Average number of cars or other vehicles available in houses/condos:
Average number of cars or other vehicles available in apartments:
| This neighborhood: | 1.3 |
| San Jose: | 2.3 |
Average number of cars or other vehicles available in apartments:
| Here: | 1.3 |
| city: | 1.6 |
Percentage of units with a mortgage:
| Greylands: | 76.0% |
| San Jose: | 66.9% |
Average estimated value of townhouses or other attached units in 2022 (43.3% of all units):
| This neighborhood: | $397,022 |
| city: | $1,024,857 |
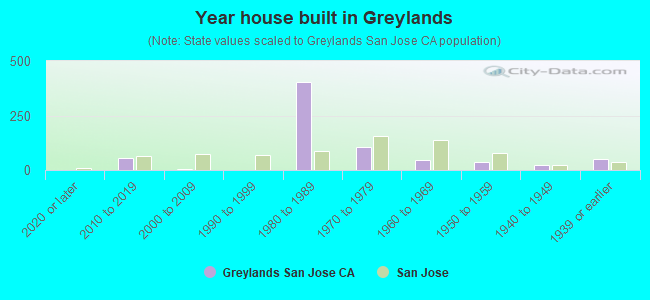
- Year house built in Greylands
- 02020 or later
- 542010 to 2019
- 42000 to 2009
- 01990 to 1999
- 4021980 to 1989
- 1071970 to 1979
- 481960 to 1969
- 371950 to 1959
- 241940 to 1949
- 521939 or earlier
City-data.com crime index for city in 2020 (higher means more crime):
| City: | 268.4 |
| U.S. average: | 219.5 |
Travel time to work (commute)
![Travel time to work (commute)]()
- 3Less than 5 minutes
- 285 to 9 minutes
- 10910 to 14 minutes
- 8315 to 19 minutes
- 6720 to 24 minutes
- 7525 to 29 minutes
- 8830 to 34 minutes
- 1635 to 39 minutes
- 3240 to 44 minutes
- 2445 to 59 minutes
- 760 to 89 minutes
- 3690 or more minutes

Means of transportation to work
![Means of transportation to work]()
- 65.9%392Drove a car alone
- 2.0%12Carpooled
- 9.9%59Bus
- 6.9%41Light rail, streetcar or trolley
- 1.7%10Bicycle
- 3.2%19Walked
- 19.8%118Worked at home

Time leaving home to go to work
![Time leaving home to go to work]()
- 365:30 a.m. to 5:59 a.m.
- 196:00 a.m. to 6:29 a.m.
- 496:30 a.m. to 6:59 a.m.
- 797:00 a.m. to 7:29 a.m.
- 1007:30 a.m. to 7:59 a.m.
- 888:00 a.m. to 8:29 a.m.
- 348:30 a.m. to 8:59 a.m.
- 899:00 a.m. to 9:59 a.m.
- 310:00 a.m. to 10:59 a.m.
- 2511:00 a.m. to 11:59 a.m.
- 7212:00 p.m. to 3:59 p.m.
- 34:00 p.m. to 11:59 p.m.

Occupations of males:
- Percentage of males in management occupations (except farmers):
Here: 20.5% city: 13.0%
- Percentage of males in business and financial operations occupations:
Here: 7.4% city: 4.6%
- Percentage of males in computer and mathematical occupations:
Here: 19.5% city: 13.6%
- Percentage of males in architecture and engineering occupations:
Here: 13.6% city: 10.2%
- Percentage of males in life, physical, and social science occupations:
Here: 4.4% city: 1.1%
- Percentage of males in education, training, and library occupations:
Here: 5.1% city: 2.8%
- Percentage of males in healthcare practitioners and technical occupations:
Here: 9.1% city: 2.0%
- Percentage of males in service occupations:
Here: 1.8% city: 12.7%
- Percentage of males in sales and office occupations:
Here: 3.1% city: 12.8%
- Percentage of males in farming, fishing, and forestry occupations:
Here: 1.2% city: 0.4%
- Percentage of males in transportation occupations:
Here: 1.3% city: 3.6%
Occupations of females:
- Percentage of females in management occupations (except farmers):
Here: 5.6% city: 11.0%
- Percentage of females in business and financial operations occupations:
Here: 8.1% city: 8.6%
- Percentage of females in computer and mathematical occupations:
Here: 4.7% city: 5.4%
- Percentage of females in architecture and engineering occupations:
Here: 5.3% city: 2.8%
- Percentage of females in life, physical, and social science occupations:
Here: 2.1% city: 1.7%
- Percentage of females in legal occupations:
Here: 9.8% city: 1.3%
- Percentage of females in education, training, and library occupations:
Here: 19.1% city: 8.1%
- Percentage of females in arts, design, entertainment, sports, and media occupations:
Here: 12.2% city: 2.0%
- Percentage of females in healthcare practitioners and technical occupations:
Here: 7.6% city: 6.8%
- Percentage of females in service occupations:
Here: 8.8% city: 21.7%
- Percentage of females in sales and office occupations:
Here: 18.8% city: 22.0%
- Percentage of females in material moving occupations:
Here: 1.0% city: 1.5%
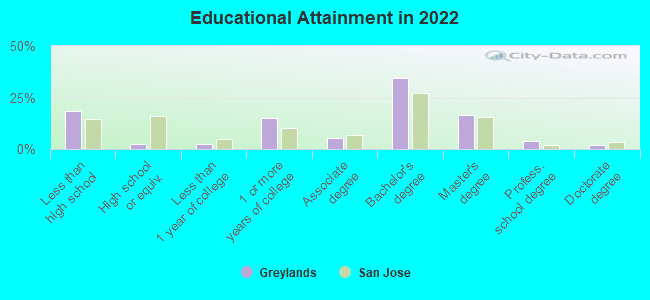
Education in this neighborhood (subdivision or community):
- Percentage of people 3 years and older in K-12 schools:
Greylands: 14.9% San Jose: 16.1%
- Percentage of people 3 years and older in undergraduate colleges:
Greylands: 4.8% San Jose: 6.5%
- Percentage of people 3 years and older in grad. or professional schools:
Greylands: 1.6% San Jose: 2.0%
- Percentage of students K-12 enrolled in private schools:
Greylands: 16.8% San Jose: 14.9%
Percentage of population below poverty level:
| Greylands: | 9.5% |
| San Jose: | 9.0% |
Median year owner moved in (as recorded in 2022):
Median year renter moved in (as recorded in 2022):
| Greylands: | 2009 |
| San Jose: | 2008 |
Median year renter moved in (as recorded in 2022):
| Greylands: | 2018 |
| San Jose: | 2020 |
Percentage of married-couple families with both working:
| Greylands: | 91.1% |
| San Jose: | 72.5% |
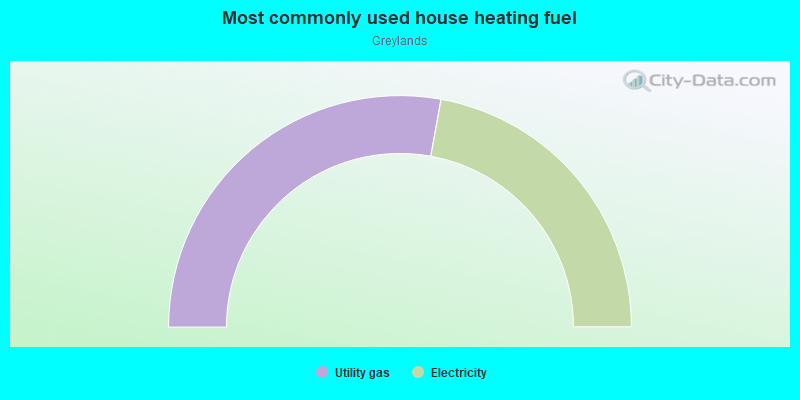
- 55.7%Utility gas
- 44.3%Electricity
Roads and streets:
Hamilton Pl
Length: 0.72 miles
Directions: E-W, N-S, SE-NW, SW-NE
Directions: E-W, N-S, SE-NW, SW-NE
Braddock Ct
Length: 0.40 miles
Directions: E-W, N-S, SE-NW, SW-NE
Address range: 1600 to 1898
Directions: E-W, N-S, SE-NW, SW-NE
Address range: 1600 to 1898
Huxley Ct
Length: 0.22 miles
Directions: E-W, N-S, SE-NW, SW-NE
Address range: 181 to 1999
Directions: E-W, N-S, SE-NW, SW-NE
Address range: 181 to 1999
Weibel Way
Length: 0.21 miles
Directions: E-W, N-S, SE-NW, SW-NE
Address range: 1200 to 1299
Directions: E-W, N-S, SE-NW, SW-NE
Address range: 1200 to 1299
Leigh Ave
Length: 0.19 miles
Direction: N-S
Address range: 1282 to 1399
Direction: N-S
Address range: 1282 to 1399
Wente Way (Wente Pl)
Length: 0.15 miles
Directions: E-W, N-S, SE-NW, SW-NE
Address range: 2000 to 2099
Directions: E-W, N-S, SE-NW, SW-NE
Address range: 2000 to 2099
Foxhall Loop
Length: 0.14 miles
Directions: N-S, SE-NW, SW-NE
Address range: 1900 to 2098
Directions: N-S, SE-NW, SW-NE
Address range: 1900 to 2098
Greenwich Ct
Length: 0.14 miles
Directions: E-W, N-S, SE-NW, SW-NE
Address range: 1312 to 1399
Directions: E-W, N-S, SE-NW, SW-NE
Address range: 1312 to 1399
Donovan Ct
Length: 0.10 miles
Directions: E-W, N-S, SE-NW, SW-NE
Address range: 2000 to 2099
Directions: E-W, N-S, SE-NW, SW-NE
Address range: 2000 to 2099
Keenan Way
Length: 0.10 miles
Directions: N-S, SE-NW
Address range: 1300 to 1399
Directions: N-S, SE-NW
Address range: 1300 to 1399
Wente Way
Length: 0.10 miles
Directions: E-W, SW-NE
Address range: 2000 to 2099
Directions: E-W, SW-NE
Address range: 2000 to 2099
Greylands Dr
Length: 0.09 miles
Directions: E-W, SW-NE
Directions: E-W, SW-NE
Willow St
Length: 0.08 miles
Directions: E-W, SW-NE
Address range: 1950 to 1999
Directions: E-W, SW-NE
Address range: 1950 to 1999
Chandon Ct
Length: 0.06 miles
Directions: E-W, N-S, SE-NW
Address range: 1301 to 1399
Directions: E-W, N-S, SE-NW
Address range: 1301 to 1399
Beaulieu Ct
Length: 0.06 miles
Directions: E-W, N-S
Address range: 1200 to 1299
Directions: E-W, N-S
Address range: 1200 to 1299
Deloach Ct
Length: 0.05 miles
Directions: E-W, N-S, SE-NW
Address range: 1316 to 1353
Directions: E-W, N-S, SE-NW
Address range: 1316 to 1353
Ashmeade Ct
Length: 0.04 miles
Directions: E-W, N-S
Address range: 1800 to 1899
Directions: E-W, N-S
Address range: 1800 to 1899
Fetzer Dr
Length: 0.03 miles
Direction: E-W
Direction: E-W
Beringer Ct
Length: 0.02 miles
Directions: N-S, SE-NW
Address range: 1401 to 1499
Directions: N-S, SE-NW
Address range: 1401 to 1499
Other features:
Los Gatos Crk
Length: 0.12 miles
Direction: SW-NE
Direction: SW-NE