Greenspring neighborhood in Baltimore, Maryland (MD), 21215 detailed profile
Settings
X

Business Search - 14 Million verified businesses
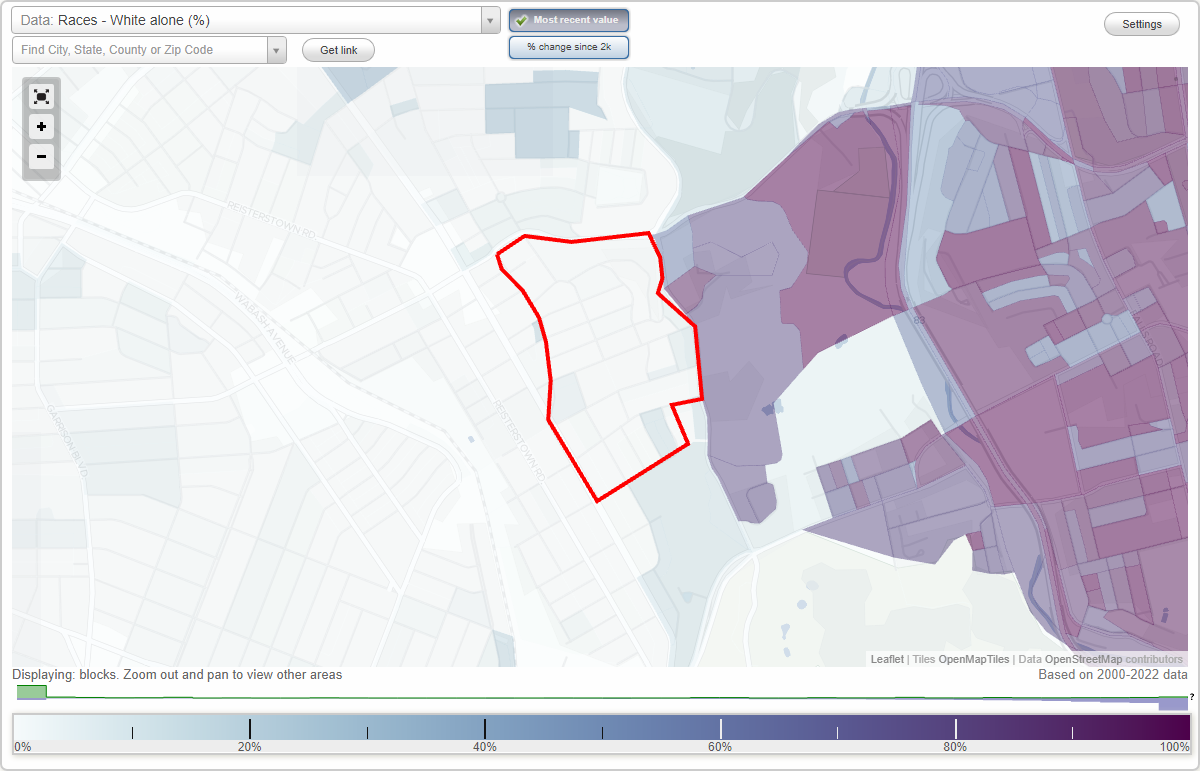
Area: 0.175 square miles
Population: 4,411
Population density:
| Greenspring: | 25,171 people per square mile |
| Baltimore: | 7,053 people per square mile |

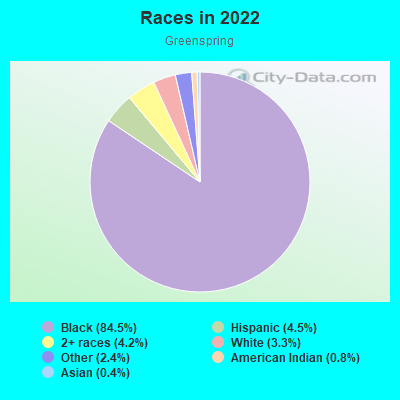
- 3,98784.5%Black
- 2114.5%Hispanic or Latino
- 1974.2%Two or more races
- 1543.3%White
- 1122.4%Some other race
- 360.8%American Indian
- 200.4%Asian
- 10.02%Native Hawaiian and Other
Pacific Islander
Distribution of median household income
![Distribution of median household income]()
- 333Less than $10,000
- 247$10,000 to $19,999
- 91$20,000 to $29,999
- 310$30,000 to $39,999
- 246$40,000 to $49,999
- 164$50,000 to $59,999
- 98$60,000 to $74,999
- 140$75,000 to $99,999
- 147$100,000 to $124,999
- 62$125,000 to $149,999
- 64$150,000 to $199,999
- 118$200,000 or more

Distribution of owner-occupied house/condo value
![Distribution of owner-occupied house/condo value]()
- 495Less than $50,000
- 299$50,000 to $99,999
- 182$100,000 to $149,999
- 59$150,000 to $199,999
- 76$200,000 to $249,999
- 43$250,000 to $299,999
- 99$300,000 to $399,999
- 77$400,000 to $499,999
- 137$500,000 to $749,999
- 2$750,000 to $999,999

Distribution of rent paid by renters
![Distribution of rent paid by renters]()
- 175Less than $100
- 206$100 to $199
- 223$200 to $299
- 176$300 to $399
- 391$400 to $499
- 79$500 to $599
- 126$600 to $699
- 62$700 to $799
- 99$800 to $899
- 92$900 to $999
- 179$1,000 to $1,249
- 71$1,250 to $1,499
- 73$1,500 to $1,999
- 17$2,000 or more

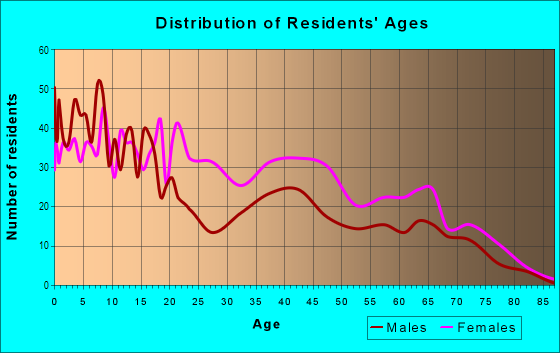
| Males: | 1,690 |
| Females: | 2,720 |
Males:
| This neighborhood: | 44.8 years |
| Whole city: | 35.0 years |
| This neighborhood: | 46.4 years |
| Whole city: | 38.2 years |
Average household size:
| Greenspring: | 2.4 people |
| Baltimore: | 2.2 people |
Percentage of family households:
| Greenspring: | 31.5% |
| Baltimore: | 34.2% |
| Here: | 17.5% |
| Baltimore: | 23.3% |
Percentage of married-couple families with children (among all households):
| Greenspring: | 22.4% |
| Baltimore: | 22.4% |
Percentage of single-mother households (among all households):
| Greenspring: | 21.5% |
| Baltimore: | 18.7% |
Percentage of never married males 15 years old and over:
Percentage of never married females 15 years old and over:
| Greenspring: | 27.2% |
| Baltimore: | 25.1% |
Percentage of never married females 15 years old and over:
| Greenspring: | 30.5% |
| city: | 27.5% |
Percentage of people that speak English not well or not at all:
| Greenspring: | 2.0% |
| Baltimore: | 2.3% |
Percentage of people born in this state:
Percentage of people born in another U.S. state:
Percentage of native residents but born outside the U.S.:
Percentage of foreign born residents:
| Here: | 68.3% |
| Baltimore: | 64.4% |
Percentage of people born in another U.S. state:
| Greenspring: | 23.2% |
| Baltimore: | 25.0% |
Percentage of native residents but born outside the U.S.:
| Here: | 0.6% |
| city: | 0.9% |
Percentage of foreign born residents:
| Here: | 8.3% |
| Baltimore: | 9.7% |
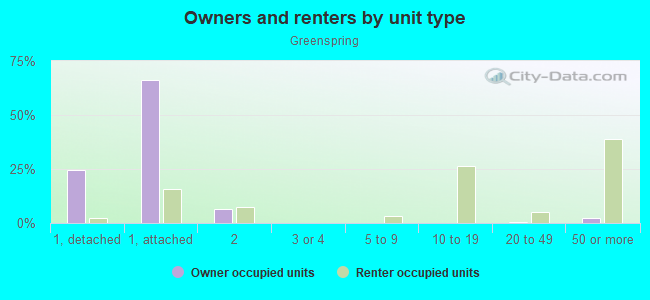
Owner-occupied
Renter-occupied

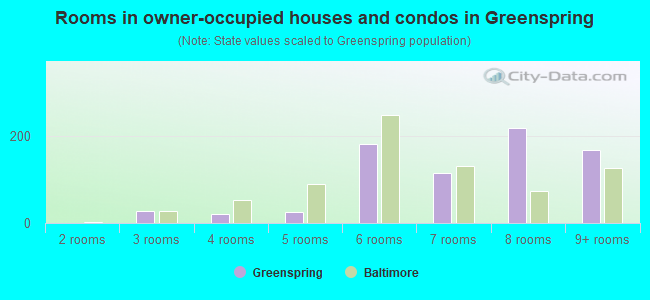
- Rooms in owner-occupied houses and condos in Greenspring
- 11 room
- 02 rooms
- 273 rooms
- 214 rooms
- 255 rooms
- 1826 rooms
- 1147 rooms
- 2188 rooms
- 1689+ rooms
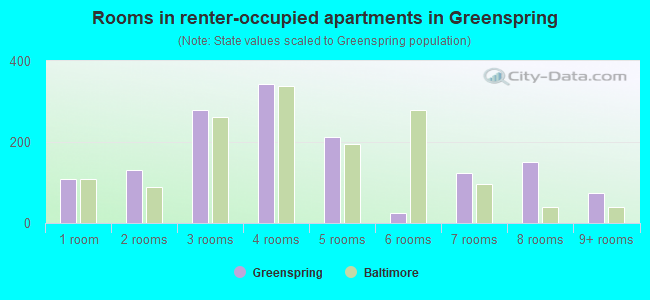
- Rooms in renter-occupied apartments in Greenspring
- 1081 room
- 1322 rooms
- 2783 rooms
- 3444 rooms
- 2135 rooms
- 256 rooms
- 1237 rooms
- 1508 rooms
- 749+ rooms
Owner-occupied
Renter-occupied
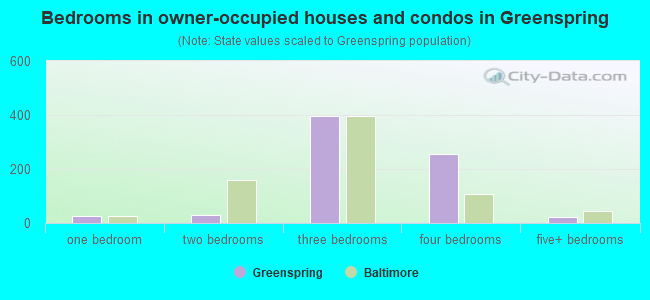
- Bedrooms in owner-occupied houses and condos in Greenspring
- 1no bedroom
- 261 bedroom
- 312 bedrooms
- 3983 bedrooms
- 2564 bedrooms
- 245+ bedrooms
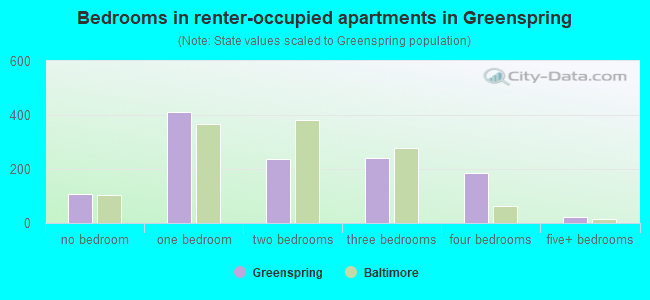
- Bedrooms in renter-occupied apartments in Greenspring
- 108no bedroom
- 4101 bedroom
- 2372 bedrooms
- 2413 bedrooms
- 1854 bedrooms
- 225+ bedrooms
Average number of cars or other vehicles available in houses/condos:
Average number of cars or other vehicles available in apartments:
| This neighborhood: | 1.1 |
| Baltimore: | 1.5 |
Average number of cars or other vehicles available in apartments:
| Here: | 0.4 |
| city: | 0.8 |
Percentage of units with a mortgage:
| Greenspring: | 76.8% |
| Baltimore: | 64.3% |
Average estimated value of townhouses or other attached units in 2022 (61.4% of all units):
| This neighborhood: | $100,868 |
| city: | $206,258 |
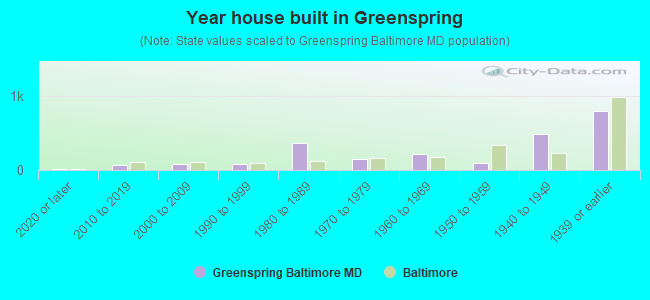
- Year house built in Greenspring
- 72020 or later
- 692010 to 2019
- 772000 to 2009
- 761990 to 1999
- 3621980 to 1989
- 1431970 to 1979
- 2091960 to 1969
- 991950 to 1959
- 4811940 to 1949
- 7991939 or earlier
Travel time to work (commute)
![Travel time to work (commute)]()
- 25Less than 5 minutes
- 205 to 9 minutes
- 7110 to 14 minutes
- 7515 to 19 minutes
- 22020 to 24 minutes
- 10525 to 29 minutes
- 20330 to 34 minutes
- 2035 to 39 minutes
- 3640 to 44 minutes
- 27645 to 59 minutes
- 12560 to 89 minutes
- 2390 or more minutes

Means of transportation to work
![Means of transportation to work]()
- 39.2%631Drove a car alone
- 5.4%87Carpooled
- 18.1%291Bus
- 17.0%273Subway or elevated rail
- 0.9%15Long-distance train or commuter rail
- 0.4%6Light rail, streetcar or trolley
- 17.1%276Taxi
- 5.5%88Bicycle
- 0.3%5Walked
- 1.7%27Other means
- 11.9%191Worked at home

Time leaving home to go to work
![Time leaving home to go to work]()
- 2512:00 a.m. to 4:59 a.m.
- 785:00 a.m. to 5:29 a.m.
- 745:30 a.m. to 5:59 a.m.
- 1086:00 a.m. to 6:29 a.m.
- 646:30 a.m. to 6:59 a.m.
- 587:00 a.m. to 7:29 a.m.
- 347:30 a.m. to 7:59 a.m.
- 858:00 a.m. to 8:29 a.m.
- 118:30 a.m. to 8:59 a.m.
- 1569:00 a.m. to 9:59 a.m.
- 4610:00 a.m. to 10:59 a.m.
- 1611:00 a.m. to 11:59 a.m.
- 5412:00 p.m. to 3:59 p.m.
- 2034:00 p.m. to 11:59 p.m.

Occupations of males:
- Percentage of males in management occupations (except farmers):
Here: 1.4% city: 10.7%
- Percentage of males in business and financial operations occupations:
Here: 6.1% city: 5.9%
- Percentage of males in computer and mathematical occupations:
Here: 19.3% city: 6.1%
- Percentage of males in community and social services occupations:
Here: 3.0% city: 1.6%
- Percentage of males in education, training, and library occupations:
Here: 10.6% city: 5.4%
- Percentage of males in healthcare practitioners and technical occupations:
Here: 4.6% city: 4.0%
- Percentage of males in service occupations:
Here: 8.9% city: 14.7%
- Percentage of males in sales and office occupations:
Here: 2.3% city: 14.2%
- Percentage of males in production occupations:
Here: 26.1% city: 4.2%
- Percentage of males in transportation occupations:
Here: 14.7% city: 6.8%
- Percentage of males in material moving occupations:
Here: 1.6% city: 7.0%
Occupations of females:
- Percentage of females in management occupations (except farmers):
Here: 9.6% city: 10.1%
- Percentage of females in computer and mathematical occupations:
Here: 4.6% city: 2.4%
- Percentage of females in life, physical, and social science occupations:
Here: 1.0% city: 2.5%
- Percentage of females in community and social services occupations:
Here: 3.6% city: 3.6%
- Percentage of females in education, training, and library occupations:
Here: 10.1% city: 10.7%
- Percentage of females in arts, design, entertainment, sports, and media occupations:
Here: 4.4% city: 2.4%
- Percentage of females in healthcare practitioners and technical occupations:
Here: 7.6% city: 9.8%
- Percentage of females in service occupations:
Here: 42.7% city: 20.4%
- Percentage of females in sales and office occupations:
Here: 16.0% city: 22.3%
- Percentage of females in transportation occupations:
Here: 4.4% city: 1.7%
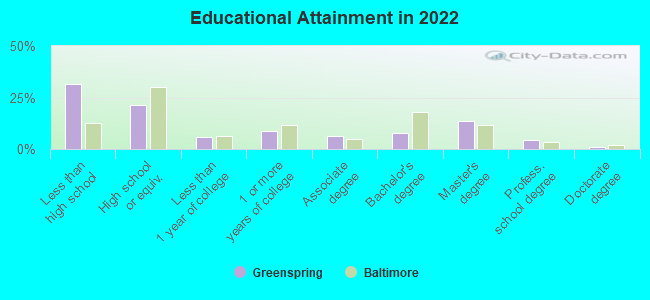
Education in this neighborhood (subdivision or community):
- Percentage of people 3 years and older in K-12 schools:
Greenspring: 26.0% Baltimore: 14.7%
- Percentage of people 3 years and older in undergraduate colleges:
Greenspring: 8.3% Baltimore: 6.0%
- Percentage of people 3 years and older in grad. or professional schools:
Greenspring: 5.0% Baltimore: 2.8%
- Percentage of students K-12 enrolled in private schools:
Greenspring: 10.3% Baltimore: 12.7%
Percentage of population below poverty level:
| Greenspring: | 22.7% |
| Baltimore: | 18.5% |
Median year owner moved in (as recorded in 2022):
Median year renter moved in (as recorded in 2022):
| Greenspring: | 2000 |
| Baltimore: | 2009 |
Median year renter moved in (as recorded in 2022):
| Greenspring: | 2016 |
| Baltimore: | 2019 |
Percentage of married-couple families with both working:
| Greenspring: | 152.2% |
| Baltimore: | 79.2% |
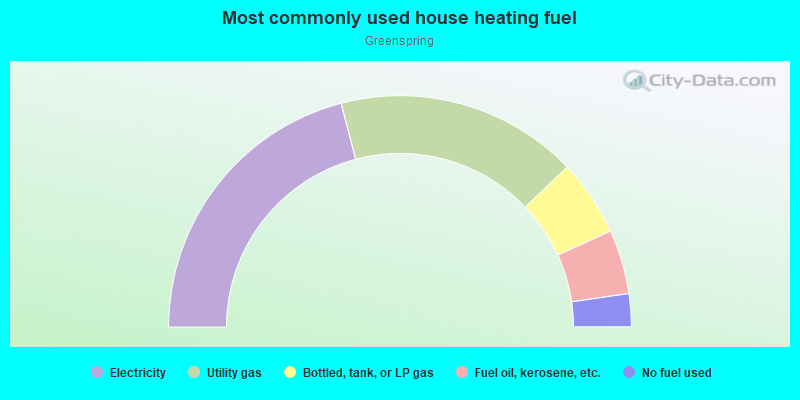
- 41.8%Electricity
- 33.9%Utility gas
- 10.7%Bottled, tank, or LP gas
- 9.0%Fuel oil, kerosene, etc.
- 4.6%No fuel used
Roads and streets:
Pall Mall Rd
Length: 0.58 miles
Direction: SE-NW
Address range: 3800 to 4437
Direction: SE-NW
Address range: 3800 to 4437
Shirley Ave
Length: 0.41 miles
Directions: E-W, SW-NE
Address range: 2400 to 2653
Directions: E-W, SW-NE
Address range: 2400 to 2653
Roland View Ave
Length: 0.39 miles
Directions: E-W, N-S, SE-NW, SW-NE
Address range: 3800 to 4299
Directions: E-W, N-S, SE-NW, SW-NE
Address range: 3800 to 4299
Oswego Ave
Length: 0.37 miles
Direction: E-W
Address range: 2300 to 2634
Direction: E-W
Address range: 2300 to 2634
Keyworth Ave
Length: 0.36 miles
Directions: E-W, SW-NE
Address range: 2400 to 2651
Directions: E-W, SW-NE
Address range: 2400 to 2651
Cottage Ave
Length: 0.30 miles
Direction: SE-NW
Address range: 3800 to 4099
Direction: SE-NW
Address range: 3800 to 4099
Loyola Northway
Length: 0.27 miles
Directions: E-W, SE-NW, SW-NE
Address range: 2400 to 2648
Directions: E-W, SE-NW, SW-NE
Address range: 2400 to 2648
Derby Manor Dr
Length: 0.22 miles
Directions: N-S, SE-NW, SW-NE
Address range: 3700 to 4099
Directions: N-S, SE-NW, SW-NE
Address range: 3700 to 4099
Loyola Southway
Length: 0.21 miles
Directions: E-W, SW-NE
Address range: 2412 to 2599
Directions: E-W, SW-NE
Address range: 2412 to 2599
Springhill Ave
Length: 0.20 miles
Direction: SW-NE
Address range: 2406 to 2651
Direction: SW-NE
Address range: 2406 to 2651
Greenspring Ave
Length: 0.16 miles
Directions: N-S, SE-NW
Address range: 3900 to 4099
Directions: N-S, SE-NW
Address range: 3900 to 4099
Quantico Ave
Length: 0.13 miles
Direction: E-W
Address range: 2500 to 2599
Direction: E-W
Address range: 2500 to 2599
Park Heights Ter
Length: 0.13 miles
Direction: E-W
Address range: 2500 to 2601
Direction: E-W
Address range: 2500 to 2601
Boarman Ave
Length: 0.09 miles
Direction: SW-NE
Address range: 2500 to 2599
Direction: SW-NE
Address range: 2500 to 2599
Spruce Dr
Length: 0.09 miles
Direction: N-S
Address range: 4000 to 4099
Direction: N-S
Address range: 4000 to 4099
Oswego Ct
Length: 0.06 miles
Direction: SE-NW
Address range: 4000 to 4099
Direction: SE-NW
Address range: 4000 to 4099
Hampton Pl
Length: 0.06 miles
Directions: E-W, SE-NW
Directions: E-W, SE-NW
Pimlico Rd
Length: 0.01 miles
Direction: SE-NW
Address range: 4314 to 4331
Direction: SE-NW
Address range: 4314 to 4331