Greenhollow Addition neighborhood in Plano, Texas (TX), 75075 detailed profile
Settings
X


Business Search - 14 Million verified businesses
Area: 0.099 square miles
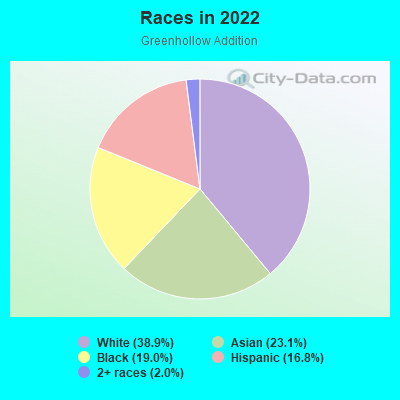
Population: 684
Population density:
| Greenhollow Addition: | 6,880 people per square mile |
| Plano: | 4,054 people per square mile |

- 26638.9%White
- 15823.1%Asian
- 13019.0%Black
- 11516.8%Hispanic or Latino
- 142.0%Two or more races

Median household income in 2022:
| Greenhollow Addition: | $72,212 |
| Plano: | $103,916 |
Distribution of median household income
![Distribution of median household income]()
- 12Less than $10,000
- 19$20,000 to $29,999
- 15$40,000 to $49,999
- 43$50,000 to $59,999
- 27$60,000 to $74,999
- 31$75,000 to $99,999
- 24$100,000 to $124,999
- 24$125,000 to $149,999
- 15$150,000 to $199,999
- 5$200,000 or more

Distribution of owner-occupied house/condo value
![Distribution of owner-occupied house/condo value]()
- 3$200,000 to $249,999
- 22$250,000 to $299,999
- 18$300,000 to $399,999
- 11$400,000 to $499,999
- 17$500,000 to $749,999
- 6$750,000 to $999,999

Distribution of rent paid by renters
![Distribution of rent paid by renters]()
- 6Less than $100
- 13$1,000 to $1,249
- 63$1,250 to $1,499
- 33$1,500 to $1,999
- 37$2,000 or more

Median rent in 2022:
| Greenhollow Addition: | $1,476 |
| Plano: | $1,546 |
| Males: | 366 |
| Females: | 318 |
Males:
| This neighborhood: | 35.1 years |
| Whole city: | 37.6 years |
| This neighborhood: | 41.1 years |
| Whole city: | 40.3 years |
Average household size:
| Greenhollow Addition: | 3.2 people |
| Plano: | 2.6 people |
Percentage of family households:
| Greenhollow Addition: | 68.2% |
| Plano: | 51.7% |
| Here: | 57.9% |
| Plano: | 55.6% |
Percentage of married-couple families with children (among all households):
| Greenhollow Addition: | 27.4% |
| Plano: | 31.0% |
Percentage of single-mother households (among all households):
| Greenhollow Addition: | 2.2% |
| Plano: | 5.3% |
Percentage of never married males 15 years old and over:
Percentage of never married females 15 years old and over:
| Greenhollow Addition: | 23.7% |
| Plano: | 16.2% |
Percentage of never married females 15 years old and over:
| Greenhollow Addition: | 8.9% |
| city: | 13.0% |
Percentage of people that speak English not well or not at all:
| Greenhollow Addition: | 13.7% |
| Plano: | 4.3% |
Percentage of people born in this state:
Percentage of people born in another U.S. state:
Percentage of native residents but born outside the U.S.:
Percentage of foreign born residents:
| Here: | 34.6% |
| Plano: | 40.4% |
Percentage of people born in another U.S. state:
| Greenhollow Addition: | 37.8% |
| Plano: | 31.4% |
Percentage of native residents but born outside the U.S.:
| Here: | 1.5% |
| city: | 1.6% |
Percentage of foreign born residents:
| Here: | 26.2% |
| Plano: | 26.6% |
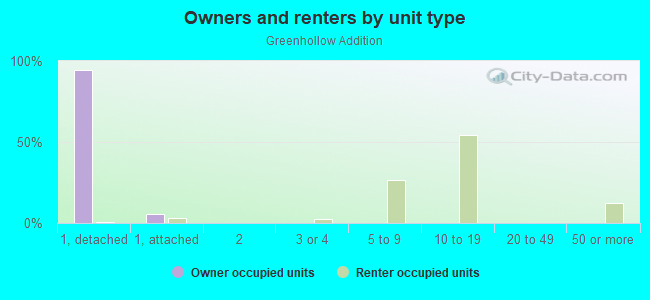
Owner-occupied
Renter-occupied

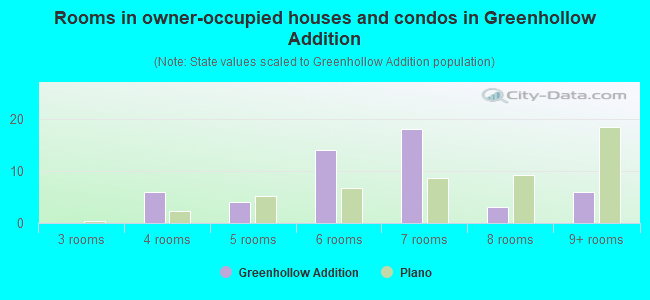
- Rooms in owner-occupied houses and condos in Greenhollow Addition
- 01 room
- 02 rooms
- 03 rooms
- 64 rooms
- 45 rooms
- 146 rooms
- 187 rooms
- 38 rooms
- 69+ rooms
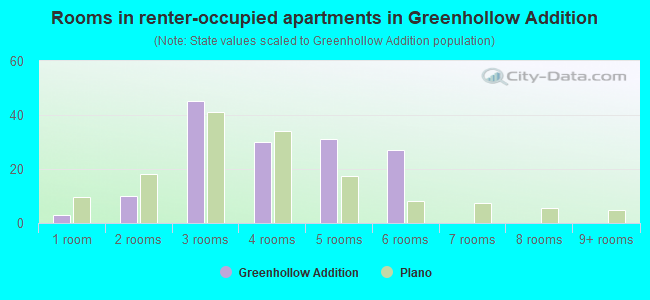
- Rooms in renter-occupied apartments in Greenhollow Addition
- 31 room
- 102 rooms
- 453 rooms
- 304 rooms
- 315 rooms
- 276 rooms
- 07 rooms
- 08 rooms
- 09+ rooms
Owner-occupied
Renter-occupied
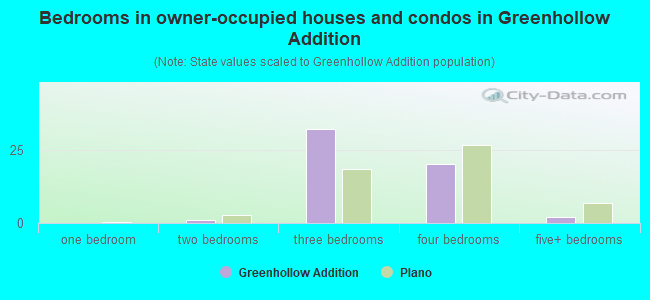
- Bedrooms in owner-occupied houses and condos in Greenhollow Addition
- 0no bedroom
- 01 bedroom
- 12 bedrooms
- 323 bedrooms
- 204 bedrooms
- 25+ bedrooms
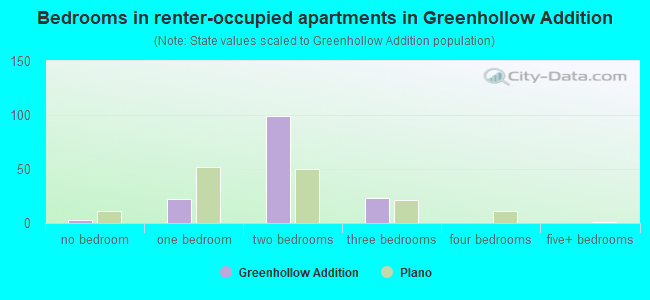
- Bedrooms in renter-occupied apartments in Greenhollow Addition
- 3no bedroom
- 221 bedroom
- 992 bedrooms
- 233 bedrooms
- 04 bedrooms
- 05+ bedrooms
Average number of cars or other vehicles available in houses/condos:
Average number of cars or other vehicles available in apartments:
| This neighborhood: | 2.0 |
| Plano: | 2.0 |
Average number of cars or other vehicles available in apartments:
| Here: | 1.7 |
| city: | 1.5 |
Percentage of units with a mortgage:
| Greenhollow Addition: | 42.2% |
| Plano: | 60.1% |
Average estimated value of detached houses in 2022 (29.5% of all units):
| Greenhollow Addition: | $330,759 |
| Plano: | $468,209 |
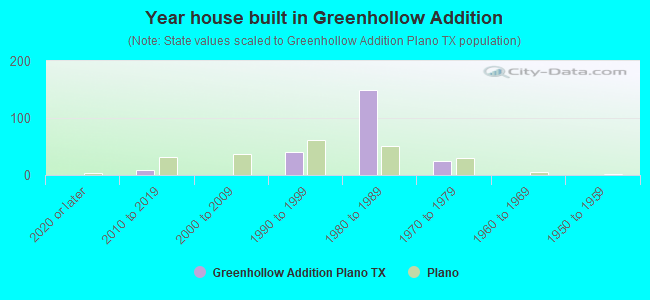
- Year house built in Greenhollow Addition
- 02020 or later
- 92010 to 2019
- 02000 to 2009
- 411990 to 1999
- 1501980 to 1989
- 251970 to 1979
- 01960 to 1969
- 01950 to 1959
- 01940 to 1949
- 01939 or earlier
City-data.com crime index for city in 2020 (higher means more crime):
| City: | 135.9 |
| U.S. average: | 219.5 |
Travel time to work (commute)
![Travel time to work (commute)]()
- 1Less than 5 minutes
- 245 to 9 minutes
- 1910 to 14 minutes
- 3215 to 19 minutes
- 3320 to 24 minutes
- 1925 to 29 minutes
- 4930 to 34 minutes
- 235 to 39 minutes
- 140 to 44 minutes
- 645 to 59 minutes
- 2460 to 89 minutes
- 390 or more minutes

Means of transportation to work
![Means of transportation to work]()
- 78.9%271Drove a car alone
- 7.3%25Carpooled
- 0.3%1Light rail, streetcar or trolley
- 0.6%2Motorcycle
- 0.3%1Walked
- 0.6%2Other means
- 11.9%41Worked at home

Time leaving home to go to work
![Time leaving home to go to work]()
- 712:00 a.m. to 4:59 a.m.
- 45:00 a.m. to 5:29 a.m.
- 105:30 a.m. to 5:59 a.m.
- 236:00 a.m. to 6:29 a.m.
- 276:30 a.m. to 6:59 a.m.
- 247:00 a.m. to 7:29 a.m.
- 357:30 a.m. to 7:59 a.m.
- 418:00 a.m. to 8:29 a.m.
- 148:30 a.m. to 8:59 a.m.
- 139:00 a.m. to 9:59 a.m.
- 1112:00 p.m. to 3:59 p.m.
- 164:00 p.m. to 11:59 p.m.

Occupations of males:
- Percentage of males in management occupations (except farmers):
Here: 18.3% city: 18.2%
- Percentage of males in business and financial operations occupations:
Here: 1.8% city: 8.9%
- Percentage of males in computer and mathematical occupations:
Here: 1.2% city: 15.9%
- Percentage of males in architecture and engineering occupations:
Here: 4.3% city: 4.9%
- Percentage of males in education, training, and library occupations:
Here: 2.6% city: 2.8%
- Percentage of males in arts, design, entertainment, sports, and media occupations:
Here: 7.0% city: 2.2%
- Percentage of males in healthcare practitioners and technical occupations:
Here: 1.6% city: 3.3%
- Percentage of males in service occupations:
Here: 22.0% city: 9.9%
- Percentage of males in sales and office occupations:
Here: 26.2% city: 17.0%
- Percentage of males in construction, extraction, and maintenance occupations:
Here: 4.1% city: 4.2%
- Percentage of males in production occupations:
Here: 7.4% city: 3.0%
- Percentage of males in transportation occupations:
Here: 1.8% city: 2.4%
Occupations of females:
- Percentage of females in management occupations (except farmers):
Here: 4.2% city: 12.6%
- Percentage of females in business and financial operations occupations:
Here: 4.8% city: 11.2%
- Percentage of females in computer and mathematical occupations:
Here: 3.1% city: 5.7%
- Percentage of females in education, training, and library occupations:
Here: 15.1% city: 9.5%
- Percentage of females in healthcare practitioners and technical occupations:
Here: 10.1% city: 9.7%
- Percentage of females in service occupations:
Here: 19.0% city: 14.0%
- Percentage of females in sales and office occupations:
Here: 34.1% city: 25.7%
- Percentage of females in production occupations:
Here: 7.1% city: 1.7%
- Percentage of females in transportation occupations:
Here: 1.2% city: 0.6%
- Percentage of females in material moving occupations:
Here: 2.4% city: 0.8%
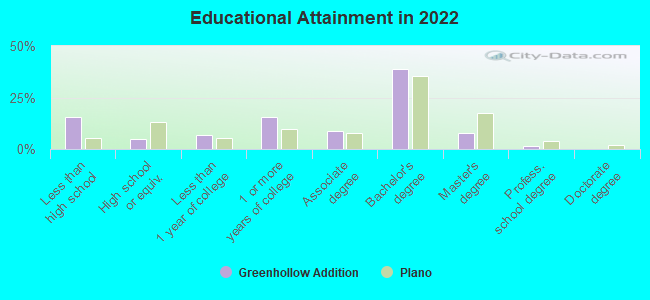
Education in this neighborhood (subdivision or community):
- Percentage of people 3 years and older in K-12 schools:
Greenhollow Addition: 21.0% Plano: 16.8%
- Percentage of people 3 years and older in undergraduate colleges:
Greenhollow Addition: 5.8% Plano: 4.2%
- Percentage of people 3 years and older in grad. or professional schools:
Greenhollow Addition: 0.1% Plano: 1.7%
- Percentage of students K-12 enrolled in private schools:
Greenhollow Addition: 2.1% Plano: 11.2%
Percentage of population below poverty level:
| Greenhollow Addition: | 1.4% |
| Plano: | 4.9% |
Median year owner moved in (as recorded in 2022):
Median year renter moved in (as recorded in 2022):
| Greenhollow Addition: | 2000 |
| Plano: | 2010 |
Median year renter moved in (as recorded in 2022):
| Greenhollow Addition: | 2018 |
| Plano: | 2020 |
Percentage of married-couple families with both working:
| Greenhollow Addition: | 65.7% |
| Plano: | 69.7% |
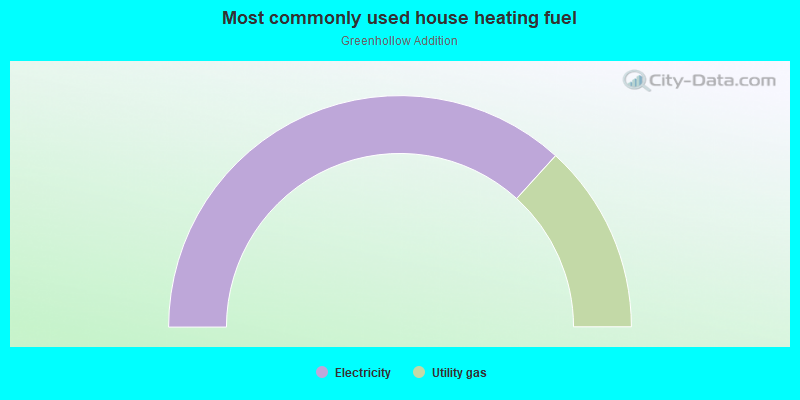
- 73.5%Electricity
- 26.5%Utility gas
Roads and streets:
Mariposa Cir
Length: 0.30 miles
Directions: E-W, N-S
Address range: 2601 to 2675
Directions: E-W, N-S
Address range: 2601 to 2675
Clinton Dr
Length: 0.23 miles
Direction: E-W
Address range: 900 to 1014
Direction: E-W
Address range: 900 to 1014
Raywood Cir
Length: 0.10 miles
Direction: E-W
Address range: 900 to 999
Direction: E-W
Address range: 900 to 999
Redondo Cir
Length: 0.10 miles
Direction: E-W
Address range: 900 to 999
Direction: E-W
Address range: 900 to 999
Keenan Cir
Length: 0.08 miles
Direction: E-W
Address range: 900 to 999
Direction: E-W
Address range: 900 to 999
Pebble Vale Dr
Length: 0.06 miles
Direction: N-S
Address range: 2800 to 2899
Direction: N-S
Address range: 2800 to 2899