Grant Ferry neighborhood in Buffalo, New York (NY), 14213, 14222 detailed profile
Settings
X


Business Search - 14 Million verified businesses
Area: 0.619 square miles
Population: 10,517
Population density:
| Grant Ferry: | 16,987 people per square mile |
| Buffalo: | 6,808 people per square mile |

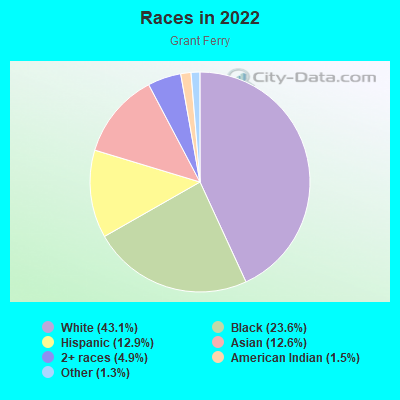
- 5,36443.1%White
- 2,94423.6%Black
- 1,61012.9%Hispanic or Latino
- 1,56712.6%Asian
- 6144.9%Two or more races
- 1911.5%American Indian
- 1621.3%Some other race
Median household income in 2022:
| Grant Ferry: | $63,890 |
| Buffalo: | $48,904 |
Distribution of median household income
![Distribution of median household income]()
- 557Less than $10,000
- 1,047$10,000 to $19,999
- 578$20,000 to $29,999
- 564$30,000 to $39,999
- 550$40,000 to $49,999
- 474$50,000 to $59,999
- 506$60,000 to $74,999
- 505$75,000 to $99,999
- 550$100,000 to $124,999
- 490$125,000 to $149,999
- 415$150,000 to $199,999
- 234$200,000 or more

Distribution of owner-occupied house/condo value
![Distribution of owner-occupied house/condo value]()
- 1,295Less than $50,000
- 1,638$50,000 to $99,999
- 428$100,000 to $149,999
- 408$150,000 to $199,999
- 651$200,000 to $249,999
- 288$250,000 to $299,999
- 237$300,000 to $399,999
- 304$400,000 to $499,999
- 297$500,000 to $749,999
- 90$750,000 to $999,999
- 470$1,000,000 or more

Distribution of rent paid by renters
![Distribution of rent paid by renters]()
- 88$100 to $199
- 384$200 to $299
- 70$300 to $399
- 563$400 to $499
- 556$500 to $599
- 592$600 to $699
- 558$700 to $799
- 602$800 to $899
- 168$900 to $999
- 501$1,000 to $1,249
- 321$1,250 to $1,499
- 741$1,500 to $1,999
- 507$2,000 or more

Median rent in 2022:
| Grant Ferry: | $947 |
| Buffalo: | $797 |
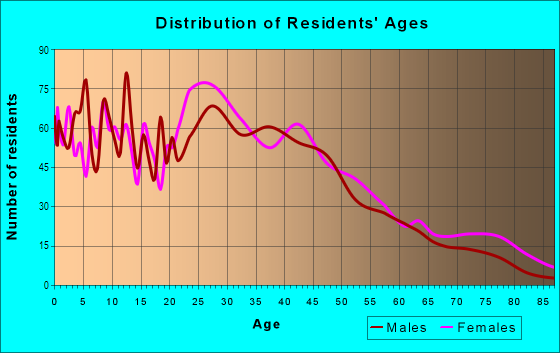
| Males: | 5,197 |
| Females: | 5,320 |
Males:
| This neighborhood: | 32.8 years |
| Whole city: | 34.6 years |
| This neighborhood: | 37.6 years |
| Whole city: | 35.0 years |
Average household size:
| Grant Ferry: | 5.4 people |
| Buffalo: | 2.2 people |
Percentage of family households:
| Grant Ferry: | 40.6% |
| Buffalo: | 35.8% |
| Here: | 17.7% |
| Buffalo: | 24.5% |
Percentage of married-couple families with children (among all households):
| Grant Ferry: | 17.2% |
| Buffalo: | 22.3% |
Percentage of single-mother households (among all households):
| Grant Ferry: | 31.6% |
| Buffalo: | 17.8% |
Percentage of never married males 15 years old and over:
Percentage of never married females 15 years old and over:
| Grant Ferry: | 25.4% |
| Buffalo: | 25.6% |
Percentage of never married females 15 years old and over:
| Grant Ferry: | 33.6% |
| city: | 26.3% |
Percentage of people that speak English not well or not at all:
| Grant Ferry: | 5.0% |
| Buffalo: | 4.0% |
Percentage of people born in this state:
Percentage of people born in another U.S. state:
Percentage of native residents but born outside the U.S.:
Percentage of foreign born residents:
| Here: | 73.8% |
| Buffalo: | 75.1% |
Percentage of people born in another U.S. state:
| Grant Ferry: | 10.2% |
| Buffalo: | 10.9% |
Percentage of native residents but born outside the U.S.:
| Here: | 2.8% |
| city: | 3.9% |
Percentage of foreign born residents:
| Here: | 13.3% |
| Buffalo: | 10.0% |
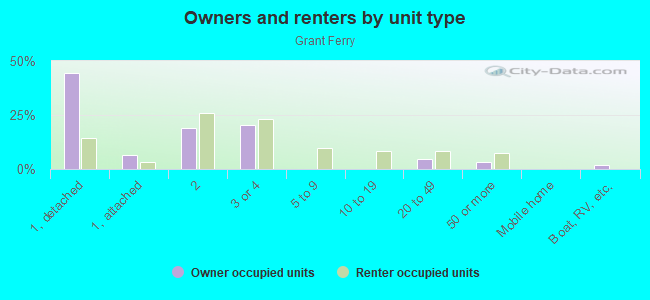
Owner-occupied
Renter-occupied

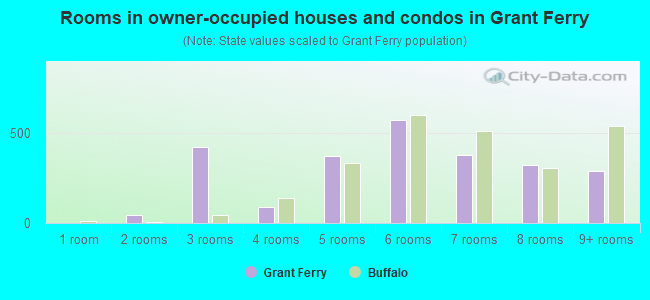
- Rooms in owner-occupied houses and condos in Grant Ferry
- 01 room
- 442 rooms
- 4233 rooms
- 874 rooms
- 3715 rooms
- 5716 rooms
- 3797 rooms
- 3218 rooms
- 2889+ rooms
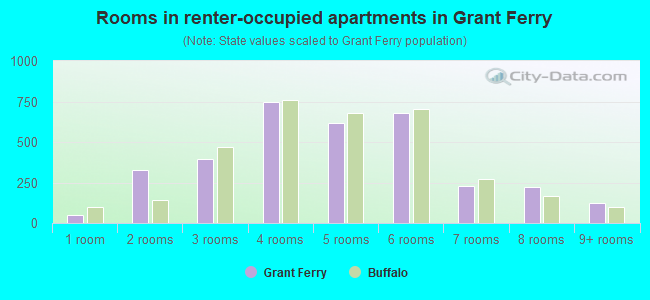
- Rooms in renter-occupied apartments in Grant Ferry
- 501 room
- 3292 rooms
- 3963 rooms
- 7444 rooms
- 6205 rooms
- 6786 rooms
- 2317 rooms
- 2228 rooms
- 1259+ rooms
Owner-occupied
Renter-occupied
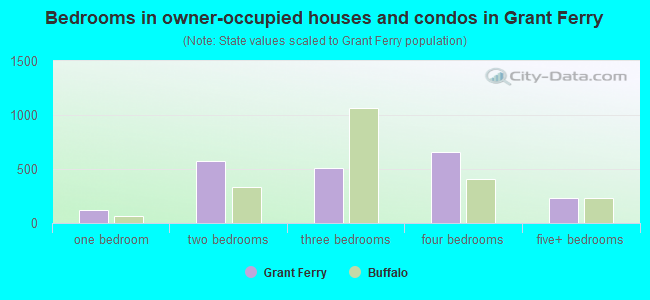
- Bedrooms in owner-occupied houses and condos in Grant Ferry
- 0no bedroom
- 1241 bedroom
- 5722 bedrooms
- 5133 bedrooms
- 6564 bedrooms
- 2355+ bedrooms
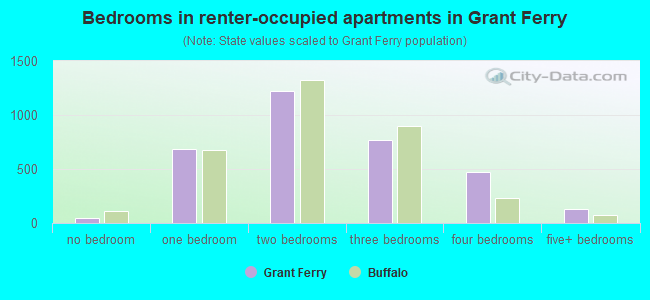
- Bedrooms in renter-occupied apartments in Grant Ferry
- 50no bedroom
- 6841 bedroom
- 1,2242 bedrooms
- 7693 bedrooms
- 4684 bedrooms
- 1315+ bedrooms
Average number of cars or other vehicles available in houses/condos:
Average number of cars or other vehicles available in apartments:
| This neighborhood: | 1.4 |
| Buffalo: | 1.5 |
Average number of cars or other vehicles available in apartments:
| Here: | 0.9 |
| city: | 0.9 |
Percentage of units with a mortgage:
| Grant Ferry: | 60.1% |
| Buffalo: | 48.3% |
Housing prices:
- Average estimated value of detached houses in 2022 (33.0% of all units):
Grant Ferry: $152,787 New York: $476,719
- Average estimated value of housing units in 2-unit structures in 2022 (35.5% of all units):
This neighborhood: $236,956 New York: $713,077
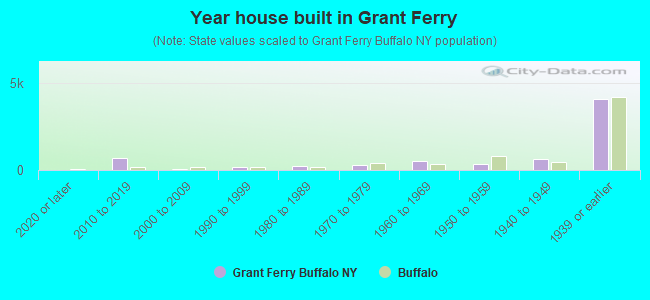
- Year house built in Grant Ferry
- 02020 or later
- 6742010 to 2019
- 702000 to 2009
- 1481990 to 1999
- 2041980 to 1989
- 2841970 to 1979
- 5271960 to 1969
- 3231950 to 1959
- 6061940 to 1949
- 4,0981939 or earlier
City-data.com crime index for city in 2020 (higher means more crime):
| City: | 441.3 |
| U.S. average: | 219.5 |
Travel time to work (commute)
![Travel time to work (commute)]()
- 282Less than 5 minutes
- 3505 to 9 minutes
- 1,15710 to 14 minutes
- 73215 to 19 minutes
- 36820 to 24 minutes
- 28025 to 29 minutes
- 46430 to 34 minutes
- 11435 to 39 minutes
- 6140 to 44 minutes
- 17445 to 59 minutes
- 8660 to 89 minutes
- 690 or more minutes

Means of transportation to work
![Means of transportation to work]()
- 61.9%2,960Drove a car alone
- 14.6%696Carpooled
- 14.8%708Bus
- 8.2%393Motorcycle
- 2.7%131Bicycle
- 7.9%378Walked
- 4.0%193Other means
- 9.0%429Worked at home

Time leaving home to go to work
![Time leaving home to go to work]()
- 14512:00 a.m. to 4:59 a.m.
- 1175:00 a.m. to 5:29 a.m.
- 245:30 a.m. to 5:59 a.m.
- 1026:00 a.m. to 6:29 a.m.
- 1326:30 a.m. to 6:59 a.m.
- 3667:00 a.m. to 7:29 a.m.
- 4847:30 a.m. to 7:59 a.m.
- 5308:00 a.m. to 8:29 a.m.
- 5998:30 a.m. to 8:59 a.m.
- 3299:00 a.m. to 9:59 a.m.
- 11610:00 a.m. to 10:59 a.m.
- 3611:00 a.m. to 11:59 a.m.
- 33912:00 p.m. to 3:59 p.m.
- 3594:00 p.m. to 11:59 p.m.

Occupations of males:
- Percentage of males in management occupations (except farmers):
Here: 13.6% city: 8.7%
- Percentage of males in business and financial operations occupations:
Here: 10.3% city: 4.0%
- Percentage of males in computer and mathematical occupations:
Here: 5.7% city: 3.5%
- Percentage of males in life, physical, and social science occupations:
Here: 1.1% city: 1.0%
- Percentage of males in community and social services occupations:
Here: 2.4% city: 1.9%
- Percentage of males in education, training, and library occupations:
Here: 12.4% city: 4.7%
- Percentage of males in healthcare practitioners and technical occupations:
Here: 3.4% city: 2.6%
- Percentage of males in service occupations:
Here: 17.7% city: 21.5%
- Percentage of males in sales and office occupations:
Here: 10.2% city: 15.9%
- Percentage of males in construction, extraction, and maintenance occupations:
Here: 9.3% city: 5.6%
- Percentage of males in production occupations:
Here: 3.7% city: 7.3%
- Percentage of males in transportation occupations:
Here: 3.8% city: 5.1%
- Percentage of males in material moving occupations:
Here: 2.3% city: 7.6%
Occupations of females:
- Percentage of females in management occupations (except farmers):
Here: 8.2% city: 7.4%
- Percentage of females in business and financial operations occupations:
Here: 5.6% city: 5.0%
- Percentage of females in computer and mathematical occupations:
Here: 3.7% city: 1.1%
- Percentage of females in architecture and engineering occupations:
Here: 1.3% city: 0.4%
- Percentage of females in community and social services occupations:
Here: 6.0% city: 3.5%
- Percentage of females in education, training, and library occupations:
Here: 10.9% city: 10.9%
- Percentage of females in arts, design, entertainment, sports, and media occupations:
Here: 5.3% city: 1.8%
- Percentage of females in healthcare practitioners and technical occupations:
Here: 5.6% city: 8.0%
- Percentage of females in service occupations:
Here: 17.6% city: 26.7%
- Percentage of females in sales and office occupations:
Here: 29.3% city: 25.5%
- Percentage of females in production occupations:
Here: 2.5% city: 3.4%
- Percentage of females in transportation occupations:
Here: 1.2% city: 1.1%
- Percentage of females in material moving occupations:
Here: 2.8% city: 2.0%
Percentage of people 16-64 in Armed Forces:
| Grant Ferry: | 0.0% |
| Buffalo: | 0.2% |
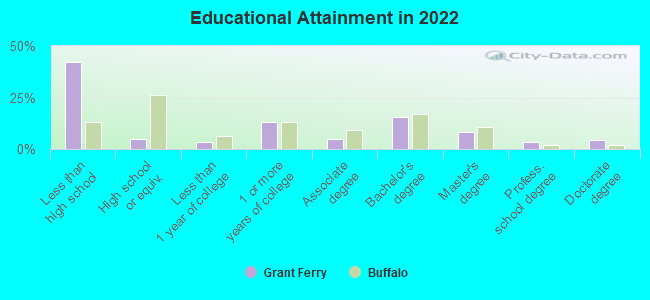
Education in this neighborhood (subdivision or community):
- Percentage of people 3 years and older in K-12 schools:
Grant Ferry: 32.0% Buffalo: 16.7%
- Percentage of people 3 years and older in undergraduate colleges:
Grant Ferry: 3.2% Buffalo: 6.6%
- Percentage of people 3 years and older in grad. or professional schools:
Grant Ferry: 8.2% Buffalo: 2.5%
- Percentage of students K-12 enrolled in private schools:
Grant Ferry: 36.5% Buffalo: 11.8%
Percentage of population below poverty level:
| Grant Ferry: | 32.1% |
| Buffalo: | 23.6% |
Median year owner moved in (as recorded in 2022):
Median year renter moved in (as recorded in 2022):
| Grant Ferry: | 2175 |
| Buffalo: | 2008 |
Median year renter moved in (as recorded in 2022):
| Grant Ferry: | 2185 |
| Buffalo: | 2019 |
Percentage of married-couple families with both working:
| Grant Ferry: | 124.6% |
| Buffalo: | 64.1% |
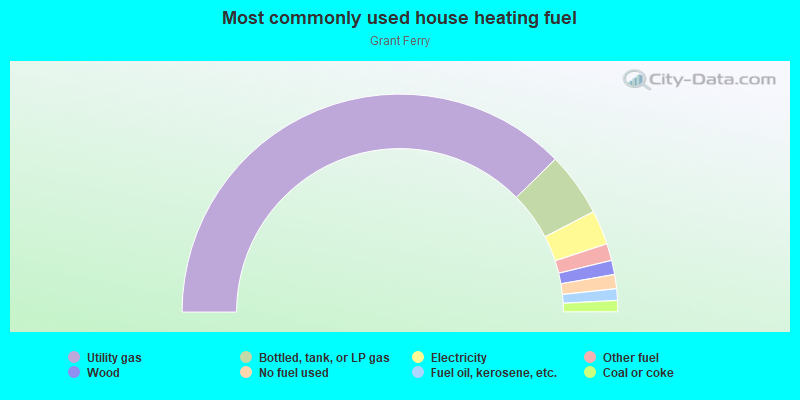
- 75.2%Utility gas
- 9.5%Bottled, tank, or LP gas
- 5.1%Electricity
- 2.5%Other fuel
- 2.1%Wood
- 2.1%No fuel used
- 1.7%Fuel oil, kerosene, etc.
- 1.7%Coal or coke
Highways in this neighborhood:
State Hwy 266 (Niagara St)
Length: 0.49 miles
Direction: N-S
Address range: 1092 to 1327
Direction: N-S
Address range: 1092 to 1327
Roads and streets:
Breckenridge St
Length: 1.64 miles
Direction: E-W
Address range: 1 to 699
Direction: E-W
Address range: 1 to 699
W Ferry St
Length: 1.64 miles
Direction: E-W
Address range: 11 to 639
Direction: E-W
Address range: 11 to 639
Auburn Ave
Length: 1.57 miles
Direction: E-W
Address range: 1 to 629
Direction: E-W
Address range: 1 to 629
Lafayette Ave
Length: 0.74 miles
Direction: E-W
Address range: 1 to 286
Direction: E-W
Address range: 1 to 286
Albany St
Length: 0.59 miles
Direction: E-W
Address range: 1 to 299
Direction: E-W
Address range: 1 to 299
Arkansas St
Length: 0.53 miles
Direction: E-W
Address range: 1 to 211
Direction: E-W
Address range: 1 to 211
Herkimer St
Length: 0.52 miles
Directions: E-W, N-S
Address range: 1 to 276
Directions: E-W, N-S
Address range: 1 to 276
Barton St
Length: 0.51 miles
Direction: N-S
Address range: 1 to 299
Direction: N-S
Address range: 1 to 299
West Ave
Length: 0.50 miles
Direction: N-S
Address range: 830 to 1099
Direction: N-S
Address range: 830 to 1099
Grant St
Length: 0.45 miles
Directions: N-S, SE-NW, SW-NE
Address range: 1 to 225
Directions: N-S, SE-NW, SW-NE
Address range: 1 to 225
Hampshire St
Length: 0.42 miles
Direction: SW-NE
Address range: 232 to 499
Direction: SW-NE
Address range: 232 to 499
Gelston St
Length: 0.34 miles
Direction: N-S
Address range: 1 to 199
Direction: N-S
Address range: 1 to 199
Parkdale Ave
Length: 0.34 miles
Directions: N-S, SW-NE
Address range: 1 to 192
Directions: N-S, SW-NE
Address range: 1 to 192
California St
Length: 0.29 miles
Direction: E-W
Address range: 1 to 99
Direction: E-W
Address range: 1 to 99
Dewitt St
Length: 0.29 miles
Direction: N-S
Address range: 1 to 150
Direction: N-S
Address range: 1 to 150
Livingston St
Length: 0.29 miles
Direction: N-S
Address range: 1 to 148
Direction: N-S
Address range: 1 to 148
Plymouth Ave
Length: 0.28 miles
Direction: N-S
Address range: 612 to 799
Direction: N-S
Address range: 612 to 799
Richmond Ave
Length: 0.28 miles
Direction: N-S
Address range: 481 to 639
Direction: N-S
Address range: 481 to 639
Arnold St
Length: 0.24 miles
Direction: E-W
Address range: 1 to 99
Direction: E-W
Address range: 1 to 99
Ashland Ave
Length: 0.22 miles
Direction: N-S
Address range: 400 to 506
Direction: N-S
Address range: 400 to 506
Hoyt St
Length: 0.22 miles
Direction: N-S
Address range: 1 to 108
Direction: N-S
Address range: 1 to 108
Baynes St
Length: 0.22 miles
Direction: N-S
Address range: 1 to 115
Direction: N-S
Address range: 1 to 115
Norwood Ave
Length: 0.22 miles
Direction: N-S
Address range: 400 to 499
Direction: N-S
Address range: 400 to 499
Ferguson Ave
Length: 0.19 miles
Direction: E-W
Address range: 1 to 99
Direction: E-W
Address range: 1 to 99
Boyd St
Length: 0.18 miles
Direction: E-W
Address range: 3 to 99
Direction: E-W
Address range: 3 to 99
Gill Aly
Length: 0.17 miles
Direction: N-S
Address range: 1 to 99
Direction: N-S
Address range: 1 to 99
Congress St
Length: 0.17 miles
Direction: N-S
Address range: 1 to 100
Direction: N-S
Address range: 1 to 100
Auchinvole Ave
Length: 0.15 miles
Direction: E-W
Address range: 1 to 99
Direction: E-W
Address range: 1 to 99
Gren-Way Aly
Length: 0.12 miles
Direction: N-S
Address range: 1 to 99
Direction: N-S
Address range: 1 to 99
Gull St
Length: 0.12 miles
Direction: E-W
Address range: 1 to 99
Direction: E-W
Address range: 1 to 99
Putnam St
Length: 0.12 miles
Direction: N-S
Address range: 1 to 55
Direction: N-S
Address range: 1 to 55
Ferry Cir
Length: 0.10 miles
Directions: SE-NW, SW-NE
Directions: SE-NW, SW-NE
Elmwood Ave
Length: 0.10 miles
Direction: N-S
Address range: 670 to 724
Direction: N-S
Address range: 670 to 724
S Putnam St
Length: 0.10 miles
Direction: N-S
Address range: 1 to 99
Direction: N-S
Address range: 1 to 99
Sherwood St
Length: 0.10 miles
Direction: N-S
Address range: 1 to 99
Direction: N-S
Address range: 1 to 99
Haggart Aly
Length: 0.05 miles
Direction: N-S
Direction: N-S
Railroad features:
Csx RR (Penn Central RR)
Length: 0.41 miles
Direction: N-S
Direction: N-S