Goodyear (Mastic) neighborhood in San Jose, California (CA), 95110 detailed profile
Settings
X

Business Search - 14 Million verified businesses
Area: 0.118 square miles
Population: 2,587
Population density:
| Goodyear (Mastic): | 21,994 people per square mile |
| San Jose: | 5,554 people per square mile |

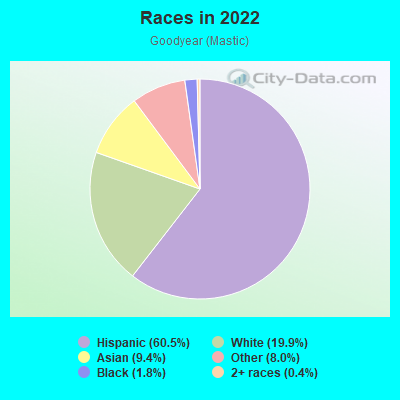
- 1,69960.5%Hispanic or Latino
- 55919.9%White
- 2649.4%Asian
- 2268.0%Some other race
- 501.8%Black
- 120.4%Two or more races
Median household income in 2022:
| Goodyear (Mastic): | $73,997 |
| San Jose: | $133,835 |
Distribution of median household income
![Distribution of median household income]()
- 36Less than $10,000
- 27$10,000 to $19,999
- 62$20,000 to $29,999
- 134$30,000 to $39,999
- 37$40,000 to $49,999
- 50$50,000 to $59,999
- 56$60,000 to $74,999
- 116$75,000 to $99,999
- 32$100,000 to $124,999
- 25$125,000 to $149,999
- 123$150,000 to $199,999
- 149$200,000 or more

Distribution of owner-occupied house/condo value
![Distribution of owner-occupied house/condo value]()
- 21Less than $50,000
- 3$50,000 to $99,999
- 9$250,000 to $299,999
- 4$300,000 to $399,999
- 4$400,000 to $499,999
- 41$500,000 to $749,999
- 85$750,000 to $999,999
- 155$1,000,000 or more

Distribution of rent paid by renters
![Distribution of rent paid by renters]()
- 4Less than $100
- 13$200 to $299
- 11$300 to $399
- 50$500 to $599
- 30$700 to $799
- 6$800 to $899
- 102$1,000 to $1,249
- 23$1,250 to $1,499
- 139$1,500 to $1,999
- 210$2,000 or more

Median rent in 2022:
| Goodyear (Mastic): | $1,904 |
| San Jose: | $2,001 |
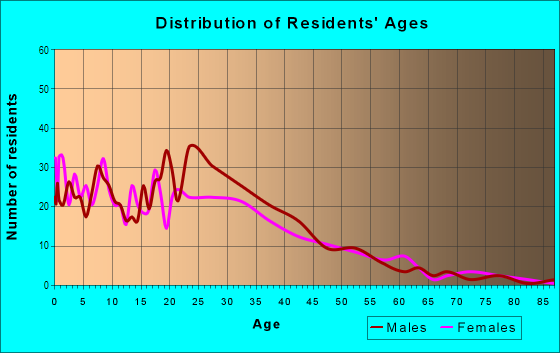
| Males: | 1,418 |
| Females: | 1,169 |
Males:
| This neighborhood: | 37.8 years |
| Whole city: | 37.6 years |
| This neighborhood: | 33.4 years |
| Whole city: | 39.1 years |
Average household size:
| Goodyear (Mastic): | 3.3 people |
| San Jose: | 2.9 people |
Percentage of family households:
| Goodyear (Mastic): | 52.7% |
| San Jose: | 49.9% |
| Here: | 47.1% |
| San Jose: | 53.0% |
Percentage of married-couple families with children (among all households):
| Goodyear (Mastic): | 19.2% |
| San Jose: | 25.8% |
Percentage of single-mother households (among all households):
| Goodyear (Mastic): | 12.5% |
| San Jose: | 5.2% |
Percentage of never married males 15 years old and over:
Percentage of never married females 15 years old and over:
| Goodyear (Mastic): | 19.9% |
| San Jose: | 20.9% |
Percentage of never married females 15 years old and over:
| Goodyear (Mastic): | 14.9% |
| city: | 16.7% |
Percentage of people that speak English not well or not at all:
| Goodyear (Mastic): | 19.8% |
| San Jose: | 11.4% |
Percentage of people born in this state:
Percentage of people born in another U.S. state:
Percentage of native residents but born outside the U.S.:
Percentage of foreign born residents:
| Here: | 51.0% |
| San Jose: | 46.1% |
Percentage of people born in another U.S. state:
| Goodyear (Mastic): | 8.7% |
| San Jose: | 10.4% |
Percentage of native residents but born outside the U.S.:
| Here: | 0.4% |
| city: | 1.7% |
Percentage of foreign born residents:
| Here: | 39.9% |
| San Jose: | 41.8% |
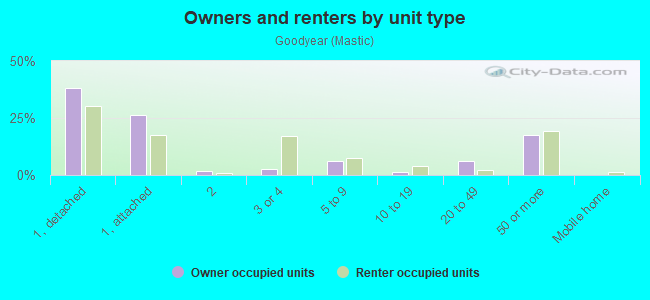
Owner-occupied
Renter-occupied

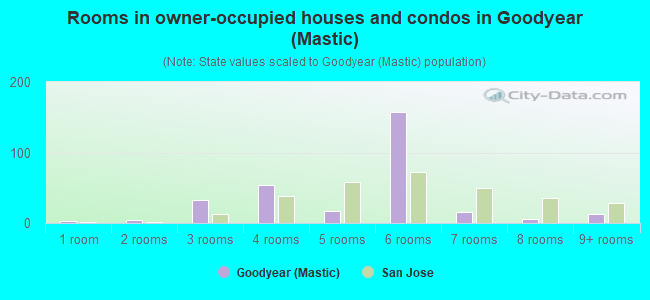
- Rooms in owner-occupied houses and condos in Goodyear <
> - 31 room
- 42 rooms
- 323 rooms
- 544 rooms
- 175 rooms
- 1576 rooms
- 167 rooms
- 58 rooms
- 139+ rooms
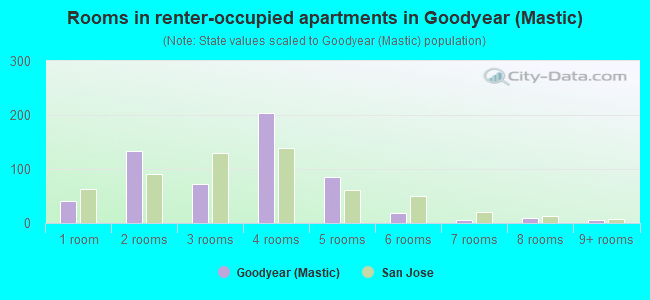
- Rooms in renter-occupied apartments in Goodyear <
> - 411 room
- 1342 rooms
- 723 rooms
- 2044 rooms
- 855 rooms
- 196 rooms
- 57 rooms
- 98 rooms
- 69+ rooms
Owner-occupied
Renter-occupied
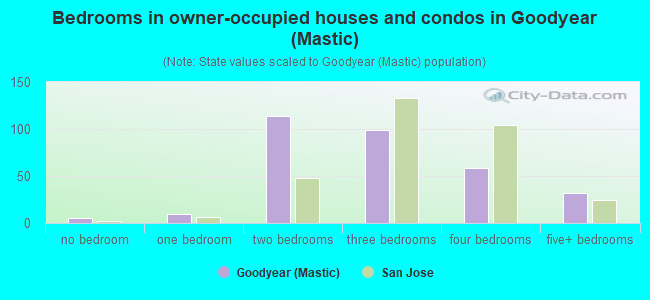
- Bedrooms in owner-occupied houses and condos in Goodyear <
> - 5no bedroom
- 101 bedroom
- 1142 bedrooms
- 993 bedrooms
- 594 bedrooms
- 325+ bedrooms
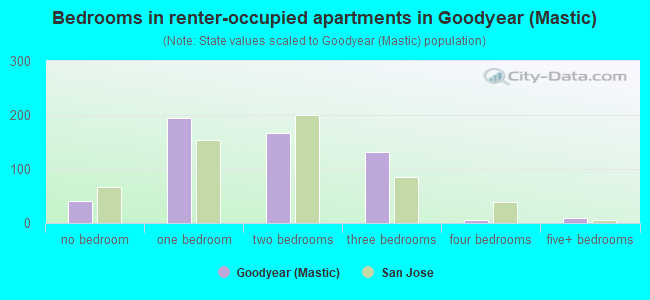
- Bedrooms in renter-occupied apartments in Goodyear <
> - 41no bedroom
- 1941 bedroom
- 1662 bedrooms
- 1323 bedrooms
- 64 bedrooms
- 105+ bedrooms
Average number of cars or other vehicles available in houses/condos:
Average number of cars or other vehicles available in apartments:
| This neighborhood: | 1.8 |
| San Jose: | 2.3 |
Average number of cars or other vehicles available in apartments:
| Here: | 1.7 |
| city: | 1.6 |
Percentage of units with a mortgage:
| Goodyear (Mastic): | 83.4% |
| San Jose: | 66.9% |
Average estimated value of detached houses in 2022 (35.2% of all units):
| Goodyear (Mastic): | $989,629 |
| San Jose: | $1,532,815 |
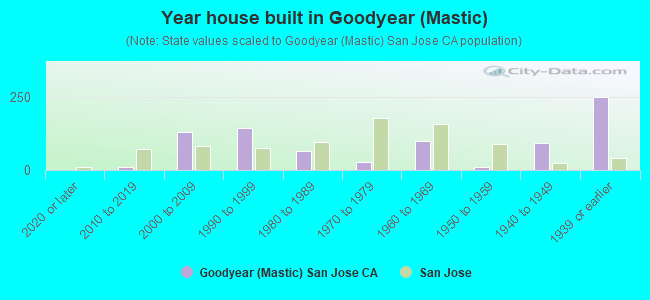
- Year house built in Goodyear <
> - 02020 or later
- 112010 to 2019
- 1322000 to 2009
- 1431990 to 1999
- 651980 to 1989
- 291970 to 1979
- 1011960 to 1969
- 111950 to 1959
- 921940 to 1949
- 2501939 or earlier
City-data.com crime index for city in 2020 (higher means more crime):
| City: | 268.4 |
| U.S. average: | 219.5 |
Travel time to work (commute)
![Travel time to work (commute)]()
- 11Less than 5 minutes
- 385 to 9 minutes
- 25610 to 14 minutes
- 21515 to 19 minutes
- 17820 to 24 minutes
- 3025 to 29 minutes
- 15430 to 34 minutes
- 3635 to 39 minutes
- 3040 to 44 minutes
- 9945 to 59 minutes
- 3760 to 89 minutes
- 4490 or more minutes

Means of transportation to work
![Means of transportation to work]()
- 61.8%839Drove a car alone
- 14.4%196Carpooled
- 1.8%25Bus
- 0.6%8Subway or elevated rail
- 0.9%12Long-distance train or commuter rail
- 1.0%13Light rail, streetcar or trolley
- 2.1%28Bicycle
- 3.1%42Walked
- 0.7%9Other means
- 18.7%254Worked at home

Time leaving home to go to work
![Time leaving home to go to work]()
- 2512:00 a.m. to 4:59 a.m.
- 455:00 a.m. to 5:29 a.m.
- 565:30 a.m. to 5:59 a.m.
- 1276:00 a.m. to 6:29 a.m.
- 1566:30 a.m. to 6:59 a.m.
- 877:00 a.m. to 7:29 a.m.
- 827:30 a.m. to 7:59 a.m.
- 2028:00 a.m. to 8:29 a.m.
- 678:30 a.m. to 8:59 a.m.
- 759:00 a.m. to 9:59 a.m.
- 1810:00 a.m. to 10:59 a.m.
- 1611:00 a.m. to 11:59 a.m.
- 7412:00 p.m. to 3:59 p.m.
- 594:00 p.m. to 11:59 p.m.

Occupations of males:
- Percentage of males in management occupations (except farmers):
Here: 20.7% city: 13.0%
- Percentage of males in architecture and engineering occupations:
Here: 7.9% city: 10.2%
- Percentage of males in life, physical, and social science occupations:
Here: 1.5% city: 1.1%
- Percentage of males in community and social services occupations:
Here: 1.1% city: 0.8%
- Percentage of males in arts, design, entertainment, sports, and media occupations:
Here: 2.7% city: 1.8%
- Percentage of males in service occupations:
Here: 11.1% city: 12.7%
- Percentage of males in sales and office occupations:
Here: 18.0% city: 12.8%
- Percentage of males in construction, extraction, and maintenance occupations:
Here: 29.8% city: 7.8%
- Percentage of males in production occupations:
Here: 1.8% city: 5.5%
- Percentage of males in material moving occupations:
Here: 4.9% city: 3.1%
Occupations of females:
- Percentage of females in management occupations (except farmers):
Here: 11.3% city: 11.0%
- Percentage of females in business and financial operations occupations:
Here: 1.3% city: 8.6%
- Percentage of females in computer and mathematical occupations:
Here: 11.7% city: 5.4%
- Percentage of females in life, physical, and social science occupations:
Here: 1.3% city: 1.7%
- Percentage of females in community and social services occupations:
Here: 1.9% city: 1.8%
- Percentage of females in education, training, and library occupations:
Here: 3.6% city: 8.1%
- Percentage of females in arts, design, entertainment, sports, and media occupations:
Here: 6.9% city: 2.0%
- Percentage of females in service occupations:
Here: 25.6% city: 21.7%
- Percentage of females in sales and office occupations:
Here: 23.6% city: 22.0%
- Percentage of females in farming, fishing, and forestry occupations:
Here: 5.9% city: 0.2%
- Percentage of females in transportation occupations:
Here: 5.4% city: 0.7%
- Percentage of females in material moving occupations:
Here: 1.2% city: 1.5%
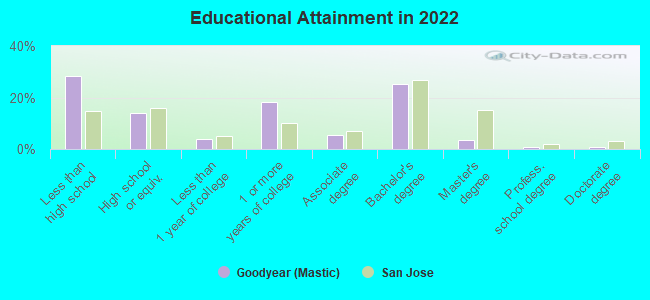
Education in this neighborhood (subdivision or community):
- Percentage of people 3 years and older in K-12 schools:
Goodyear (Mastic): 15.1% San Jose: 16.1%
- Percentage of people 3 years and older in undergraduate colleges:
Goodyear (Mastic): 4.4% San Jose: 6.5%
- Percentage of people 3 years and older in grad. or professional schools:
Goodyear (Mastic): 1.0% San Jose: 2.0%
- Percentage of students K-12 enrolled in private schools:
Goodyear (Mastic): 36.7% San Jose: 14.9%
Percentage of population below poverty level:
| Goodyear (Mastic): | 10.2% |
| San Jose: | 9.0% |
Median year owner moved in (as recorded in 2022):
Median year renter moved in (as recorded in 2022):
| Goodyear (Mastic): | 2005 |
| San Jose: | 2008 |
Median year renter moved in (as recorded in 2022):
| Goodyear (Mastic): | 2014 |
| San Jose: | 2020 |
Percentage of married-couple families with both working:
| Goodyear (Mastic): | 73.7% |
| San Jose: | 72.5% |
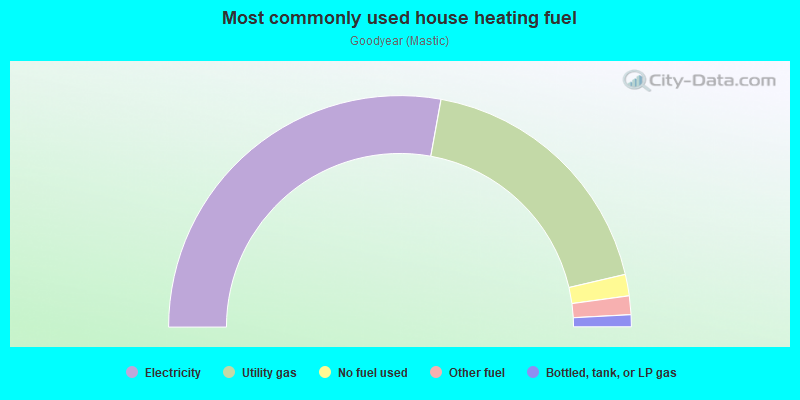
- 55.7%Electricity
- 37.0%Utility gas
- 3.0%No fuel used
- 2.6%Other fuel
- 1.7%Bottled, tank, or LP gas
Highways in this neighborhood:
S 1st St (State Hwy 82)
Length: 0.42 miles
Direction: SE-NW
Address range: 1000 to 1399
Direction: SE-NW
Address range: 1000 to 1399
Roads and streets:
Mastic St
Length: 0.46 miles
Direction: SE-NW
Address range: 1000 to 1399
Direction: SE-NW
Address range: 1000 to 1399
Sherman St
Length: 0.46 miles
Direction: SE-NW
Address range: 1000 to 1399
Direction: SE-NW
Address range: 1000 to 1399
Plum St
Length: 0.36 miles
Direction: SE-NW
Address range: 1100 to 1399
Direction: SE-NW
Address range: 1100 to 1399
Floyd St
Length: 0.25 miles
Direction: SW-NE
Address range: 1 to 149
Direction: SW-NE
Address range: 1 to 149
W Alma Ave
Length: 0.25 miles
Direction: SW-NE
Address range: 51 to 148
Direction: SW-NE
Address range: 51 to 148
W Humboldt St
Length: 0.25 miles
Direction: SW-NE
Address range: 1 to 150
Direction: SW-NE
Address range: 1 to 150
Goodyear St
Length: 0.25 miles
Direction: SW-NE
Address range: 1 to 163
Direction: SW-NE
Address range: 1 to 163
Willow St
Length: 0.16 miles
Direction: SW-NE
Address range: 1 to 98
Direction: SW-NE
Address range: 1 to 98
Graham Ave
Length: 0.08 miles
Direction: E-W
Address range: 1 to 109
Direction: E-W
Address range: 1 to 109
S 2nd St
Length: 0.06 miles
Direction: SE-NW
Address range: 1175 to 1299
Direction: SE-NW
Address range: 1175 to 1299