Glenwood neighborhood in Greensboro, North Carolina (NC), 27403 detailed profile
Settings
X


Business Search - 14 Million verified businesses
Area: 0.561 square miles
Population: 2,452
Population density:
| Glenwood: | 4,370 people per square mile |
| Greensboro: | 2,876 people per square mile |

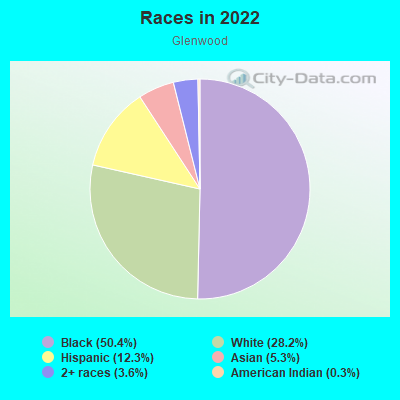
- 1,26450.4%Black
- 70628.2%White
- 30712.3%Hispanic or Latino
- 1325.3%Asian
- 893.6%Two or more races
- 80.3%American Indian
Median household income in 2022:
| Glenwood: | $35,188 |
| Greensboro: | $55,120 |
Distribution of median household income
![Distribution of median household income]()
- 103Less than $10,000
- 149$10,000 to $19,999
- 154$20,000 to $29,999
- 310$30,000 to $39,999
- 109$40,000 to $49,999
- 142$50,000 to $59,999
- 63$60,000 to $74,999
- 133$75,000 to $99,999
- 25$100,000 to $124,999
- 23$125,000 to $149,999
- 29$150,000 to $199,999

Distribution of owner-occupied house/condo value
![Distribution of owner-occupied house/condo value]()
- 93Less than $50,000
- 412$50,000 to $99,999
- 171$100,000 to $149,999
- 201$150,000 to $199,999
- 286$200,000 to $249,999
- 115$500,000 to $749,999

Distribution of rent paid by renters
![Distribution of rent paid by renters]()
- 155Less than $100
- 67$100 to $199
- 211$200 to $299
- 220$300 to $399
- 139$400 to $499
- 177$500 to $599
- 301$600 to $699
- 102$700 to $799
- 106$800 to $899
- 43$900 to $999
- 38$1,000 to $1,249
- 58$1,250 to $1,499
- 58$1,500 to $1,999
- 182$2,000 or more

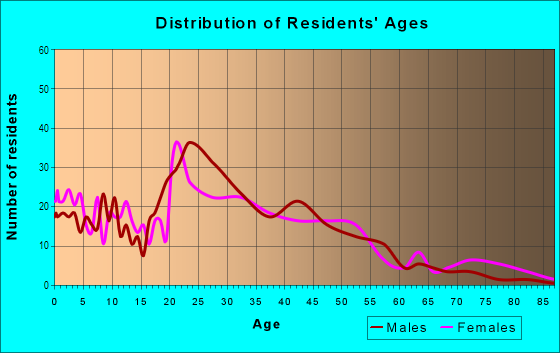
| Males: | 1,028 |
| Females: | 1,424 |
Males:
| This neighborhood: | 34.0 years |
| Whole city: | 32.4 years |
| This neighborhood: | 37.6 years |
| Whole city: | 35.3 years |
Average household size:
| Glenwood: | 2.3 people |
| Greensboro: | 2.3 people |
Percentage of family households:
| Glenwood: | 21.4% |
| Greensboro: | 43.6% |
| Here: | 13.9% |
| Greensboro: | 36.2% |
Percentage of married-couple families with children (among all households):
| Glenwood: | 11.9% |
| Greensboro: | 22.4% |
Percentage of single-mother households (among all households):
| Glenwood: | 34.8% |
| Greensboro: | 15.5% |
Percentage of never married males 15 years old and over:
Percentage of never married females 15 years old and over:
| Glenwood: | 23.1% |
| Greensboro: | 20.8% |
Percentage of never married females 15 years old and over:
| Glenwood: | 41.5% |
| city: | 23.9% |
Percentage of people that speak English not well or not at all:
| Glenwood: | 2.9% |
| Greensboro: | 2.7% |
Percentage of people born in this state:
Percentage of people born in another U.S. state:
Percentage of native residents but born outside the U.S.:
Percentage of foreign born residents:
| Here: | 61.3% |
| Greensboro: | 52.7% |
Percentage of people born in another U.S. state:
| Glenwood: | 29.1% |
| Greensboro: | 33.7% |
Percentage of native residents but born outside the U.S.:
| Here: | 3.4% |
| city: | 1.6% |
Percentage of foreign born residents:
| Here: | 6.2% |
| Greensboro: | 12.0% |
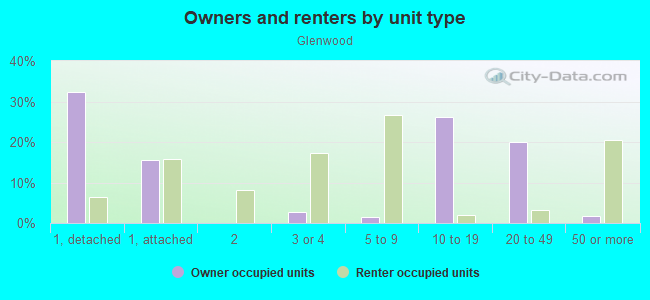
Owner-occupied
Renter-occupied

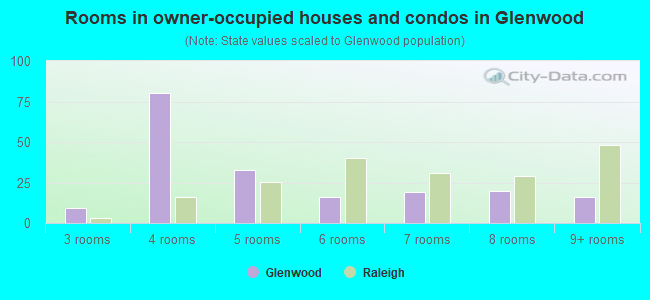
- Rooms in owner-occupied houses and condos in Glenwood
- 01 room
- 02 rooms
- 103 rooms
- 464 rooms
- 615 rooms
- 1196 rooms
- 1267 rooms
- 748 rooms
- 349+ rooms
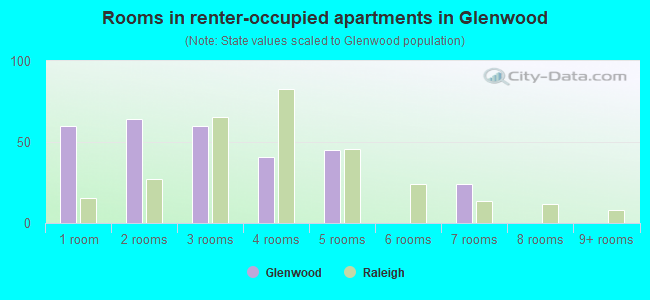
- Rooms in renter-occupied apartments in Glenwood
- 1451 room
- 342 rooms
- 1513 rooms
- 2004 rooms
- 2055 rooms
- 656 rooms
- 1077 rooms
- 788 rooms
- 09+ rooms
Owner-occupied
Renter-occupied
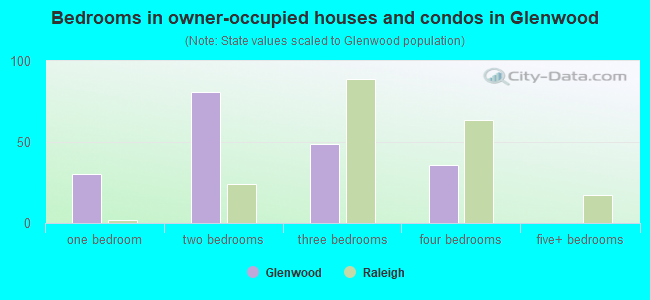
- Bedrooms in owner-occupied houses and condos in Glenwood
- 0no bedroom
- 401 bedroom
- 1002 bedrooms
- 2863 bedrooms
- 344 bedrooms
- 05+ bedrooms
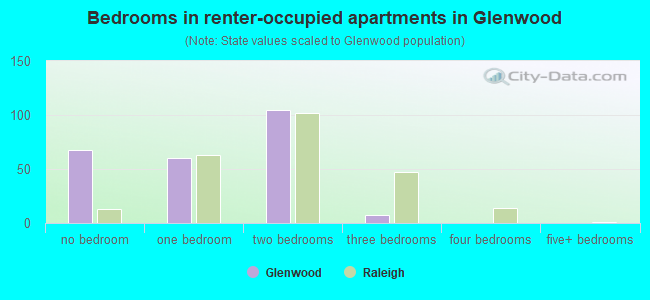
- Bedrooms in renter-occupied apartments in Glenwood
- 145no bedroom
- 911 bedroom
- 2112 bedrooms
- 2773 bedrooms
- 784 bedrooms
- 05+ bedrooms
Average number of cars or other vehicles available in houses/condos:
Average number of cars or other vehicles available in apartments:
| This neighborhood: | 0.9 |
| Greensboro: | 2.0 |
Average number of cars or other vehicles available in apartments:
| Here: | 1.6 |
| city: | 1.4 |
Percentage of units with a mortgage:
| Glenwood: | 57.2% |
| Greensboro: | 67.4% |
Average estimated value of detached houses in 2022 (65.9% of all units):
| Glenwood: | $94,474 |
| Greensboro: | $297,193 |
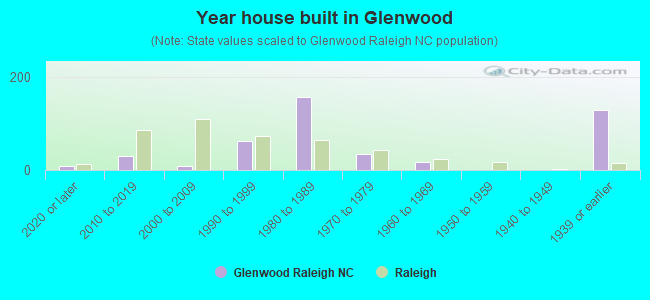
- Year house built in Glenwood
- 02020 or later
- 2422010 to 2019
- 582000 to 2009
- 791990 to 1999
- 1631980 to 1989
- 1461970 to 1979
- 1221960 to 1969
- 2681950 to 1959
- 1271940 to 1949
- 2911939 or earlier
City-data.com crime index for city in 2020 (higher means more crime):
| City: | 435.6 |
| U.S. average: | 219.5 |
Travel time to work (commute)
![Travel time to work (commute)]()
- 178Less than 5 minutes
- 285 to 9 minutes
- 36410 to 14 minutes
- 24715 to 19 minutes
- 22720 to 24 minutes
- 2625 to 29 minutes
- 7030 to 34 minutes
- 640 to 44 minutes
- 8245 to 59 minutes
- 1360 to 89 minutes
- 1090 or more minutes

Means of transportation to work
![Means of transportation to work]()
- 80.0%951Drove a car alone
- 1.8%21Carpooled
- 14.5%172Bus
- 1.6%19Motorcycle
- 4.5%54Bicycle
- 5.2%62Walked
- 0.8%9Other means
- 3.4%41Worked at home

Time leaving home to go to work
![Time leaving home to go to work]()
- 11212:00 a.m. to 4:59 a.m.
- 105:00 a.m. to 5:29 a.m.
- 85:30 a.m. to 5:59 a.m.
- 36:00 a.m. to 6:29 a.m.
- 866:30 a.m. to 6:59 a.m.
- 1027:00 a.m. to 7:29 a.m.
- 1657:30 a.m. to 7:59 a.m.
- 558:00 a.m. to 8:29 a.m.
- 788:30 a.m. to 8:59 a.m.
- 999:00 a.m. to 9:59 a.m.
- 5410:00 a.m. to 10:59 a.m.
- 3111:00 a.m. to 11:59 a.m.
- 22512:00 p.m. to 3:59 p.m.
- 1794:00 p.m. to 11:59 p.m.

Occupations of males:
- Percentage of males in business and financial operations occupations:
Here: 1.9% city: 4.8%
- Percentage of males in education, training, and library occupations:
Here: 1.9% city: 4.0%
- Percentage of males in arts, design, entertainment, sports, and media occupations:
Here: 6.7% city: 1.5%
- Percentage of males in healthcare practitioners and technical occupations:
Here: 10.7% city: 3.1%
- Percentage of males in service occupations:
Here: 10.2% city: 14.3%
- Percentage of males in sales and office occupations:
Here: 18.0% city: 17.1%
- Percentage of males in farming, fishing, and forestry occupations:
Here: 3.1% city: 0.4%
- Percentage of males in construction, extraction, and maintenance occupations:
Here: 18.6% city: 6.0%
- Percentage of males in production occupations:
Here: 15.0% city: 7.5%
- Percentage of males in material moving occupations:
Here: 12.5% city: 9.6%
Occupations of females:
- Percentage of females in management occupations (except farmers):
Here: 7.0% city: 7.8%
- Percentage of females in business and financial operations occupations:
Here: 2.5% city: 5.5%
- Percentage of females in architecture and engineering occupations:
Here: 7.4% city: 0.5%
- Percentage of females in community and social services occupations:
Here: 8.0% city: 3.2%
- Percentage of females in education, training, and library occupations:
Here: 3.3% city: 10.3%
- Percentage of females in service occupations:
Here: 46.8% city: 19.4%
- Percentage of females in sales and office occupations:
Here: 7.4% city: 29.0%
- Percentage of females in construction, extraction, and maintenance occupations:
Here: 8.8% city: 0.5%
- Percentage of females in production occupations:
Here: 7.7% city: 5.2%
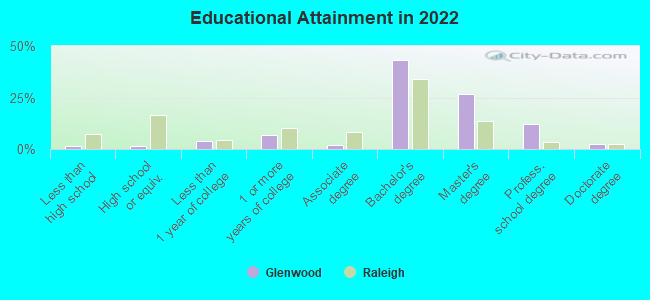
Education in this neighborhood (subdivision or community):
- Percentage of people 3 years and older in K-12 schools:
Glenwood: 23.9% Greensboro: 17.6%
- Percentage of people 3 years and older in undergraduate colleges:
Glenwood: 36.1% Greensboro: 11.2%
- Percentage of people 3 years and older in grad. or professional schools:
Glenwood: 5.1% Greensboro: 2.6%
- Percentage of students K-12 enrolled in private schools:
Glenwood: 11.6% Greensboro: 13.3%
Percentage of population below poverty level:
| Glenwood: | 46.6% |
| Greensboro: | 21.9% |
Median year owner moved in (as recorded in 2022):
| Glenwood: | 2006 |
| Greensboro: | 2010 |
Percentage of married-couple families with both working:
| Glenwood: | 160.5% |
| Greensboro: | 70.9% |
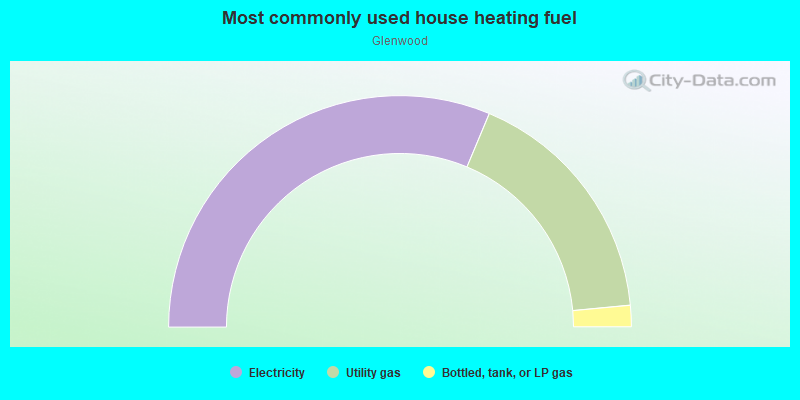
- 51.1%Electricity
- 30.9%Utility gas
- 7.8%Bottled, tank, or LP gas
- 7.8%Other fuel
- 2.3%Fuel oil, kerosene, etc.
Roads and streets:
Freeman Mill Rd
Length: 1.14 miles
Direction: SW-NE
Address range: 1101 to 1799
Direction: SW-NE
Address range: 1101 to 1799
Haywood St
Length: 0.86 miles
Directions: E-W, SE-NW
Address range: 600 to 1498
Directions: E-W, SE-NW
Address range: 600 to 1498
Hertford St
Length: 0.75 miles
Directions: E-W, SW-NE
Address range: 700 to 1499
Directions: E-W, SW-NE
Address range: 700 to 1499
Oak St
Length: 0.70 miles
Direction: E-W
Address range: 700 to 1403
Direction: E-W
Address range: 700 to 1403
Lexington Ave
Length: 0.69 miles
Direction: N-S
Address range: 800 to 1499
Direction: N-S
Address range: 800 to 1499
Highland Ave
Length: 0.69 miles
Direction: N-S
Address range: 800 to 1499
Direction: N-S
Address range: 800 to 1499
Richardson St
Length: 0.65 miles
Directions: E-W, SW-NE
Address range: 600 to 1399
Directions: E-W, SW-NE
Address range: 600 to 1399
Gregory St
Length: 0.62 miles
Direction: N-S
Address range: 800 to 1299
Direction: N-S
Address range: 800 to 1299
Mc Cormick St
Length: 0.59 miles
Direction: N-S
Address range: 900 to 1499
Direction: N-S
Address range: 900 to 1499
Glenwood Ave
Length: 0.59 miles
Direction: N-S
Address range: 900 to 1499
Direction: N-S
Address range: 900 to 1499
Portland St
Length: 0.56 miles
Direction: N-S
Address range: 900 to 1499
Direction: N-S
Address range: 900 to 1499
W Florida St
Length: 0.54 miles
Direction: E-W
Address range: 900 to 1313
Direction: E-W
Address range: 900 to 1313
Union St
Length: 0.50 miles
Directions: E-W, SW-NE
Address range: 700 to 1099
Directions: E-W, SW-NE
Address range: 700 to 1099
Silver Ave
Length: 0.48 miles
Direction: N-S
Address range: 800 to 1199
Direction: N-S
Address range: 800 to 1199
Dillard St
Length: 0.37 miles
Directions: N-S, SW-NE
Address range: 800 to 1099
Directions: N-S, SW-NE
Address range: 800 to 1099
Neal St
Length: 0.35 miles
Direction: N-S
Address range: 900 to 1199
Direction: N-S
Address range: 900 to 1199
Grove St
Length: 0.31 miles
Direction: E-W
Address range: 1100 to 1399
Direction: E-W
Address range: 1100 to 1399
Marion St
Length: 0.23 miles
Direction: E-W
Address range: 1200 to 1399
Direction: E-W
Address range: 1200 to 1399
Barringer St
Length: 0.18 miles
Direction: E-W
Address range: 900 to 999
Direction: E-W
Address range: 900 to 999
Randleman Rd
Length: 0.13 miles
Directions: N-S, SW-NE
Directions: N-S, SW-NE
W Whittington St
Length: 0.03 miles
Direction: SE-NW
Address range: 600 to 699
Direction: SE-NW
Address range: 600 to 699
Other features:
Mile Run Crk
Length: 0.93 miles
Directions: E-W, SE-NW, SW-NE
Directions: E-W, SE-NW, SW-NE