Glendale Hills neighborhood in Greensboro, North Carolina (NC), 27405 detailed profile
Settings
X


Business Search - 14 Million verified businesses
Area: 0.378 square miles
Population: 1,123
Population density:
| Glendale Hills: | 2,972 people per square mile |
| Greensboro: | 2,876 people per square mile |

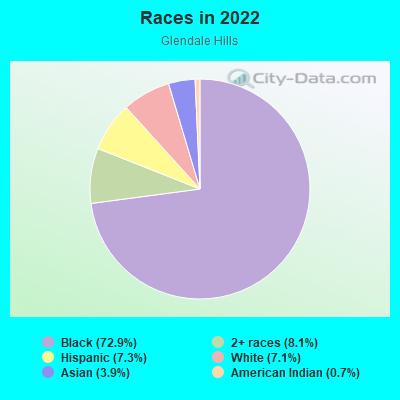
- 84972.9%Black
- 948.1%Two or more races
- 857.3%Hispanic or Latino
- 837.1%White
- 463.9%Asian
- 80.7%American Indian
Median household income in 2022:
| Glendale Hills: | $34,367 |
| Greensboro: | $55,120 |
Distribution of median household income
![Distribution of median household income]()
- 10Less than $10,000
- 117$10,000 to $19,999
- 113$20,000 to $29,999
- 104$30,000 to $39,999
- 36$40,000 to $49,999
- 34$50,000 to $59,999
- 41$60,000 to $74,999
- 24$75,000 to $99,999
- 5$100,000 to $124,999
- 26$125,000 to $149,999
- 7$150,000 to $199,999
- 16$200,000 or more

Distribution of owner-occupied house/condo value
![Distribution of owner-occupied house/condo value]()
- 78Less than $50,000
- 60$50,000 to $99,999
- 28$100,000 to $149,999
- 43$150,000 to $199,999
- 12$200,000 to $249,999
- 5$250,000 to $299,999
- 14$300,000 to $399,999
- 1$500,000 to $749,999

Distribution of rent paid by renters
![Distribution of rent paid by renters]()
- 10Less than $100
- 13$100 to $199
- 20$200 to $299
- 8$300 to $399
- 71$400 to $499
- 44$500 to $599
- 101$600 to $699
- 109$700 to $799
- 78$800 to $899
- 59$900 to $999
- 20$1,000 to $1,249
- 8$1,250 to $1,499
- 2$1,500 to $1,999

Median rent in 2022:
| Glendale Hills: | $746 |
| Greensboro: | $915 |
| Males: | 484 |
| Females: | 639 |
Males:
| This neighborhood: | 37.0 years |
| Whole city: | 32.4 years |
| This neighborhood: | 37.2 years |
| Whole city: | 35.3 years |
Average household size:
| Glendale Hills: | 2.7 people |
| Greensboro: | 2.3 people |
Percentage of family households:
| Glendale Hills: | 42.5% |
| Greensboro: | 43.6% |
| Here: | 26.7% |
| Greensboro: | 36.2% |
Percentage of married-couple families with children (among all households):
| Glendale Hills: | 21.8% |
| Greensboro: | 22.4% |
Percentage of single-mother households (among all households):
| Glendale Hills: | 5.1% |
| Greensboro: | 15.5% |
Percentage of never married males 15 years old and over:
Percentage of never married females 15 years old and over:
| Glendale Hills: | 19.9% |
| Greensboro: | 20.8% |
Percentage of never married females 15 years old and over:
| Glendale Hills: | 29.5% |
| city: | 23.9% |
Percentage of people that speak English not well or not at all:
| Glendale Hills: | 1.0% |
| Greensboro: | 2.7% |
Percentage of people born in this state:
Percentage of people born in another U.S. state:
Percentage of native residents but born outside the U.S.:
Percentage of foreign born residents:
| Here: | 68.5% |
| Greensboro: | 52.7% |
Percentage of people born in another U.S. state:
| Glendale Hills: | 20.7% |
| Greensboro: | 33.7% |
Percentage of native residents but born outside the U.S.:
| Here: | 0.5% |
| city: | 1.6% |
Percentage of foreign born residents:
| Here: | 10.8% |
| Greensboro: | 12.0% |
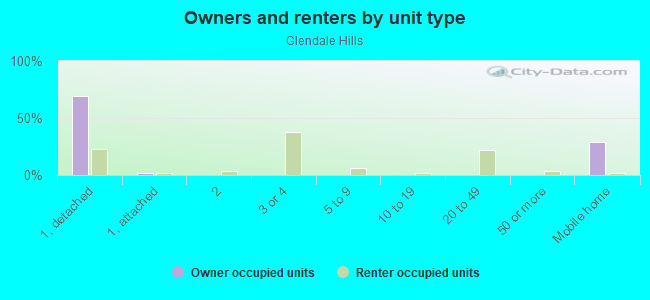
Owner-occupied
Renter-occupied

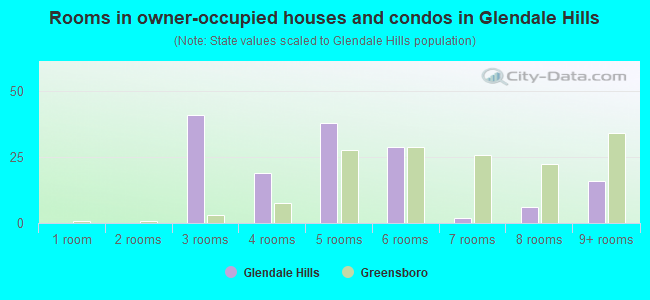
- Rooms in owner-occupied houses and condos in Glendale Hills
- 01 room
- 02 rooms
- 413 rooms
- 194 rooms
- 385 rooms
- 296 rooms
- 27 rooms
- 68 rooms
- 169+ rooms
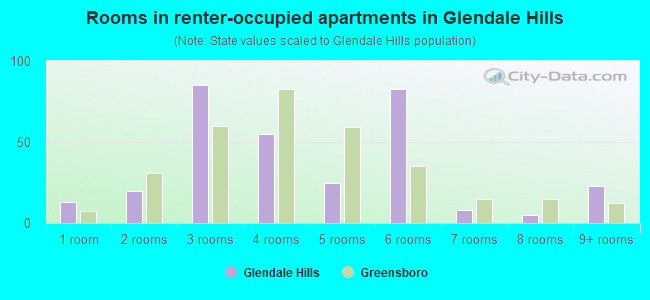
- Rooms in renter-occupied apartments in Glendale Hills
- 131 room
- 202 rooms
- 853 rooms
- 554 rooms
- 255 rooms
- 836 rooms
- 87 rooms
- 58 rooms
- 239+ rooms
Owner-occupied
Renter-occupied
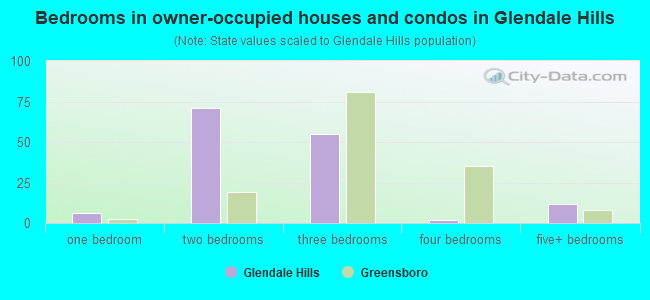
- Bedrooms in owner-occupied houses and condos in Glendale Hills
- 0no bedroom
- 61 bedroom
- 712 bedrooms
- 553 bedrooms
- 24 bedrooms
- 125+ bedrooms
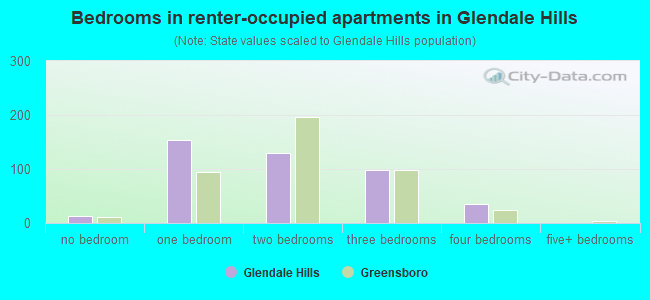
- Bedrooms in renter-occupied apartments in Glendale Hills
- 13no bedroom
- 1531 bedroom
- 1292 bedrooms
- 983 bedrooms
- 364 bedrooms
- 05+ bedrooms
Average number of cars or other vehicles available in houses/condos:
Average number of cars or other vehicles available in apartments:
| This neighborhood: | 2.3 |
| Greensboro: | 2.0 |
Average number of cars or other vehicles available in apartments:
| Here: | 1.4 |
| city: | 1.4 |
Percentage of units with a mortgage:
| Glendale Hills: | 40.3% |
| Greensboro: | 67.4% |
Average estimated value of detached houses in 2022 (60.3% of all units):
| Glendale Hills: | $105,632 |
| Greensboro: | $297,193 |
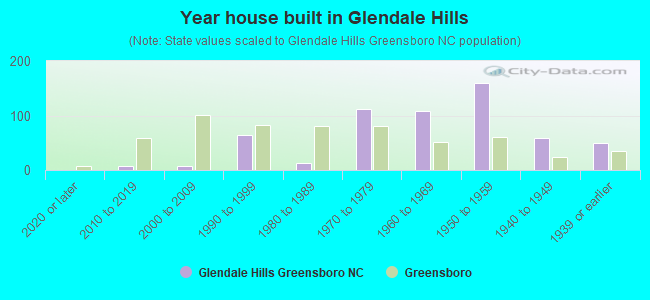
- Year house built in Glendale Hills
- 02020 or later
- 82010 to 2019
- 82000 to 2009
- 641990 to 1999
- 131980 to 1989
- 1121970 to 1979
- 1091960 to 1969
- 1591950 to 1959
- 581940 to 1949
- 501939 or earlier
City-data.com crime index for city in 2020 (higher means more crime):
| City: | 435.6 |
| U.S. average: | 219.5 |
Travel time to work (commute)
![Travel time to work (commute)]()
- 4Less than 5 minutes
- 535 to 9 minutes
- 2010 to 14 minutes
- 13015 to 19 minutes
- 14120 to 24 minutes
- 2125 to 29 minutes
- 1630 to 34 minutes
- 1435 to 39 minutes
- 1545 to 59 minutes
- 3060 to 89 minutes
- 990 or more minutes

Means of transportation to work
![Means of transportation to work]()
- 91.3%337Drove a car alone
- 4.9%18Carpooled
- 1.6%6Bus
- 2.2%8Walked
- 1.4%5Other means
- 11.1%41Worked at home

Time leaving home to go to work
![Time leaving home to go to work]()
- 812:00 a.m. to 4:59 a.m.
- 165:00 a.m. to 5:29 a.m.
- 55:30 a.m. to 5:59 a.m.
- 746:00 a.m. to 6:29 a.m.
- 316:30 a.m. to 6:59 a.m.
- 557:00 a.m. to 7:29 a.m.
- 417:30 a.m. to 7:59 a.m.
- 198:00 a.m. to 8:29 a.m.
- 588:30 a.m. to 8:59 a.m.
- 89:00 a.m. to 9:59 a.m.
- 2610:00 a.m. to 10:59 a.m.
- 611:00 a.m. to 11:59 a.m.
- 4812:00 p.m. to 3:59 p.m.
- 114:00 p.m. to 11:59 p.m.

Occupations of males:
- Percentage of males in management occupations (except farmers):
Here: 1.2% city: 10.2%
- Percentage of males in service occupations:
Here: 8.9% city: 14.3%
- Percentage of males in sales and office occupations:
Here: 3.6% city: 17.1%
- Percentage of males in construction, extraction, and maintenance occupations:
Here: 10.4% city: 6.0%
- Percentage of males in production occupations:
Here: 5.1% city: 7.5%
- Percentage of males in transportation occupations:
Here: 11.3% city: 6.8%
- Percentage of males in material moving occupations:
Here: 37.9% city: 9.6%
Occupations of females:
- Percentage of females in management occupations (except farmers):
Here: 2.5% city: 7.8%
- Percentage of females in business and financial operations occupations:
Here: 1.9% city: 5.5%
- Percentage of females in community and social services occupations:
Here: 2.5% city: 3.2%
- Percentage of females in education, training, and library occupations:
Here: 1.9% city: 10.3%
- Percentage of females in healthcare practitioners and technical occupations:
Here: 6.3% city: 8.6%
- Percentage of females in service occupations:
Here: 51.4% city: 19.4%
- Percentage of females in sales and office occupations:
Here: 11.0% city: 29.0%
- Percentage of females in production occupations:
Here: 19.9% city: 5.2%
- Percentage of females in transportation occupations:
Here: 1.7% city: 1.5%
Education in this neighborhood (subdivision or community):
- Percentage of people 3 years and older in K-12 schools:
Glendale Hills: 48.5% Greensboro: 17.6%
- Percentage of people 3 years and older in undergraduate colleges:
Glendale Hills: 5.1% Greensboro: 11.2%
- Percentage of people 3 years and older in grad. or professional schools:
Glendale Hills: 0.8% Greensboro: 2.6%
- Percentage of students K-12 enrolled in private schools:
Glendale Hills: 0.4% Greensboro: 13.3%
Percentage of population below poverty level:
| Glendale Hills: | 42.6% |
| Greensboro: | 21.9% |
Median year owner moved in (as recorded in 2022):
Median year renter moved in (as recorded in 2022):
| Glendale Hills: | 2000 |
| Greensboro: | 2010 |
Median year renter moved in (as recorded in 2022):
| Glendale Hills: | 2011 |
| Greensboro: | 2020 |
Percentage of married-couple families with both working:
| Glendale Hills: | 165.2% |
| Greensboro: | 70.9% |
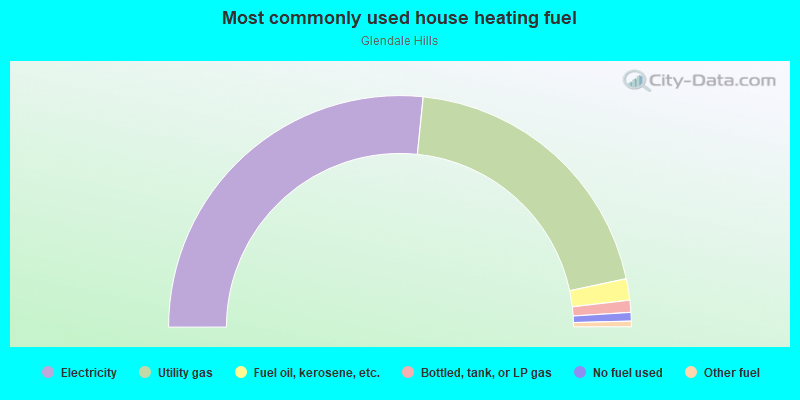
- 53.2%Electricity
- 40.1%Utility gas
- 3.0%Fuel oil, kerosene, etc.
- 1.7%Bottled, tank, or LP gas
- 1.2%No fuel used
- 0.8%Other fuel
Roads and streets:
State Rd 2770 (Huffine Mill Rd)
Length: 0.56 miles
Direction: SW-NE
Address range: 900 to 1361
Direction: SW-NE
Address range: 900 to 1361
Peterson Ave
Length: 0.47 miles
Directions: E-W, SE-NW
Address range: 3802 to 4199
Directions: E-W, SE-NW
Address range: 3802 to 4199
Kildare Dr
Length: 0.44 miles
Directions: E-W, SE-NW
Address range: 4200 to 4399
Directions: E-W, SE-NW
Address range: 4200 to 4399
Hampshire Dr
Length: 0.39 miles
Directions: E-W, SE-NW
Address range: 4100 to 4398
Directions: E-W, SE-NW
Address range: 4100 to 4398
Elwell Ave
Length: 0.39 miles
Direction: N-S
Address range: 800 to 1299
Direction: N-S
Address range: 800 to 1299
Wooddale Ln
Length: 0.38 miles
Direction: E-W
Address range: 3800 to 4197
Direction: E-W
Address range: 3800 to 4197
Mount Zion St
Length: 0.35 miles
Direction: N-S
Address range: 400 to 599
Direction: N-S
Address range: 400 to 599
Hern Ave
Length: 0.32 miles
Direction: N-S
Address range: 900 to 1199
Direction: N-S
Address range: 900 to 1199
Anderson St
Length: 0.26 miles
Directions: E-W, SW-NE
Address range: 4030 to 4499
Directions: E-W, SW-NE
Address range: 4030 to 4499
Easton Rd
Length: 0.23 miles
Direction: N-S
Address range: 1100 to 1199
Direction: N-S
Address range: 1100 to 1199
Oak Grove Ave
Length: 0.22 miles
Directions: E-W, SE-NW
Address range: 3900 to 4199
Directions: E-W, SE-NW
Address range: 3900 to 4199
Aunt Mary Ave
Length: 0.21 miles
Direction: N-S
Address range: 200 to 399
Direction: N-S
Address range: 200 to 399
Foushee St
Length: 0.16 miles
Direction: N-S
Address range: 900 to 1098
Direction: N-S
Address range: 900 to 1098
Lacy Ave
Length: 0.16 miles
Direction: E-W
Address range: 3900 to 3999
Direction: E-W
Address range: 3900 to 3999
Granbury Dr
Length: 0.15 miles
Directions: E-W, SE-NW
Address range: 4100 to 4199
Directions: E-W, SE-NW
Address range: 4100 to 4199
Woodnell St
Length: 0.11 miles
Directions: N-S, SE-NW
Address range: 1000 to 1199
Directions: N-S, SE-NW
Address range: 1000 to 1199
Quad Oak Dr
Length: 0.10 miles
Directions: E-W, SE-NW
Address range: 1 to 99
Directions: E-W, SE-NW
Address range: 1 to 99
Valley View St
Length: 0.08 miles
Direction: N-S
Address range: 1100 to 1199
Direction: N-S
Address range: 1100 to 1199
Esquire Ct
Length: 0.08 miles
Directions: N-S, SE-NW, SW-NE
Address range: 1 to 99
Directions: N-S, SE-NW, SW-NE
Address range: 1 to 99
Larchmont Dr
Length: 0.05 miles
Direction: N-S
Address range: 1200 to 1299
Direction: N-S
Address range: 1200 to 1299