Glen Hazel neighborhood in Pittsburgh, Pennsylvania (PA), 15207 detailed profile
Settings
X


Business Search - 14 Million verified businesses
Area: 0.456 square miles
Population: 641
Population density:
| Glen Hazel: | 1,407 people per square mile |
| Pittsburgh: | 5,449 people per square mile |

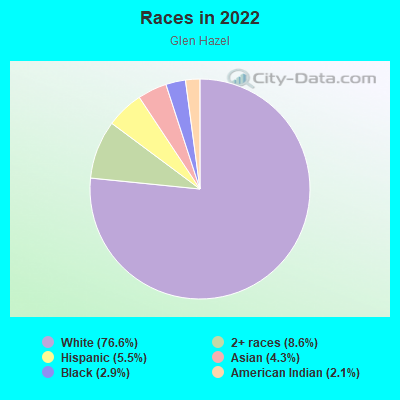
- 50176.6%White
- 568.6%Two or more races
- 365.5%Hispanic or Latino
- 284.3%Asian
- 192.9%Black
- 142.1%American Indian
Median household income in 2022:
| Glen Hazel: | $109,417 |
| Pittsburgh: | $63,380 |
Distribution of median household income
![Distribution of median household income]()
- 11Less than $10,000
- 187$10,000 to $19,999
- 59$20,000 to $29,999
- 46$30,000 to $39,999
- 14$40,000 to $49,999
- 17$50,000 to $59,999
- 25$60,000 to $74,999
- 71$75,000 to $99,999
- 30$100,000 to $124,999
- 37$125,000 to $149,999
- 50$150,000 to $199,999
- 51$200,000 or more

Distribution of owner-occupied house/condo value
![Distribution of owner-occupied house/condo value]()
- 10Less than $50,000
- 8$50,000 to $99,999
- 37$100,000 to $149,999
- 18$150,000 to $199,999
- 63$200,000 to $249,999
- 66$250,000 to $299,999
- 93$300,000 to $399,999
- 24$400,000 to $499,999
- 155$500,000 to $749,999
- 14$750,000 to $999,999
- 45$1,000,000 or more

Distribution of rent paid by renters
![Distribution of rent paid by renters]()
- 65$200 to $299
- 38$300 to $399
- 51$400 to $499
- 6$500 to $599
- 36$600 to $699
- 27$700 to $799
- 77$800 to $899
- 10$900 to $999
- 96$1,000 to $1,249
- 9$1,250 to $1,499
- 17$1,500 to $1,999
- 44$2,000 or more

Median rent in 2022:
| Glen Hazel: | $1,625 |
| Pittsburgh: | $981 |
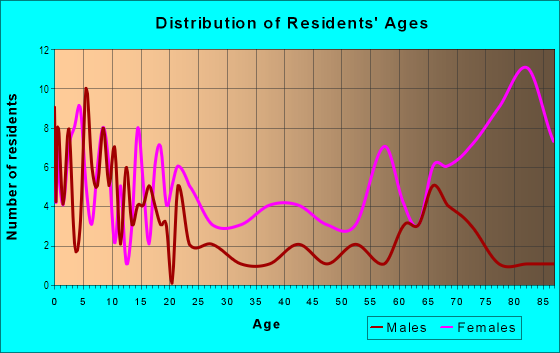
| Males: | 327 |
| Females: | 314 |
Males:
| This neighborhood: | 50.3 years |
| Whole city: | 33.3 years |
| This neighborhood: | 46.4 years |
| Whole city: | 32.9 years |
Average household size:
| Glen Hazel: | 26.0 people |
| Pittsburgh: | 24.0 people |
Percentage of family households:
| Glen Hazel: | 44.6% |
| Pittsburgh: | 28.6% |
| Here: | 52.5% |
| Pittsburgh: | 27.2% |
Percentage of married-couple families with children (among all households):
| Glen Hazel: | 47.5% |
| Pittsburgh: | 24.6% |
Percentage of single-mother households (among all households):
| Glen Hazel: | 1.1% |
| Pittsburgh: | 14.6% |
Percentage of never married males 15 years old and over:
Percentage of never married females 15 years old and over:
| Glen Hazel: | 11.6% |
| Pittsburgh: | 28.4% |
Percentage of never married females 15 years old and over:
| Glen Hazel: | 15.7% |
| city: | 27.6% |
Percentage of people that speak English not well or not at all:
| Glen Hazel: | 0.0% |
| Pittsburgh: | 1.2% |
Percentage of people born in this state:
Percentage of people born in another U.S. state:
Percentage of native residents but born outside the U.S.:
Percentage of foreign born residents:
| Here: | 46.7% |
| Pittsburgh: | 65.9% |
Percentage of people born in another U.S. state:
| Glen Hazel: | 29.7% |
| Pittsburgh: | 24.4% |
Percentage of native residents but born outside the U.S.:
| Here: | 3.9% |
| city: | 1.5% |
Percentage of foreign born residents:
| Here: | 19.7% |
| Pittsburgh: | 8.2% |
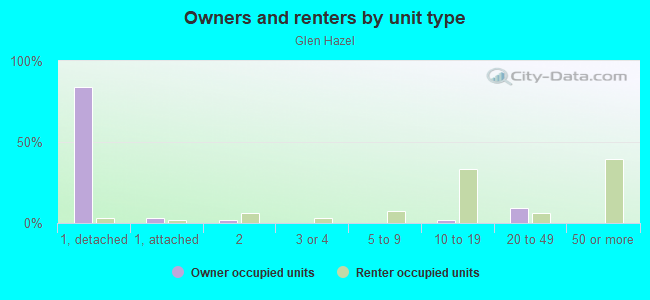
Owner-occupied
Renter-occupied

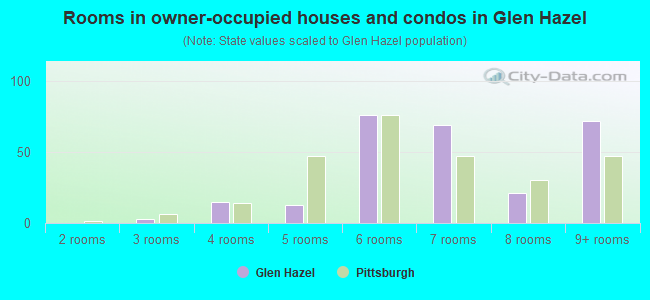
- Rooms in owner-occupied houses and condos in Glen Hazel
- 01 room
- 02 rooms
- 33 rooms
- 154 rooms
- 135 rooms
- 766 rooms
- 697 rooms
- 218 rooms
- 729+ rooms
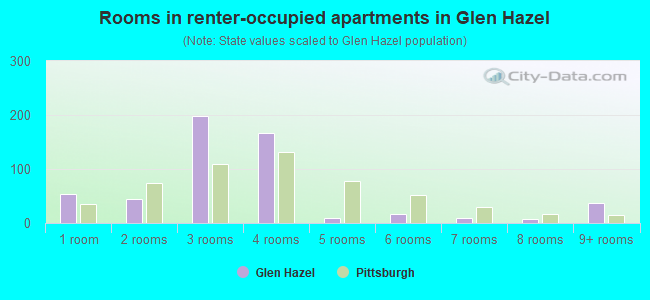
- Rooms in renter-occupied apartments in Glen Hazel
- 541 room
- 442 rooms
- 1983 rooms
- 1674 rooms
- 95 rooms
- 166 rooms
- 97 rooms
- 88 rooms
- 379+ rooms
Owner-occupied
Renter-occupied
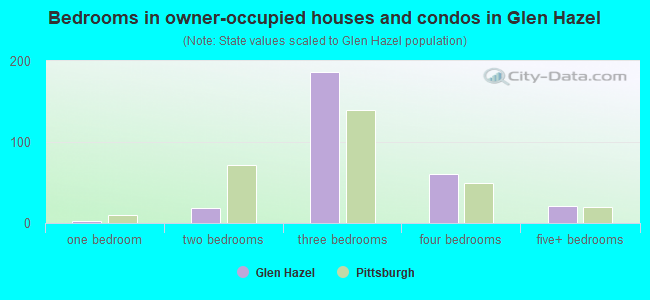
- Bedrooms in owner-occupied houses and condos in Glen Hazel
- 0no bedroom
- 31 bedroom
- 192 bedrooms
- 1873 bedrooms
- 614 bedrooms
- 215+ bedrooms
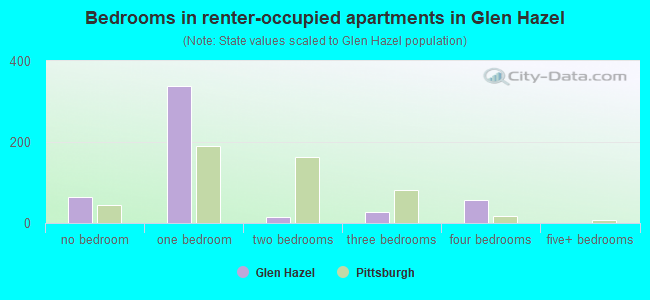
- Bedrooms in renter-occupied apartments in Glen Hazel
- 65no bedroom
- 3391 bedroom
- 162 bedrooms
- 263 bedrooms
- 584 bedrooms
- 05+ bedrooms
Average number of cars or other vehicles available in houses/condos:
Average number of cars or other vehicles available in apartments:
| This neighborhood: | 1.6 |
| Pittsburgh: | 1.5 |
Average number of cars or other vehicles available in apartments:
| Here: | 1.0 |
| city: | 0.9 |
Percentage of units with a mortgage:
| Glen Hazel: | 51.4% |
| Pittsburgh: | 56.7% |
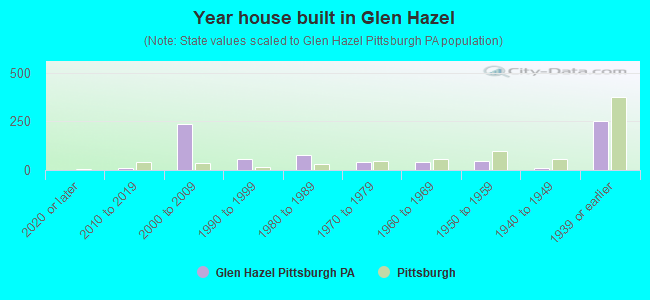
- Year house built in Glen Hazel
- 02020 or later
- 92010 to 2019
- 2382000 to 2009
- 561990 to 1999
- 751980 to 1989
- 411970 to 1979
- 391960 to 1969
- 481950 to 1959
- 91940 to 1949
- 2501939 or earlier
City-data.com crime index for city in 2019 (higher means more crime):
| City: | 257.1 |
| U.S. average: | 223.9 |
Travel time to work (commute)
![Travel time to work (commute)]()
- 285 to 9 minutes
- 9810 to 14 minutes
- 34815 to 19 minutes
- 34020 to 24 minutes
- 9325 to 29 minutes
- 17330 to 34 minutes
- 1335 to 39 minutes
- 2740 to 44 minutes
- 5645 to 59 minutes
- 5260 to 89 minutes
- 990 or more minutes

Means of transportation to work
![Means of transportation to work]()
- 37.9%127Drove a car alone
- 8.7%29Carpooled
- 8.7%29Bus
- 8.7%29Bicycle
- 17.6%59Walked
- 5.7%19Other means
- 35.2%118Worked at home

Time leaving home to go to work
![Time leaving home to go to work]()
- 265:00 a.m. to 5:29 a.m.
- 885:30 a.m. to 5:59 a.m.
- 846:00 a.m. to 6:29 a.m.
- 756:30 a.m. to 6:59 a.m.
- 957:00 a.m. to 7:29 a.m.
- 2717:30 a.m. to 7:59 a.m.
- 2668:00 a.m. to 8:29 a.m.
- 798:30 a.m. to 8:59 a.m.
- 1079:00 a.m. to 9:59 a.m.
- 6110:00 a.m. to 10:59 a.m.
- 1511:00 a.m. to 11:59 a.m.
- 5112:00 p.m. to 3:59 p.m.
- 194:00 p.m. to 11:59 p.m.

Occupations of males:
- Percentage of males in management occupations (except farmers):
Here: 5.6% city: 11.1%
- Percentage of males in business and financial operations occupations:
Here: 28.9% city: 8.0%
- Percentage of males in computer and mathematical occupations:
Here: 5.6% city: 9.0%
- Percentage of males in architecture and engineering occupations:
Here: 10.0% city: 3.4%
- Percentage of males in life, physical, and social science occupations:
Here: 8.9% city: 2.7%
- Percentage of males in community and social services occupations:
Here: 5.9% city: 1.6%
- Percentage of males in legal occupations:
Here: 12.8% city: 1.8%
- Percentage of males in education, training, and library occupations:
Here: 19.4% city: 7.0%
- Percentage of males in arts, design, entertainment, sports, and media occupations:
Here: 13.2% city: 3.0%
- Percentage of males in healthcare practitioners and technical occupations:
Here: 8.9% city: 6.1%
- Percentage of males in service occupations:
Here: 21.8% city: 14.7%
- Percentage of males in sales and office occupations:
Here: 32.1% city: 12.2%
- Percentage of males in construction, extraction, and maintenance occupations:
Here: 3.3% city: 5.0%
- Percentage of males in production occupations:
Here: 12.2% city: 3.3%
- Percentage of males in transportation occupations:
Here: 5.9% city: 4.4%
Occupations of females:
- Percentage of females in management occupations (except farmers):
Here: 10.7% city: 8.7%
- Percentage of females in business and financial operations occupations:
Here: 19.5% city: 8.1%
- Percentage of females in computer and mathematical occupations:
Here: 7.3% city: 2.8%
- Percentage of females in architecture and engineering occupations:
Here: 8.3% city: 1.2%
- Percentage of females in life, physical, and social science occupations:
Here: 6.4% city: 2.1%
- Percentage of females in community and social services occupations:
Here: 12.8% city: 3.4%
- Percentage of females in legal occupations:
Here: 4.4% city: 2.3%
- Percentage of females in education, training, and library occupations:
Here: 21.0% city: 9.9%
- Percentage of females in arts, design, entertainment, sports, and media occupations:
Here: 2.3% city: 3.0%
- Percentage of females in healthcare practitioners and technical occupations:
Here: 11.7% city: 10.9%
- Percentage of females in service occupations:
Here: 25.2% city: 20.1%
- Percentage of females in sales and office occupations:
Here: 17.1% city: 23.5%
- Percentage of females in production occupations:
Here: 9.0% city: 1.3%
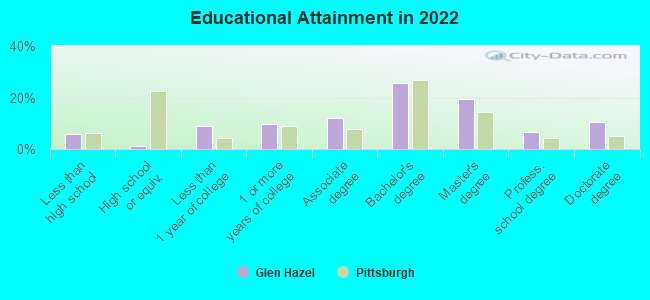
Education in this neighborhood (subdivision or community):
- Percentage of people 3 years and older in K-12 schools:
Glen Hazel: 33.8% Pittsburgh: 10.4%
- Percentage of people 3 years and older in undergraduate colleges:
Glen Hazel: 1.9% Pittsburgh: 12.9%
- Percentage of people 3 years and older in grad. or professional schools:
Glen Hazel: 6.8% Pittsburgh: 4.1%
- Percentage of students K-12 enrolled in private schools:
Glen Hazel: 47.2% Pittsburgh: 19.6%
Percentage of population below poverty level:
| Glen Hazel: | 10.2% |
| Pittsburgh: | 19.0% |
Median year owner moved in (as recorded in 2022):
Median year renter moved in (as recorded in 2022):
| Glen Hazel: | 2000 |
| Pittsburgh: | 2007 |
Median year renter moved in (as recorded in 2022):
| Glen Hazel: | 2019 |
| Pittsburgh: | 2020 |
Percentage of married-couple families with both working:
| Glen Hazel: | 100.0% |
| Pittsburgh: | 79.2% |
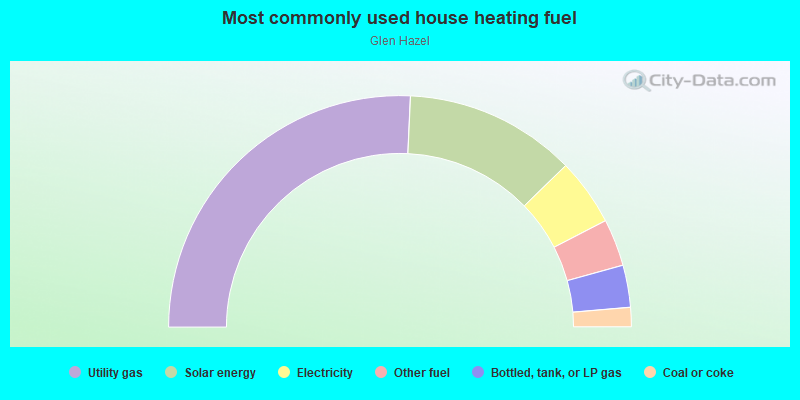
- 51.5%Utility gas
- 24.0%Solar energy
- 9.4%Electricity
- 6.6%Other fuel
- 5.9%Bottled, tank, or LP gas
- 2.7%Coal or coke
Roads and streets:
2nd Ave
Length: 1.40 miles
Directions: E-W, SE-NW, SW-NE
Directions: E-W, SE-NW, SW-NE
Johnston Ave
Length: 0.83 miles
Directions: E-W, N-S, SE-NW, SW-NE
Address range: 640 to 872
Directions: E-W, N-S, SE-NW, SW-NE
Address range: 640 to 872
Rivermont Dr
Length: 0.55 miles
Directions: E-W, N-S, SE-NW, SW-NE
Address range: 674 to 1099
Directions: E-W, N-S, SE-NW, SW-NE
Address range: 674 to 1099
Broadview Dr
Length: 0.28 miles
Directions: E-W, N-S, SE-NW, SW-NE
Address range: 800 to 1099
Directions: E-W, N-S, SE-NW, SW-NE
Address range: 800 to 1099
Roselle Ct
Length: 0.11 miles
Directions: N-S, SW-NE
Address range: 2 to 999
Directions: N-S, SW-NE
Address range: 2 to 999
Cove Pl
Length: 0.09 miles
Directions: E-W, N-S, SE-NW, SW-NE
Address range: 800 to 899
Directions: E-W, N-S, SE-NW, SW-NE
Address range: 800 to 899
Roselle Dr
Length: 0.08 miles
Directions: E-W, N-S, SE-NW
Directions: E-W, N-S, SE-NW
Broadview St
Length: 0.07 miles
Directions: E-W, N-S, SE-NW, SW-NE
Directions: E-W, N-S, SE-NW, SW-NE
Homestead Brg
Length: 0.05 miles
Direction: SE-NW
Direction: SE-NW
Marigold Ln
Length: 0.04 miles
Direction: SE-NW
Direction: SE-NW
Railroad features:
Baltimore and Ohio RR
Length: 1.38 miles
Directions: E-W, SW-NE
Directions: E-W, SW-NE