Glen Crest neighborhood in San Jose, California (CA), 95120 detailed profile
Settings
X

Business Search - 14 Million verified businesses
Area: 0.148 square miles
Population: 4,359
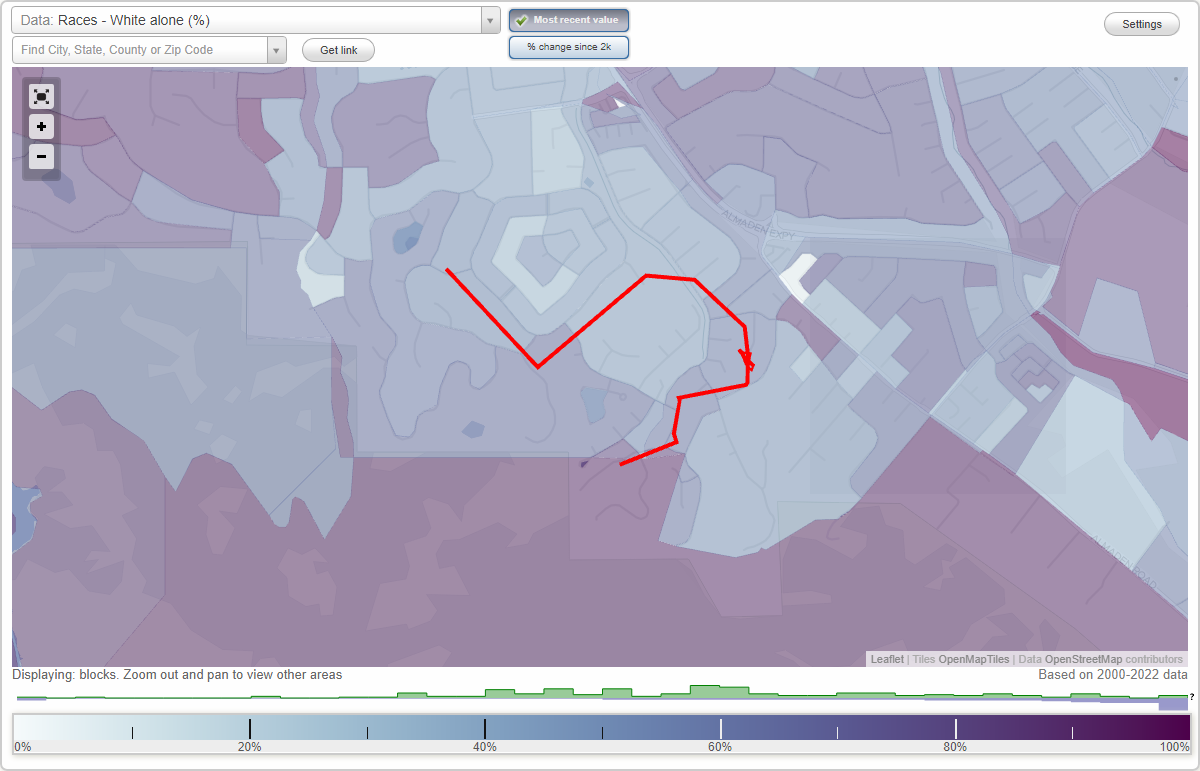
Population density:
| Glen Crest: | 29,532 people per square mile |
| San Jose: | 5,554 people per square mile |

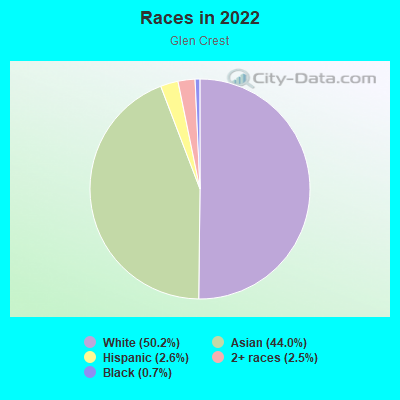
- 2,18950.2%White
- 1,91644.0%Asian
- 1132.6%Hispanic or Latino
- 1102.5%Two or more races
- 300.7%Black
Median household income in 2022:
| Glen Crest: | $241,440 |
| San Jose: | $133,835 |
Distribution of median household income
![Distribution of median household income]()
- 23Less than $10,000
- 9$10,000 to $19,999
- 59$30,000 to $39,999
- 45$40,000 to $49,999
- 18$50,000 to $59,999
- 124$60,000 to $74,999
- 55$75,000 to $99,999
- 62$100,000 to $124,999
- 30$125,000 to $149,999
- 149$150,000 to $199,999
- 914$200,000 or more

Distribution of owner-occupied house/condo value
![Distribution of owner-occupied house/condo value]()
- 30Less than $50,000
- 18$500,000 to $749,999
- 141$750,000 to $999,999
- 1,065$1,000,000 or more

Distribution of rent paid by renters
![Distribution of rent paid by renters]()
- 15$1,500 to $1,999
- 200$2,000 or more

Median rent in 2022:
| Glen Crest: | $3,501 |
| San Jose: | $2,001 |
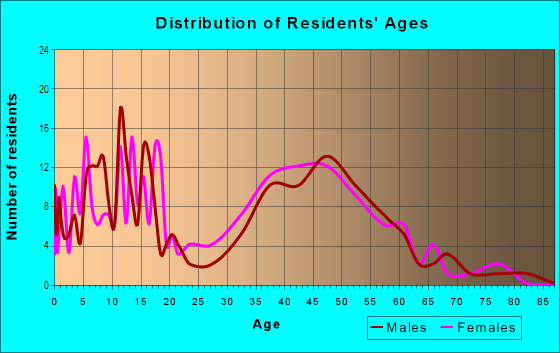
| Males: | 2,352 |
| Females: | 2,007 |
Males:
| This neighborhood: | 43.8 years |
| Whole city: | 37.6 years |
| This neighborhood: | 49.2 years |
| Whole city: | 39.1 years |
Average household size:
| Glen Crest: | 2.9 people |
| San Jose: | 2.9 people |
Percentage of family households:
| Glen Crest: | 56.6% |
| San Jose: | 49.9% |
| Here: | 77.2% |
| San Jose: | 53.0% |
Percentage of married-couple families with children (among all households):
| Glen Crest: | 30.7% |
| San Jose: | 25.8% |
Percentage of single-mother households (among all households):
| Glen Crest: | 2.1% |
| San Jose: | 5.2% |
Percentage of never married males 15 years old and over:
Percentage of never married females 15 years old and over:
| Glen Crest: | 11.8% |
| San Jose: | 20.9% |
Percentage of never married females 15 years old and over:
| Glen Crest: | 6.7% |
| city: | 16.7% |
Percentage of people that speak English not well or not at all:
| Glen Crest: | 0.0% |
| San Jose: | 11.4% |
Percentage of people born in this state:
Percentage of people born in another U.S. state:
Percentage of native residents but born outside the U.S.:
Percentage of foreign born residents:
| Here: | 47.4% |
| San Jose: | 46.1% |
Percentage of people born in another U.S. state:
| Glen Crest: | 19.3% |
| San Jose: | 10.4% |
Percentage of native residents but born outside the U.S.:
| Here: | 0.9% |
| city: | 1.7% |
Percentage of foreign born residents:
| Here: | 32.3% |
| San Jose: | 41.8% |
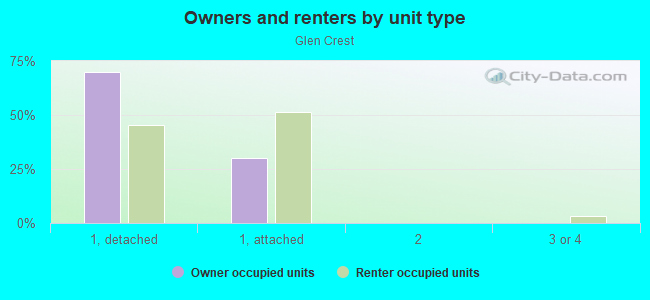
Owner-occupied
Renter-occupied

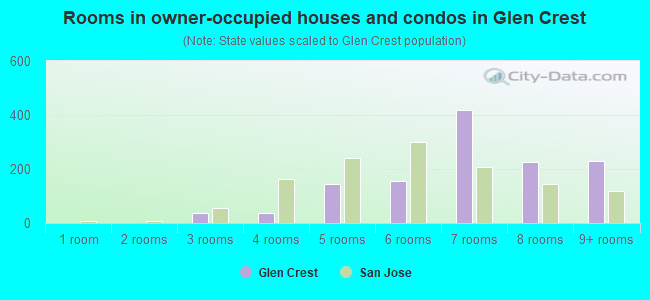
- Rooms in owner-occupied houses and condos in Glen Crest
- 01 room
- 02 rooms
- 383 rooms
- 364 rooms
- 1465 rooms
- 1546 rooms
- 4187 rooms
- 2278 rooms
- 2309+ rooms
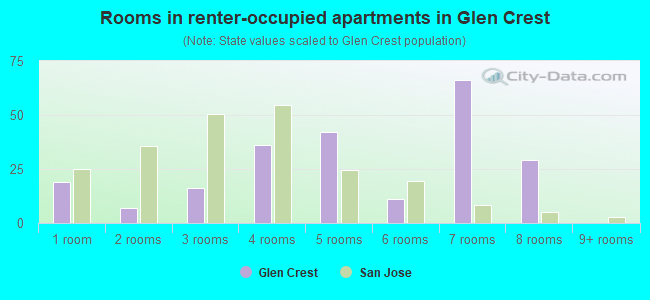
- Rooms in renter-occupied apartments in Glen Crest
- 191 room
- 72 rooms
- 163 rooms
- 364 rooms
- 425 rooms
- 116 rooms
- 667 rooms
- 298 rooms
- 09+ rooms
Owner-occupied
Renter-occupied
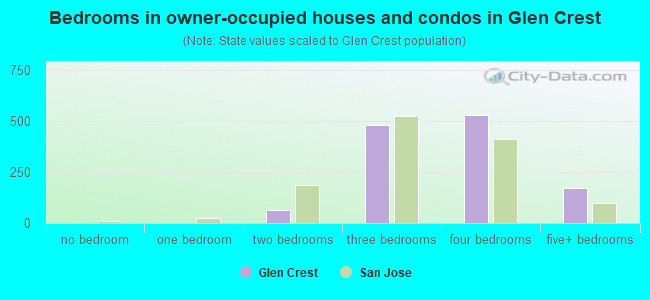
- Bedrooms in owner-occupied houses and condos in Glen Crest
- 0no bedroom
- 01 bedroom
- 642 bedrooms
- 4833 bedrooms
- 5304 bedrooms
- 1745+ bedrooms
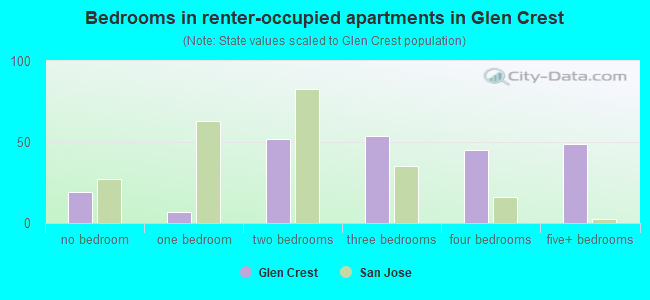
- Bedrooms in renter-occupied apartments in Glen Crest
- 19no bedroom
- 71 bedroom
- 522 bedrooms
- 543 bedrooms
- 454 bedrooms
- 495+ bedrooms
Average number of cars or other vehicles available in houses/condos:
Average number of cars or other vehicles available in apartments:
| This neighborhood: | 2.3 |
| San Jose: | 2.3 |
Average number of cars or other vehicles available in apartments:
| Here: | 2.0 |
| city: | 1.6 |
Percentage of units with a mortgage:
| Glen Crest: | 66.5% |
| San Jose: | 66.9% |
Housing prices:
- Average estimated value of detached houses in 2022 (68.5% of all units):
Glen Crest: $1,770,657 San Jose: $1,532,815
- Average estimated value of townhouses or other attached units in 2022 (31.0% of all units):
This neighborhood: $1,048,132 city: $1,024,857
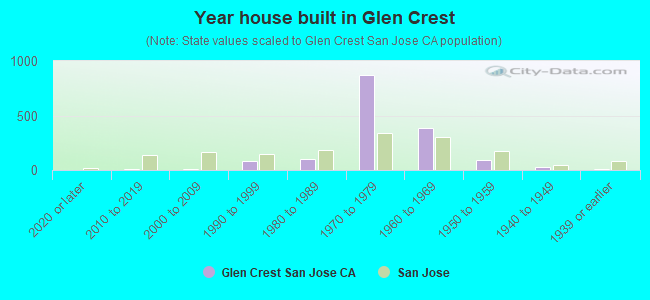
- Year house built in Glen Crest
- 02020 or later
- 82010 to 2019
- 102000 to 2009
- 851990 to 1999
- 1011980 to 1989
- 8751970 to 1979
- 3841960 to 1969
- 881950 to 1959
- 261940 to 1949
- 131939 or earlier
City-data.com crime index for city in 2020 (higher means more crime):
| City: | 268.4 |
| U.S. average: | 219.5 |
Travel time to work (commute)
![Travel time to work (commute)]()
- 29Less than 5 minutes
- 145 to 9 minutes
- 3210 to 14 minutes
- 21415 to 19 minutes
- 10220 to 24 minutes
- 7925 to 29 minutes
- 12930 to 34 minutes
- 10435 to 39 minutes
- 11740 to 44 minutes
- 32545 to 59 minutes
- 18760 to 89 minutes
- 4290 or more minutes

Means of transportation to work
![Means of transportation to work]()
- 58.7%1,162Drove a car alone
- 8.2%162Carpooled
- 0.8%16Bus
- 0.8%16Long-distance train or commuter rail
- 0.4%8Light rail, streetcar or trolley
- 0.7%13Other means
- 30.3%599Worked at home

Time leaving home to go to work
![Time leaving home to go to work]()
- 1612:00 a.m. to 4:59 a.m.
- 275:30 a.m. to 5:59 a.m.
- 546:00 a.m. to 6:29 a.m.
- 2026:30 a.m. to 6:59 a.m.
- 1297:00 a.m. to 7:29 a.m.
- 1437:30 a.m. to 7:59 a.m.
- 2658:00 a.m. to 8:29 a.m.
- 1678:30 a.m. to 8:59 a.m.
- 1109:00 a.m. to 9:59 a.m.
- 13510:00 a.m. to 10:59 a.m.
- 5411:00 a.m. to 11:59 a.m.
- 5712:00 p.m. to 3:59 p.m.
- 164:00 p.m. to 11:59 p.m.

Occupations of males:
- Percentage of males in management occupations (except farmers):
Here: 29.6% city: 13.0%
- Percentage of males in business and financial operations occupations:
Here: 6.0% city: 4.6%
- Percentage of males in computer and mathematical occupations:
Here: 33.0% city: 13.6%
- Percentage of males in architecture and engineering occupations:
Here: 7.1% city: 10.2%
- Percentage of males in legal occupations:
Here: 2.1% city: 0.8%
- Percentage of males in arts, design, entertainment, sports, and media occupations:
Here: 2.0% city: 1.8%
- Percentage of males in healthcare practitioners and technical occupations:
Here: 1.9% city: 2.0%
- Percentage of males in service occupations:
Here: 1.1% city: 12.7%
- Percentage of males in sales and office occupations:
Here: 12.8% city: 12.8%
- Percentage of males in construction, extraction, and maintenance occupations:
Here: 1.1% city: 7.8%
- Percentage of males in transportation occupations:
Here: 1.2% city: 3.6%
Occupations of females:
- Percentage of females in management occupations (except farmers):
Here: 12.4% city: 11.0%
- Percentage of females in business and financial operations occupations:
Here: 19.2% city: 8.6%
- Percentage of females in computer and mathematical occupations:
Here: 7.2% city: 5.4%
- Percentage of females in architecture and engineering occupations:
Here: 6.7% city: 2.8%
- Percentage of females in legal occupations:
Here: 2.3% city: 1.3%
- Percentage of females in education, training, and library occupations:
Here: 20.4% city: 8.1%
- Percentage of females in healthcare practitioners and technical occupations:
Here: 9.7% city: 6.8%
- Percentage of females in service occupations:
Here: 9.0% city: 21.7%
- Percentage of females in sales and office occupations:
Here: 12.4% city: 22.0%
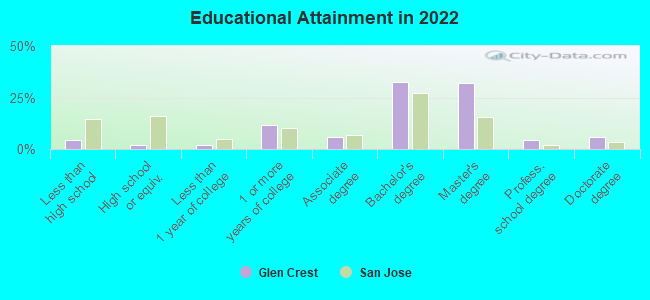
Education in this neighborhood (subdivision or community):
- Percentage of people 3 years and older in K-12 schools:
Glen Crest: 22.7% San Jose: 16.1%
- Percentage of people 3 years and older in undergraduate colleges:
Glen Crest: 5.9% San Jose: 6.5%
- Percentage of people 3 years and older in grad. or professional schools:
Glen Crest: 1.1% San Jose: 2.0%
- Percentage of students K-12 enrolled in private schools:
Glen Crest: 12.7% San Jose: 14.9%
Percentage of population below poverty level:
| Glen Crest: | 0.7% |
| San Jose: | 9.0% |
Median year owner moved in (as recorded in 2022):
Median year renter moved in (as recorded in 2022):
| Glen Crest: | 2004 |
| San Jose: | 2008 |
Median year renter moved in (as recorded in 2022):
| Glen Crest: | 2018 |
| San Jose: | 2020 |
Percentage of married-couple families with both working:
| Glen Crest: | 66.0% |
| San Jose: | 72.5% |
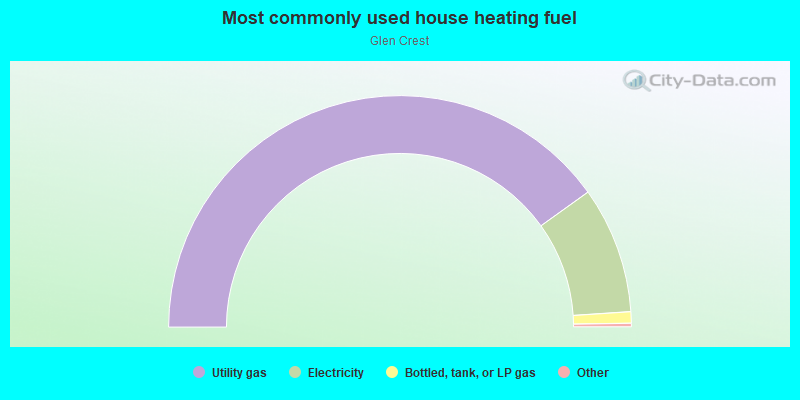
- 80.2%Utility gas
- 17.7%Electricity
- 1.6%Bottled, tank, or LP gas
Roads and streets:
Valley Quail Cir
Length: 1.12 miles
Directions: E-W, N-S, SE-NW, SW-NE
Address range: 1112 to 1223
Directions: E-W, N-S, SE-NW, SW-NE
Address range: 1112 to 1223
Quail Creek Cir
Length: 0.90 miles
Directions: E-W, N-S, SE-NW, SW-NE
Address range: 1000 to 1399
Directions: E-W, N-S, SE-NW, SW-NE
Address range: 1000 to 1399
Mountain Quail Cir
Length: 0.39 miles
Directions: E-W, N-S, SE-NW, SW-NE
Address range: 1100 to 1399
Directions: E-W, N-S, SE-NW, SW-NE
Address range: 1100 to 1399
Quail Cove Way
Length: 0.25 miles
Directions: N-S, SE-NW
Address range: 7000 to 7098
Directions: N-S, SE-NW
Address range: 7000 to 7098
Quail Dunes Way
Length: 0.06 miles
Directions: E-W, SW-NE
Directions: E-W, SW-NE
Quail Knoll Ct
Length: 0.06 miles
Directions: E-W, N-S, SE-NW, SW-NE
Address range: 1100 to 1199
Directions: E-W, N-S, SE-NW, SW-NE
Address range: 1100 to 1199
McCall Dr
Length: 0.06 miles
Direction: N-S
Direction: N-S
Hollow Tree Way
Length: 0.06 miles
Direction: SW-NE
Direction: SW-NE
Serenity Way
Length: 0.05 miles
Direction: N-S
Direction: N-S
Hollow Park Ct
Length: 0.03 miles
Direction: E-W
Address range: 1100 to 1199
Direction: E-W
Address range: 1100 to 1199
Quail Cove Ct
Length: 0.01 miles
Direction: SW-NE
Address range: 7001 to 7099
Direction: SW-NE
Address range: 7001 to 7099