General Donovan neighborhood in Lawrence, Massachusetts (MA), 01840, 01841 detailed profile
Settings
X


Business Search - 14 Million verified businesses
Area: 0.205 square miles
Population: 2,254
Population density:
| General Donovan: | 11,002 people per square mile |
| Lawrence: | 12,637 people per square mile |

- 2,10591.3%Hispanic or Latino
- 934.0%White
- 462.0%Black
- 371.6%Two or more races
- 241.0%Some other race

Median household income in 2022:
| General Donovan: | $34,153 |
| Lawrence: | $60,632 |
Distribution of median household income
![Distribution of median household income]()
- 96Less than $10,000
- 376$10,000 to $19,999
- 215$20,000 to $29,999
- 144$30,000 to $39,999
- 68$40,000 to $49,999
- 88$50,000 to $59,999
- 70$60,000 to $74,999
- 76$75,000 to $99,999
- 43$100,000 to $124,999
- 36$125,000 to $149,999
- 32$150,000 to $199,999
- 34$200,000 or more

Distribution of owner-occupied house/condo value
![Distribution of owner-occupied house/condo value]()
- 15Less than $50,000
- 54$50,000 to $99,999
- 17$100,000 to $149,999
- 25$150,000 to $199,999
- 7$200,000 to $249,999
- 9$250,000 to $299,999
- 33$300,000 to $399,999
- 27$400,000 to $499,999
- 285$500,000 to $749,999
- 27$750,000 to $999,999
- 9$1,000,000 or more

Distribution of rent paid by renters
![Distribution of rent paid by renters]()
- 91Less than $100
- 71$100 to $199
- 91$200 to $299
- 74$300 to $399
- 40$400 to $499
- 53$500 to $599
- 122$600 to $699
- 159$700 to $799
- 28$800 to $899
- 462$900 to $999
- 76$1,000 to $1,249
- 139$1,250 to $1,499
- 73$1,500 to $1,999
- 24$2,000 or more

Median rent in 2022:
| General Donovan: | $790 |
| Lawrence: | $1,319 |
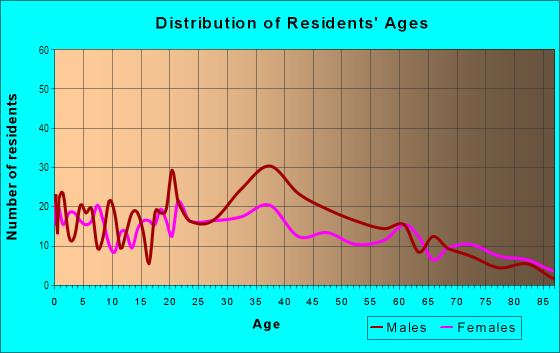
| Males: | 986 |
| Females: | 1,268 |
Males:
| This neighborhood: | 40.7 years |
| Whole city: | 27.9 years |
| This neighborhood: | 42.0 years |
| Whole city: | 33.8 years |
Average household size:
| General Donovan: | 5.1 people |
| Lawrence: | 2.9 people |
Percentage of family households:
| General Donovan: | 33.4% |
| Lawrence: | 57.5% |
| Here: | 21.4% |
| Lawrence: | 24.9% |
Percentage of married-couple families with children (among all households):
| General Donovan: | 42.0% |
| Lawrence: | 9.3% |
Percentage of single-mother households (among all households):
| General Donovan: | 22.9% |
| Lawrence: | 21.5% |
Percentage of never married males 15 years old and over:
Percentage of never married females 15 years old and over:
| General Donovan: | 17.2% |
| Lawrence: | 21.9% |
Percentage of never married females 15 years old and over:
| General Donovan: | 18.8% |
| city: | 29.9% |
Percentage of people that speak English not well or not at all:
| General Donovan: | 36.9% |
| Lawrence: | 25.6% |
Percentage of people born in this state:
Percentage of people born in another U.S. state:
Percentage of native residents but born outside the U.S.:
Percentage of foreign born residents:
| Here: | 29.0% |
| Lawrence: | 38.9% |
Percentage of people born in another U.S. state:
| General Donovan: | 6.1% |
| Lawrence: | 7.7% |
Percentage of native residents but born outside the U.S.:
| Here: | 17.3% |
| city: | 6.8% |
Percentage of foreign born residents:
| Here: | 47.6% |
| Lawrence: | 46.6% |

Owner-occupied
Renter-occupied


- Rooms in owner-occupied houses and condos in General Donovan
- 01 room
- 452 rooms
- 43 rooms
- 284 rooms
- 435 rooms
- 2716 rooms
- 157 rooms
- 138 rooms
- 39+ rooms

- Rooms in renter-occupied apartments in General Donovan
- 2671 room
- 432 rooms
- 1703 rooms
- 2944 rooms
- 3445 rooms
- 466 rooms
- 507 rooms
- 118 rooms
- 479+ rooms
Owner-occupied
Renter-occupied

- Bedrooms in owner-occupied houses and condos in General Donovan
- 0no bedroom
- 451 bedroom
- 262 bedrooms
- 903 bedrooms
- 304 bedrooms
- 125+ bedrooms

- Bedrooms in renter-occupied apartments in General Donovan
- 267no bedroom
- 3151 bedroom
- 3102 bedrooms
- 973 bedrooms
- 794 bedrooms
- 175+ bedrooms
Average number of cars or other vehicles available in houses/condos:
Average number of cars or other vehicles available in apartments:
| This neighborhood: | |
| Lawrence: |
Average number of cars or other vehicles available in apartments:
| Here: | 0.6 |
| city: | 1.1 |
Percentage of units with a mortgage:
| General Donovan: | 97.4% |
| Lawrence: | 72.0% |

- Year house built in General Donovan
- 02020 or later
- 592010 to 2019
- 252000 to 2009
- 1401990 to 1999
- 931980 to 1989
- 1961970 to 1979
- 1081960 to 1969
- 2401950 to 1959
- 1271940 to 1949
- 3581939 or earlier

City-data.com crime index for city in 2020 (higher means more crime):
| City: | 158.9 |
| U.S. average: | 219.5 |
Travel time to work (commute)
![Travel time to work (commute)]()
- 27Less than 5 minutes
- 825 to 9 minutes
- 35510 to 14 minutes
- 12215 to 19 minutes
- 24720 to 24 minutes
- 5625 to 29 minutes
- 14730 to 34 minutes
- 2135 to 39 minutes
- 3940 to 44 minutes
- 6145 to 59 minutes
- 1960 to 89 minutes
- 990 or more minutes

Means of transportation to work
![Means of transportation to work]()
- 46.0%423Drove a car alone
- 41.9%386Carpooled
- 35.6%328Bus
- 6.4%59Taxi
- 4.2%39Bicycle
- 12.5%115Walked
- 23.1%213Other means
- 5.0%46Worked at home

Time leaving home to go to work
![Time leaving home to go to work]()
- 2812:00 a.m. to 4:59 a.m.
- 735:00 a.m. to 5:29 a.m.
- 1005:30 a.m. to 5:59 a.m.
- 1476:00 a.m. to 6:29 a.m.
- 1276:30 a.m. to 6:59 a.m.
- 957:00 a.m. to 7:29 a.m.
- 617:30 a.m. to 7:59 a.m.
- 1918:00 a.m. to 8:29 a.m.
- 508:30 a.m. to 8:59 a.m.
- 659:00 a.m. to 9:59 a.m.
- 2010:00 a.m. to 10:59 a.m.
- 6811:00 a.m. to 11:59 a.m.
- 19112:00 p.m. to 3:59 p.m.
- 544:00 p.m. to 11:59 p.m.

Occupations of males:
- Percentage of males in computer and mathematical occupations:
Here: 4.6% city: 2.6%
- Percentage of males in architecture and engineering occupations:
Here: 2.3% city: 1.5%
- Percentage of males in education, training, and library occupations:
Here: 3.3% city: 1.6%
- Percentage of males in service occupations:
Here: 22.2% city: 19.6%
- Percentage of males in sales and office occupations:
Here: 9.7% city: 16.6%
- Percentage of males in construction, extraction, and maintenance occupations:
Here: 8.7% city: 8.3%
- Percentage of males in production occupations:
Here: 22.5% city: 14.8%
- Percentage of males in transportation occupations:
Here: 13.3% city: 10.8%
- Percentage of males in material moving occupations:
Here: 5.6% city: 8.8%
Occupations of females:
- Percentage of females in computer and mathematical occupations:
Here: 2.8% city: 1.8%
- Percentage of females in architecture and engineering occupations:
Here: 1.7% city: 0.8%
- Percentage of females in community and social services occupations:
Here: 2.2% city: 2.3%
- Percentage of females in service occupations:
Here: 34.5% city: 29.7%
- Percentage of females in sales and office occupations:
Here: 24.5% city: 22.4%
- Percentage of females in production occupations:
Here: 27.2% city: 12.3%
- Percentage of females in transportation occupations:
Here: 2.7% city: 3.7%
- Percentage of females in material moving occupations:
Here: 4.7% city: 7.6%
Education in this neighborhood (subdivision or community):
- Percentage of people 3 years and older in K-12 schools:
General Donovan: 26.6% Lawrence: 20.5%
- Percentage of people 3 years and older in undergraduate colleges:
General Donovan: 5.5% Lawrence: 5.0%
- Percentage of people 3 years and older in grad. or professional schools:
General Donovan: 2.3% Lawrence: 0.7%
- Percentage of students K-12 enrolled in private schools:
General Donovan: 13.5% Lawrence: 5.9%
Percentage of population below poverty level:
| General Donovan: | 31.7% |
| Lawrence: | 18.7% |
Median year renter moved in (as recorded in 2022):
| General Donovan: | 2015 |
| Lawrence: | 2018 |
Percentage of married-couple families with both working:
| General Donovan: | 76.8% |
| Lawrence: | 51.6% |

- 51.7%Utility gas
- 33.4%Electricity
- 6.5%Fuel oil, kerosene, etc.
- 3.7%No fuel used
- 3.6%Bottled, tank, or LP gas
- 1.0%Other fuel
Highways in this neighborhood:
Haverhill St (State Hwy 110)
Length: 0.51 miles
Directions: E-W, SW-NE
Address range: 218 to 358
Directions: E-W, SW-NE
Address range: 218 to 358
State Hwy 28 (Broadway)
Length: 0.06 miles
Direction: SE-NW
Address range: 268 to 307
Direction: SE-NW
Address range: 268 to 307
Roads and streets:
Franklin St
Length: 0.59 miles
Direction: SE-NW
Address range: 1 to 174
Direction: SE-NW
Address range: 1 to 174
Hampshire St
Length: 0.48 miles
Direction: SE-NW
Address range: 2 to 232
Direction: SE-NW
Address range: 2 to 232
Common St
Length: 0.46 miles
Direction: SW-NE
Address range: 250 to 573
Direction: SW-NE
Address range: 250 to 573
Essex St
Length: 0.45 miles
Direction: SW-NE
Address range: 300 to 572
Direction: SW-NE
Address range: 300 to 572
Lowell St
Length: 0.44 miles
Direction: SW-NE
Address range: 1 to 196
Direction: SW-NE
Address range: 1 to 196
Bradford St
Length: 0.36 miles
Directions: E-W, SW-NE
Address range: 1 to 76
Directions: E-W, SW-NE
Address range: 1 to 76
Amesbury St
Length: 0.34 miles
Directions: N-S, SE-NW
Address range: 1 to 133
Directions: N-S, SE-NW
Address range: 1 to 133
Canal St
Length: 0.34 miles
Directions: E-W, SW-NE
Address range: 358 to 451
Directions: E-W, SW-NE
Address range: 358 to 451
Lawrence St
Length: 0.29 miles
Directions: N-S, SW-NE
Address range: 11 to 50
Directions: N-S, SW-NE
Address range: 11 to 50
Methuen St
Length: 0.29 miles
Direction: SW-NE
Address range: 211 to 312
Direction: SW-NE
Address range: 211 to 312
Tremont St
Length: 0.24 miles
Direction: SW-NE
Address range: 1 to 91
Direction: SW-NE
Address range: 1 to 91
Lebanon St
Length: 0.17 miles
Direction: E-W
Address range: 281 to 299
Direction: E-W
Address range: 281 to 299
Cross St
Length: 0.16 miles
Direction: E-W
Address range: 1 to 51
Direction: E-W
Address range: 1 to 51
Concord St
Length: 0.12 miles
Direction: SW-NE
Address range: 1 to 44
Direction: SW-NE
Address range: 1 to 44
Green St
Length: 0.11 miles
Direction: SW-NE
Address range: 1 to 99
Direction: SW-NE
Address range: 1 to 99
N Canal St
Length: 0.07 miles
Direction: SE-NW
Address range: 400 to 499
Direction: SE-NW
Address range: 400 to 499
Meigs Ave
Length: 0.06 miles
Direction: SE-NW
Address range: 1 to 99
Direction: SE-NW
Address range: 1 to 99
White St
Length: 0.05 miles
Direction: N-S
Address range: 1 to 29
Direction: N-S
Address range: 1 to 29