Garland (Leland Manor) neighborhood in Palo Alto, California (CA), 94303 detailed profile
Settings
X


Business Search - 14 Million verified businesses
Area: 0.332 square miles
Population: 2,064
Population density:
| Garland (Leland Manor): | 6,222 people per square mile |
| Palo Alto: | 2,789 people per square mile |

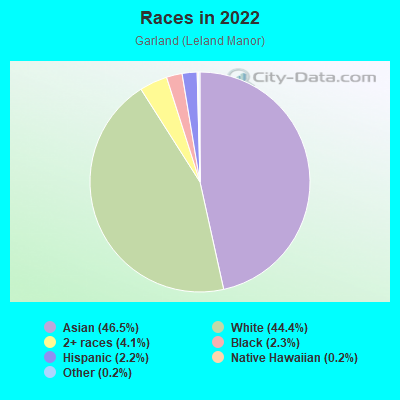
- 98346.5%Asian
- 94044.4%White
- 874.1%Two or more races
- 492.3%Black
- 472.2%Hispanic or Latino
- 50.2%Native Hawaiian and Other
Pacific Islander - 50.2%Some other race
Median household income in 2022:
| Garland (Leland Manor): | $217,062 |
| Palo Alto: | $179,707 |
Distribution of median household income
![Distribution of median household income]()
- 30Less than $10,000
- 11$10,000 to $19,999
- 47$20,000 to $29,999
- 32$30,000 to $39,999
- 28$40,000 to $49,999
- 13$50,000 to $59,999
- 34$60,000 to $74,999
- 72$75,000 to $99,999
- 34$100,000 to $124,999
- 27$125,000 to $149,999
- 58$150,000 to $199,999
- 496$200,000 or more

Distribution of owner-occupied house/condo value
![Distribution of owner-occupied house/condo value]()
- 11Less than $50,000
- 22$50,000 to $99,999
- 6$100,000 to $149,999
- 12$250,000 to $299,999
- 18$400,000 to $499,999
- 8$500,000 to $749,999
- 648$1,000,000 or more

Distribution of rent paid by renters
![Distribution of rent paid by renters]()
- 41Less than $100
- 10$800 to $899
- 8$1,000 to $1,249
- 11$1,500 to $1,999
- 418$2,000 or more

Median rent in 2022:
| Garland (Leland Manor): | $3,501 |
| Palo Alto: | $2,001 |
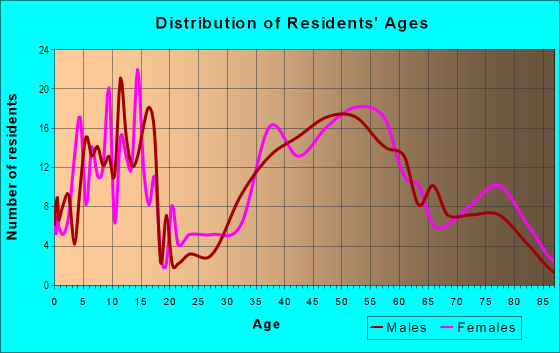
| Males: | 1,129 |
| Females: | 935 |
Males:
| This neighborhood: | 43.2 years |
| Whole city: | 47.1 years |
| This neighborhood: | 46.2 years |
| Whole city: | 48.1 years |
Average household size:
| Garland (Leland Manor): | 2.9 people |
| Palo Alto: | 2.3 people |
Percentage of family households:
| Garland (Leland Manor): | 52.2% |
| Palo Alto: | 42.2% |
| Here: | 76.2% |
| Palo Alto: | 52.1% |
Percentage of married-couple families with children (among all households):
| Garland (Leland Manor): | 27.4% |
| Palo Alto: | 37.5% |
Percentage of single-mother households (among all households):
| Garland (Leland Manor): | 6.0% |
| Palo Alto: | 3.5% |
Percentage of never married males 15 years old and over:
Percentage of never married females 15 years old and over:
| Garland (Leland Manor): | 15.6% |
| Palo Alto: | 17.4% |
Percentage of never married females 15 years old and over:
| Garland (Leland Manor): | 8.4% |
| city: | 11.8% |
Percentage of people that speak English not well or not at all:
| Garland (Leland Manor): | 1.7% |
| Palo Alto: | 3.7% |
Percentage of people born in this state:
Percentage of people born in another U.S. state:
Percentage of native residents but born outside the U.S.:
Percentage of foreign born residents:
| Here: | 39.8% |
| Palo Alto: | 36.4% |
Percentage of people born in another U.S. state:
| Garland (Leland Manor): | 28.1% |
| Palo Alto: | 28.3% |
Percentage of native residents but born outside the U.S.:
| Here: | 1.0% |
| city: | 3.7% |
Percentage of foreign born residents:
| Here: | 31.2% |
| Palo Alto: | 31.6% |
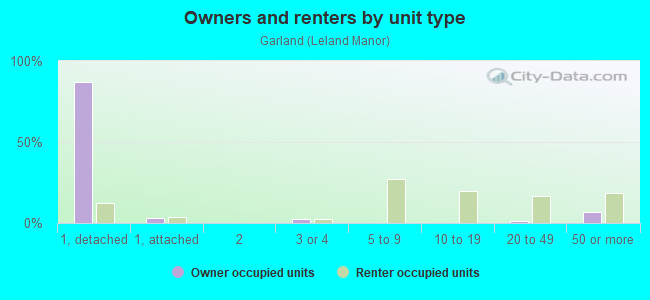
Owner-occupied
Renter-occupied

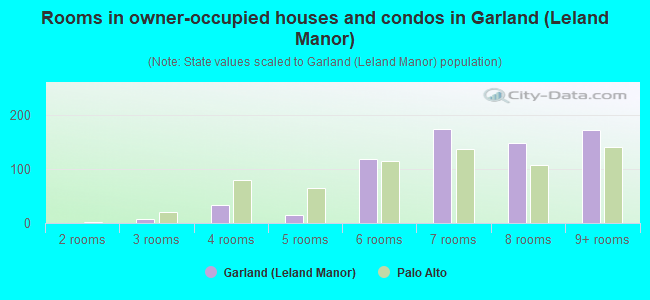
- Rooms in owner-occupied houses and condos in Garland <
> - 01 room
- 02 rooms
- 73 rooms
- 334 rooms
- 155 rooms
- 1196 rooms
- 1747 rooms
- 1488 rooms
- 1739+ rooms
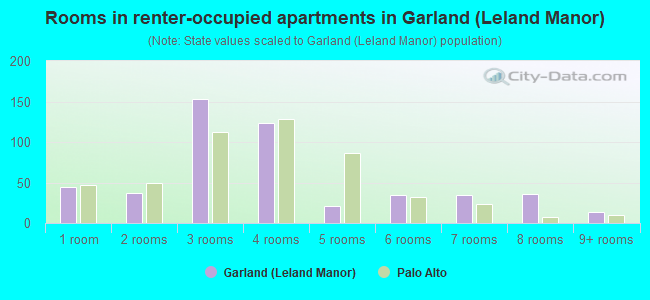
- Rooms in renter-occupied apartments in Garland <
> - 441 room
- 372 rooms
- 1533 rooms
- 1234 rooms
- 215 rooms
- 356 rooms
- 347 rooms
- 368 rooms
- 149+ rooms
Owner-occupied
Renter-occupied
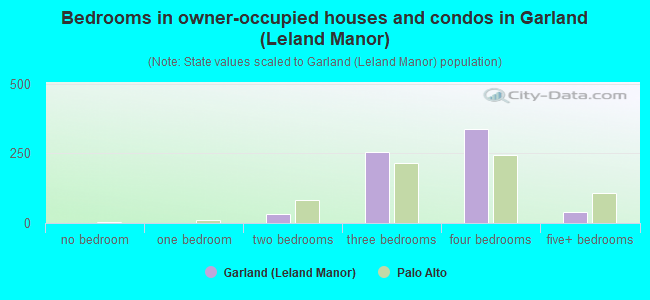
- Bedrooms in owner-occupied houses and condos in Garland <
> - 0no bedroom
- 01 bedroom
- 332 bedrooms
- 2533 bedrooms
- 3374 bedrooms
- 405+ bedrooms
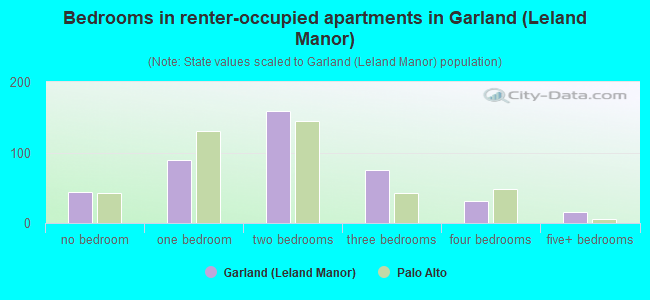
- Bedrooms in renter-occupied apartments in Garland <
> - 44no bedroom
- 891 bedroom
- 1592 bedrooms
- 753 bedrooms
- 314 bedrooms
- 155+ bedrooms
Average number of cars or other vehicles available in houses/condos:
Average number of cars or other vehicles available in apartments:
| This neighborhood: | 2.0 |
| Palo Alto: | 2.1 |
Average number of cars or other vehicles available in apartments:
| Here: | 2.3 |
| city: | 1.1 |
Percentage of units with a mortgage:
| Garland (Leland Manor): | 60.0% |
| Palo Alto: | 58.3% |
Average estimated value of detached houses in 2022 (99.9% of all units):
| Garland (Leland Manor): | $4,257,965 |
| California: | $988,808 |
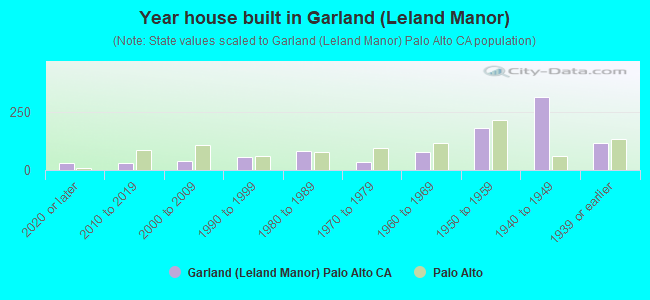
- Year house built in Garland <
> - 322020 or later
- 302010 to 2019
- 412000 to 2009
- 551990 to 1999
- 841980 to 1989
- 331970 to 1979
- 761960 to 1969
- 1801950 to 1959
- 3141940 to 1949
- 1151939 or earlier
City-data.com crime index for city in 2020 (higher means more crime):
| City: | 180.8 |
| U.S. average: | 219.5 |
Travel time to work (commute)
![Travel time to work (commute)]()
- 4Less than 5 minutes
- 485 to 9 minutes
- 13210 to 14 minutes
- 12515 to 19 minutes
- 16520 to 24 minutes
- 6525 to 29 minutes
- 5530 to 34 minutes
- 635 to 39 minutes
- 3040 to 44 minutes
- 3345 to 59 minutes
- 2460 to 89 minutes
- 1590 or more minutes

Means of transportation to work
![Means of transportation to work]()
- 57.8%459Drove a car alone
- 4.2%33Carpooled
- 0.6%5Bus
- 5.3%42Long-distance train or commuter rail
- 6.0%48Taxi
- 0.4%3Motorcycle
- 10.2%81Bicycle
- 4.8%38Walked
- 1.5%12Other means
- 31.5%250Worked at home

Time leaving home to go to work
![Time leaving home to go to work]()
- 612:00 a.m. to 4:59 a.m.
- 95:00 a.m. to 5:29 a.m.
- 35:30 a.m. to 5:59 a.m.
- 46:00 a.m. to 6:29 a.m.
- 286:30 a.m. to 6:59 a.m.
- 567:00 a.m. to 7:29 a.m.
- 847:30 a.m. to 7:59 a.m.
- 1528:00 a.m. to 8:29 a.m.
- 1528:30 a.m. to 8:59 a.m.
- 1349:00 a.m. to 9:59 a.m.
- 4810:00 a.m. to 10:59 a.m.
- 911:00 a.m. to 11:59 a.m.
- 1412:00 p.m. to 3:59 p.m.
- 84:00 p.m. to 11:59 p.m.

Occupations of males:
- Percentage of males in management occupations (except farmers):
Here: 34.1% city: 19.1%
- Percentage of males in business and financial operations occupations:
Here: 9.0% city: 7.0%
- Percentage of males in computer and mathematical occupations:
Here: 13.7% city: 22.2%
- Percentage of males in life, physical, and social science occupations:
Here: 8.7% city: 6.4%
- Percentage of males in legal occupations:
Here: 4.3% city: 2.5%
- Percentage of males in education, training, and library occupations:
Here: 6.7% city: 7.2%
- Percentage of males in healthcare practitioners and technical occupations:
Here: 15.0% city: 4.6%
- Percentage of males in service occupations:
Here: 3.3% city: 4.5%
- Percentage of males in sales and office occupations:
Here: 4.0% city: 5.7%
- Percentage of males in material moving occupations:
Here: 1.0% city: 1.3%
Occupations of females:
- Percentage of females in management occupations (except farmers):
Here: 23.9% city: 19.0%
- Percentage of females in business and financial operations occupations:
Here: 9.4% city: 8.3%
- Percentage of females in computer and mathematical occupations:
Here: 6.1% city: 8.6%
- Percentage of females in architecture and engineering occupations:
Here: 5.5% city: 4.0%
- Percentage of females in life, physical, and social science occupations:
Here: 8.9% city: 6.8%
- Percentage of females in education, training, and library occupations:
Here: 12.2% city: 12.9%
- Percentage of females in service occupations:
Here: 10.5% city: 8.4%
- Percentage of females in sales and office occupations:
Here: 23.3% city: 11.7%
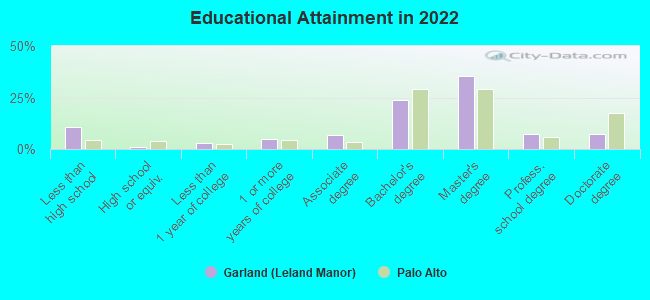
Education in this neighborhood (subdivision or community):
- Percentage of people 3 years and older in K-12 schools:
Garland (Leland Manor): 20.5% Palo Alto: 14.2%
- Percentage of people 3 years and older in undergraduate colleges:
Garland (Leland Manor): 2.6% Palo Alto: 2.4%
- Percentage of people 3 years and older in grad. or professional schools:
Garland (Leland Manor): 3.0% Palo Alto: 2.8%
- Percentage of students K-12 enrolled in private schools:
Garland (Leland Manor): 46.0% Palo Alto: 22.1%
Percentage of population below poverty level:
| Garland (Leland Manor): | 3.4% |
| Palo Alto: | 4.5% |
Median year owner moved in (as recorded in 2022):
Median year renter moved in (as recorded in 2022):
| Garland (Leland Manor): | 2002 |
| Palo Alto: | 2001 |
Median year renter moved in (as recorded in 2022):
| Garland (Leland Manor): | 2019 |
| Palo Alto: | 2019 |
Percentage of married-couple families with both working:
| Garland (Leland Manor): | 35.8% |
| Palo Alto: | 68.5% |
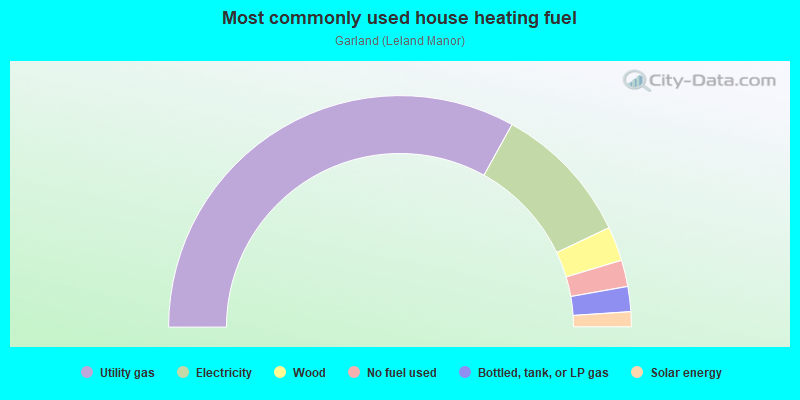
- 66.1%Utility gas
- 19.8%Electricity
- 4.8%Wood
- 3.7%No fuel used
- 3.5%Bottled, tank, or LP gas
- 2.1%Solar energy
Limited-access highways (interstate or state) in this neighborhood:
Oregon Expy
Length: 0.61 miles
Direction: SW-NE
Direction: SW-NE
Roads and streets:
N California Ave
Length: 0.72 miles
Direction: SW-NE
Address range: 700 to 999
Direction: SW-NE
Address range: 700 to 999
Garland Dr
Length: 0.56 miles
Directions: E-W, N-S, SE-NW, SW-NE
Address range: 711 to 899
Directions: E-W, N-S, SE-NW, SW-NE
Address range: 711 to 899
Louis Rd
Length: 0.51 miles
Direction: SE-NW
Address range: 1906 to 2399
Direction: SE-NW
Address range: 1906 to 2399
Newell Rd
Length: 0.44 miles
Direction: SE-NW
Address range: 1708 to 2199
Direction: SE-NW
Address range: 1708 to 2199
Oregon Ave
Length: 0.43 miles
Direction: SW-NE
Address range: 700 to 899
Direction: SW-NE
Address range: 700 to 899
Northampton Dr
Length: 0.41 miles
Directions: E-W, N-S, SE-NW, SW-NE
Address range: 700 to 899
Directions: E-W, N-S, SE-NW, SW-NE
Address range: 700 to 899
Seale Ave
Length: 0.40 miles
Directions: N-S, SW-NE
Address range: 731 to 899
Directions: N-S, SW-NE
Address range: 731 to 899
Southampton Dr
Length: 0.40 miles
Directions: E-W, N-S, SE-NW, SW-NE
Address range: 700 to 899
Directions: E-W, N-S, SE-NW, SW-NE
Address range: 700 to 899
Fulton St
Length: 0.26 miles
Direction: SE-NW
Address range: 1704 to 1899
Direction: SE-NW
Address range: 1704 to 1899
Barbara Dr
Length: 0.25 miles
Direction: SE-NW
Address range: 1900 to 2199
Direction: SE-NW
Address range: 1900 to 2199
Elsinore Dr
Length: 0.25 miles
Directions: N-S, SW-NE
Address range: 900 to 999
Directions: N-S, SW-NE
Address range: 900 to 999
el Cajon Way
Length: 0.24 miles
Directions: E-W, N-S, SE-NW, SW-NE
Address range: 900 to 999
Directions: E-W, N-S, SE-NW, SW-NE
Address range: 900 to 999
Guinda St
Length: 0.23 miles
Directions: E-W, SE-NW
Address range: 1700 to 1899
Directions: E-W, SE-NW
Address range: 1700 to 1899
Greer Rd
Length: 0.19 miles
Direction: SE-NW
Address range: 2200 to 2348
Direction: SE-NW
Address range: 2200 to 2348
Mark Twain St
Length: 0.14 miles
Direction: SE-NW
Address range: 1804 to 1899
Direction: SE-NW
Address range: 1804 to 1899
Ross Rd
Length: 0.11 miles
Directions: E-W, SE-NW
Address range: 2300 to 2399
Directions: E-W, SE-NW
Address range: 2300 to 2399
Blair Ct
Length: 0.11 miles
Directions: E-W, SE-NW, SW-NE
Address range: 900 to 999
Directions: E-W, SE-NW, SW-NE
Address range: 900 to 999
Bret Harte St
Length: 0.10 miles
Direction: SE-NW
Address range: 1806 to 1899
Direction: SE-NW
Address range: 1806 to 1899
Morton St
Length: 0.09 miles
Directions: SE-NW, SW-NE
Address range: 1 to 67
Directions: SE-NW, SW-NE
Address range: 1 to 67
E Greenwich Pl
Length: 0.07 miles
Direction: SW-NE
Address range: 800 to 899
Direction: SW-NE
Address range: 800 to 899
Middlefield Rd
Length: 0.06 miles
Direction: SE-NW
Address range: 2200 to 2307
Direction: SE-NW
Address range: 2200 to 2307
Bellview Dr
Length: 0.06 miles
Direction: SE-NW
Address range: 2100 to 2199
Direction: SE-NW
Address range: 2100 to 2199
W Greenwich Pl
Length: 0.04 miles
Direction: SW-NE
Address range: 700 to 799
Direction: SW-NE
Address range: 700 to 799
Elsinore Ct
Length: 0.03 miles
Direction: SE-NW
Address range: 900 to 999
Direction: SE-NW
Address range: 900 to 999
Tennyson Ave
Length: 0.03 miles
Direction: SW-NE
Address range: 749 to 799
Direction: SW-NE
Address range: 749 to 799