Garden Alameda neighborhood in San Jose, California (CA), 95126 detailed profile
Settings
X

Business Search - 14 Million verified businesses
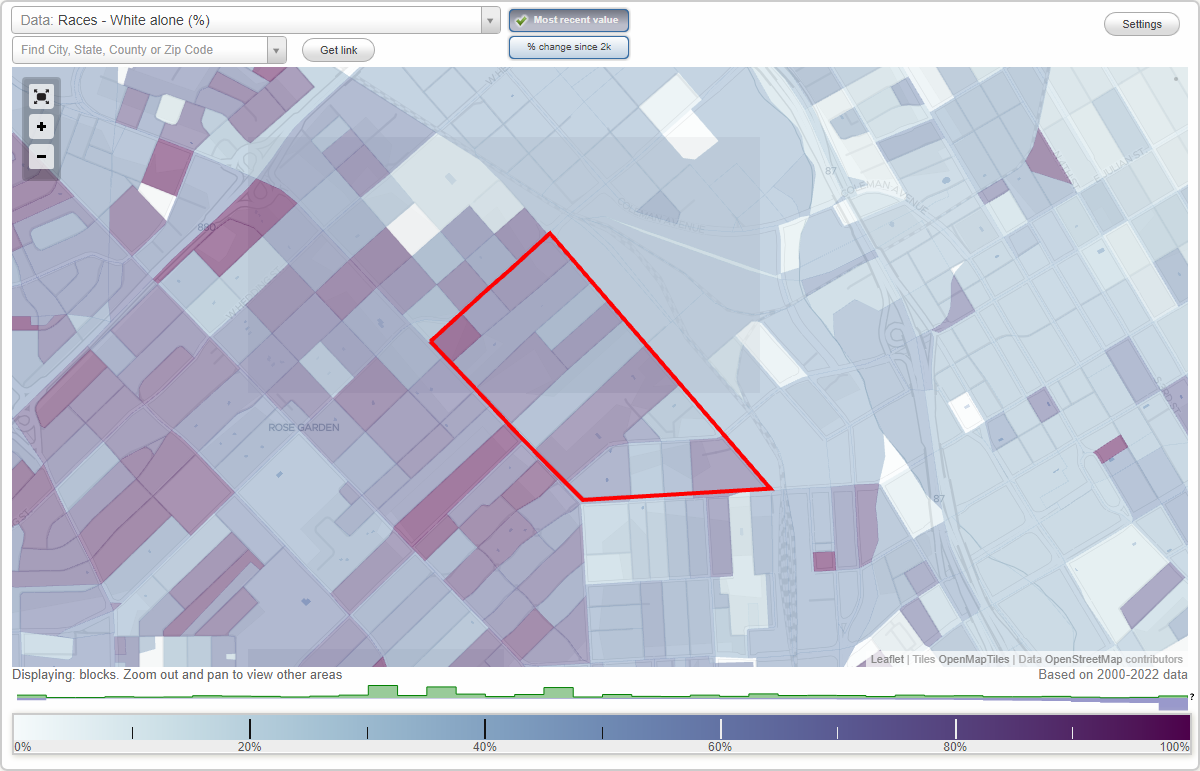
Area: 0.239 square miles
Population: 961
Population density:
| Garden Alameda: | 4,021 people per square mile |
| San Jose: | 5,554 people per square mile |

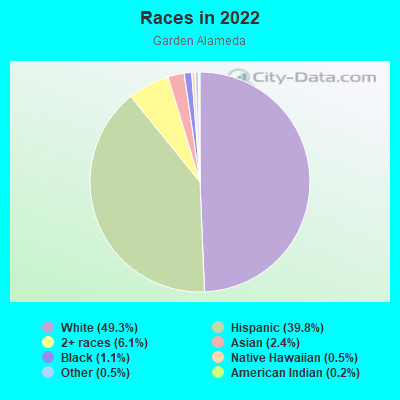
- 47749.3%White
- 38539.8%Hispanic or Latino
- 596.1%Two or more races
- 232.4%Asian
- 111.1%Black
- 50.5%Native Hawaiian and Other
Pacific Islander - 50.5%Some other race
- 20.2%American Indian
Median household income in 2022:
| Garden Alameda: | $196,989 |
| San Jose: | $133,835 |
Distribution of median household income
![Distribution of median household income]()
- 12Less than $10,000
- 55$10,000 to $19,999
- 10$20,000 to $29,999
- 15$30,000 to $39,999
- 18$40,000 to $49,999
- 11$50,000 to $59,999
- 9$60,000 to $74,999
- 28$75,000 to $99,999
- 11$100,000 to $124,999
- 31$125,000 to $149,999
- 52$150,000 to $199,999
- 202$200,000 or more

Distribution of owner-occupied house/condo value
![Distribution of owner-occupied house/condo value]()
- 16Less than $50,000
- 3$50,000 to $99,999
- 11$250,000 to $299,999
- 4$300,000 to $399,999
- 8$400,000 to $499,999
- 22$500,000 to $749,999
- 10$750,000 to $999,999
- 181$1,000,000 or more

Distribution of rent paid by renters
![Distribution of rent paid by renters]()
- 7Less than $100
- 3$200 to $299
- 64$300 to $399
- 3$400 to $499
- 20$500 to $599
- 3$600 to $699
- 18$700 to $799
- 18$800 to $899
- 3$900 to $999
- 12$1,000 to $1,249
- 9$1,250 to $1,499
- 15$1,500 to $1,999
- 107$2,000 or more

Median rent in 2022:
| Garden Alameda: | $2,424 |
| San Jose: | $2,001 |
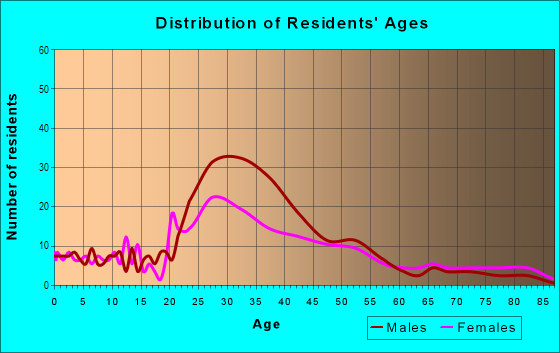
| Males: | 516 |
| Females: | 445 |
Males:
| This neighborhood: | 35.3 years |
| Whole city: | 37.6 years |
| This neighborhood: | 40.1 years |
| Whole city: | 39.1 years |
Average household size:
| Garden Alameda: | 3.9 people |
| San Jose: | 2.9 people |
Percentage of family households:
| Garden Alameda: | 55.4% |
| San Jose: | 49.9% |
| Here: | 69.4% |
| San Jose: | 53.0% |
Percentage of married-couple families with children (among all households):
| Garden Alameda: | 34.7% |
| San Jose: | 25.8% |
Percentage of single-mother households (among all households):
| Garden Alameda: | 4.0% |
| San Jose: | 5.2% |
Percentage of never married males 15 years old and over:
Percentage of never married females 15 years old and over:
| Garden Alameda: | 19.0% |
| San Jose: | 20.9% |
Percentage of never married females 15 years old and over:
| Garden Alameda: | 4.3% |
| city: | 16.7% |
Percentage of people that speak English not well or not at all:
| Garden Alameda: | 1.1% |
| San Jose: | 11.4% |
Percentage of people born in this state:
Percentage of people born in another U.S. state:
Percentage of native residents but born outside the U.S.:
Percentage of foreign born residents:
| Here: | 56.4% |
| San Jose: | 46.1% |
Percentage of people born in another U.S. state:
| Garden Alameda: | 15.9% |
| San Jose: | 10.4% |
Percentage of native residents but born outside the U.S.:
| Here: | 0.7% |
| city: | 1.7% |
Percentage of foreign born residents:
| Here: | 27.0% |
| San Jose: | 41.8% |
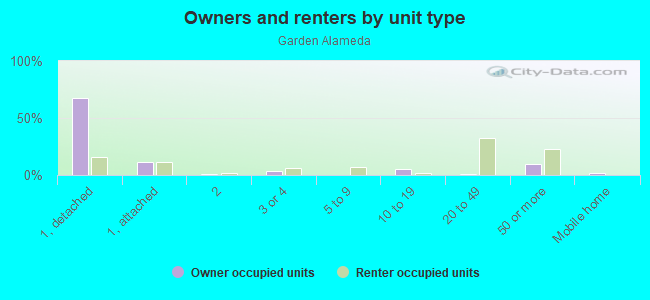
Owner-occupied
Renter-occupied

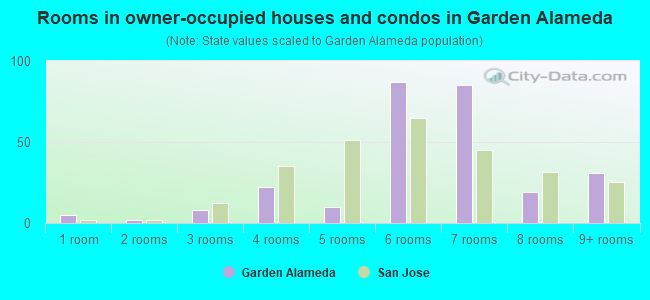
- Rooms in owner-occupied houses and condos in Garden Alameda
- 51 room
- 22 rooms
- 83 rooms
- 224 rooms
- 105 rooms
- 876 rooms
- 857 rooms
- 198 rooms
- 319+ rooms
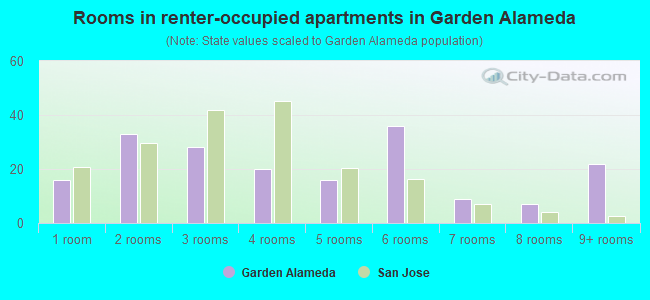
- Rooms in renter-occupied apartments in Garden Alameda
- 161 room
- 332 rooms
- 283 rooms
- 204 rooms
- 165 rooms
- 366 rooms
- 97 rooms
- 78 rooms
- 229+ rooms
Owner-occupied
Renter-occupied
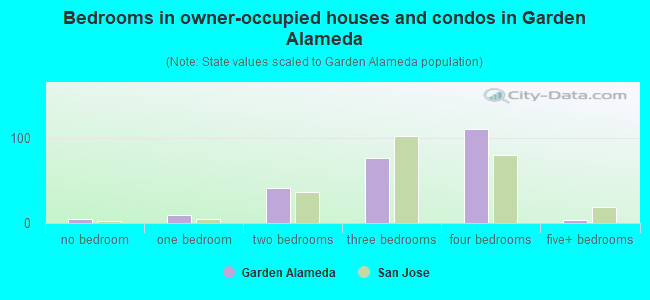
- Bedrooms in owner-occupied houses and condos in Garden Alameda
- 5no bedroom
- 91 bedroom
- 412 bedrooms
- 763 bedrooms
- 1104 bedrooms
- 35+ bedrooms
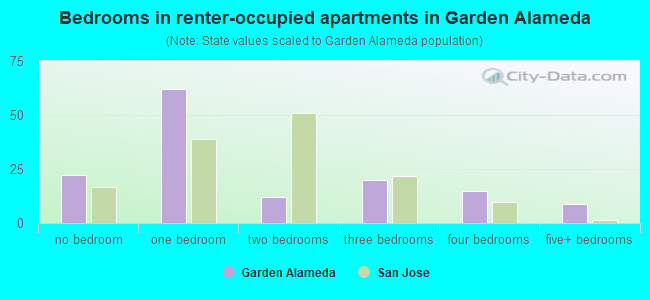
- Bedrooms in renter-occupied apartments in Garden Alameda
- 22no bedroom
- 621 bedroom
- 122 bedrooms
- 203 bedrooms
- 154 bedrooms
- 95+ bedrooms
Average number of cars or other vehicles available in houses/condos:
Average number of cars or other vehicles available in apartments:
| This neighborhood: | 2.0 |
| San Jose: | 2.3 |
Average number of cars or other vehicles available in apartments:
| Here: | 1.4 |
| city: | 1.6 |
Percentage of units with a mortgage:
| Garden Alameda: | 91.3% |
| San Jose: | 66.9% |
Average estimated value of detached houses in 2022 (84.4% of all units):
| Garden Alameda: | $1,236,868 |
| San Jose: | $1,532,815 |
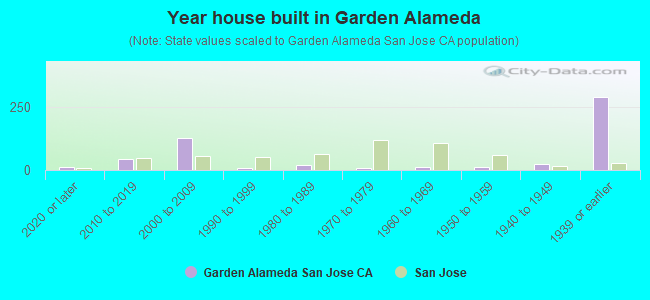
- Year house built in Garden Alameda
- 132020 or later
- 432010 to 2019
- 1282000 to 2009
- 91990 to 1999
- 201980 to 1989
- 71970 to 1979
- 131960 to 1969
- 111950 to 1959
- 231940 to 1949
- 2891939 or earlier
City-data.com crime index for city in 2020 (higher means more crime):
| City: | 268.4 |
| U.S. average: | 219.5 |
Travel time to work (commute)
![Travel time to work (commute)]()
- 3Less than 5 minutes
- 1705 to 9 minutes
- 12010 to 14 minutes
- 30915 to 19 minutes
- 17020 to 24 minutes
- 5625 to 29 minutes
- 21730 to 34 minutes
- 1035 to 39 minutes
- 5640 to 44 minutes
- 3045 to 59 minutes
- 8560 to 89 minutes
- 8890 or more minutes

Means of transportation to work
![Means of transportation to work]()
- 56.5%265Drove a car alone
- 3.4%16Carpooled
- 2.6%12Bus
- 0.4%2Subway or elevated rail
- 3.4%16Long-distance train or commuter rail
- 2.6%12Light rail, streetcar or trolley
- 0.2%1Motorcycle
- 0.4%2Bicycle
- 4.7%22Walked
- 3.2%15Other means
- 39.4%185Worked at home

Time leaving home to go to work
![Time leaving home to go to work]()
- 7612:00 a.m. to 4:59 a.m.
- 275:00 a.m. to 5:29 a.m.
- 35:30 a.m. to 5:59 a.m.
- 206:00 a.m. to 6:29 a.m.
- 1896:30 a.m. to 6:59 a.m.
- 1817:00 a.m. to 7:29 a.m.
- 1407:30 a.m. to 7:59 a.m.
- 1548:00 a.m. to 8:29 a.m.
- 2248:30 a.m. to 8:59 a.m.
- 1489:00 a.m. to 9:59 a.m.
- 1910:00 a.m. to 10:59 a.m.
- 4711:00 a.m. to 11:59 a.m.
- 2812:00 p.m. to 3:59 p.m.
- 424:00 p.m. to 11:59 p.m.

Occupations of males:
- Percentage of males in management occupations (except farmers):
Here: 55.2% city: 13.0%
- Percentage of males in computer and mathematical occupations:
Here: 9.4% city: 13.6%
- Percentage of males in architecture and engineering occupations:
Here: 4.0% city: 10.2%
- Percentage of males in community and social services occupations:
Here: 4.2% city: 0.8%
- Percentage of males in legal occupations:
Here: 1.9% city: 0.8%
- Percentage of males in healthcare practitioners and technical occupations:
Here: 4.2% city: 2.0%
- Percentage of males in service occupations:
Here: 4.0% city: 12.7%
- Percentage of males in sales and office occupations:
Here: 8.1% city: 12.8%
- Percentage of males in construction, extraction, and maintenance occupations:
Here: 8.8% city: 7.8%
Occupations of females:
- Percentage of females in management occupations (except farmers):
Here: 42.6% city: 11.0%
- Percentage of females in business and financial operations occupations:
Here: 12.3% city: 8.6%
- Percentage of females in architecture and engineering occupations:
Here: 1.5% city: 2.8%
- Percentage of females in life, physical, and social science occupations:
Here: 10.4% city: 1.7%
- Percentage of females in legal occupations:
Here: 6.5% city: 1.3%
- Percentage of females in education, training, and library occupations:
Here: 4.9% city: 8.1%
- Percentage of females in healthcare practitioners and technical occupations:
Here: 4.4% city: 6.8%
- Percentage of females in sales and office occupations:
Here: 17.5% city: 22.0%
- Percentage of females in farming, fishing, and forestry occupations:
Here: 6.0% city: 0.2%
- Percentage of females in production occupations:
Here: 7.8% city: 4.0%
- Percentage of females in transportation occupations:
Here: 15.4% city: 0.7%
Percentage of people 16-64 in Armed Forces:
| Garden Alameda: | 0.0% |
| San Jose: | 0.0% |
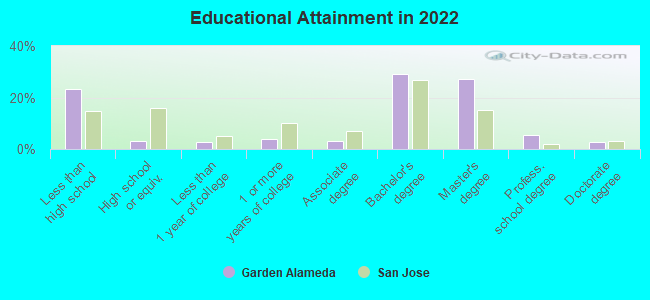
Education in this neighborhood (subdivision or community):
- Percentage of people 3 years and older in K-12 schools:
Garden Alameda: 36.7% San Jose: 16.1%
- Percentage of people 3 years and older in undergraduate colleges:
Garden Alameda: 2.3% San Jose: 6.5%
- Percentage of people 3 years and older in grad. or professional schools:
Garden Alameda: 1.3% San Jose: 2.0%
- Percentage of students K-12 enrolled in private schools:
Garden Alameda: 38.7% San Jose: 14.9%
Percentage of population below poverty level:
| Garden Alameda: | 14.3% |
| San Jose: | 9.0% |
Median year owner moved in (as recorded in 2022):
Median year renter moved in (as recorded in 2022):
| Garden Alameda: | 2007 |
| San Jose: | 2008 |
Median year renter moved in (as recorded in 2022):
| Garden Alameda: | 2018 |
| San Jose: | 2020 |
Percentage of married-couple families with both working:
| Garden Alameda: | 110.2% |
| San Jose: | 72.5% |
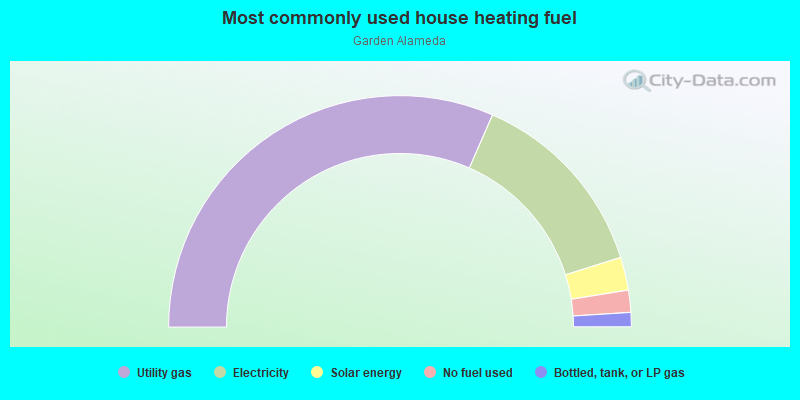
- 63.1%Utility gas
- 27.2%Electricity
- 4.6%Solar energy
- 3.1%No fuel used
- 2.0%Bottled, tank, or LP gas
Roads and streets:
Stockton Ave
Length: 0.66 miles
Direction: SE-NW
Address range: 250 to 653
Direction: SE-NW
Address range: 250 to 653
Villa Ave
Length: 0.32 miles
Direction: SW-NE
Address range: 700 to 999
Direction: SW-NE
Address range: 700 to 999
W Julian St
Length: 0.29 miles
Directions: E-W, N-S, SW-NE
Address range: 700 to 1030
Directions: E-W, N-S, SW-NE
Address range: 700 to 1030
Cinnabar St
Length: 0.23 miles
Directions: N-S, SE-NW, SW-NE
Address range: 700 to 999
Directions: N-S, SE-NW, SW-NE
Address range: 700 to 999
Schiele Ave
Length: 0.20 miles
Direction: SW-NE
Address range: 700 to 899
Direction: SW-NE
Address range: 700 to 899
Harding Ave
Length: 0.20 miles
Direction: SW-NE
Address range: 700 to 899
Direction: SW-NE
Address range: 700 to 899
Pershing Ave
Length: 0.20 miles
Direction: SW-NE
Address range: 700 to 899
Direction: SW-NE
Address range: 700 to 899
N Morrison Ave
Length: 0.14 miles
Directions: E-W, SE-NW
Address range: 300 to 499
Directions: E-W, SE-NW
Address range: 300 to 499
Hoover Ave
Length: 0.13 miles
Direction: SE-NW
Address range: 500 to 599
Direction: SE-NW
Address range: 500 to 599
Lenzen Ave
Length: 0.09 miles
Direction: SW-NE
Address range: 501 to 800
Direction: SW-NE
Address range: 501 to 800
Clinton Pl
Length: 0.07 miles
Direction: E-W
Address range: 700 to 799
Direction: E-W
Address range: 700 to 799
Lenzen Ct
Length: 0.06 miles
Directions: SE-NW, SW-NE
Address range: 400 to 499
Directions: SE-NW, SW-NE
Address range: 400 to 499