Frog Hollow neighborhood in Atlanta, Georgia (GA), 30344 detailed profile
Settings
X


Business Search - 14 Million verified businesses
Area: 0.181 square miles
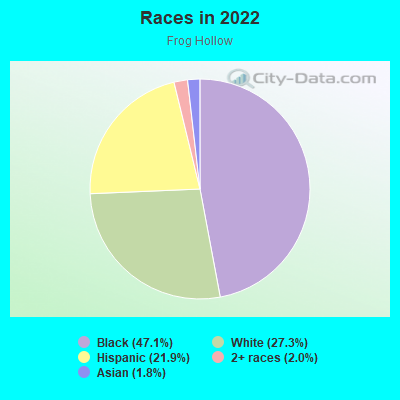
Population: 577
Population density:
| Frog Hollow: | 3,196 people per square mile |
| Atlanta: | 3,788 people per square mile |

- 31247.1%Black
- 18127.3%White
- 14521.9%Hispanic or Latino
- 132.0%Two or more races
- 121.8%Asian
Median household income in 2022:
| Frog Hollow: | $71,742 |
| Atlanta: | $83,251 |
Distribution of median household income
![Distribution of median household income]()
- 22Less than $10,000
- 40$10,000 to $19,999
- 39$20,000 to $29,999
- 29$30,000 to $39,999
- 16$40,000 to $49,999
- 17$50,000 to $59,999
- 78$60,000 to $74,999
- 41$75,000 to $99,999
- 22$100,000 to $124,999
- 20$125,000 to $149,999
- 22$150,000 to $199,999
- 4$200,000 or more

Distribution of owner-occupied house/condo value
![Distribution of owner-occupied house/condo value]()
- 33Less than $50,000
- 20$50,000 to $99,999
- 10$100,000 to $149,999
- 41$150,000 to $199,999
- 39$200,000 to $249,999
- 45$250,000 to $299,999
- 4$300,000 to $399,999
- 10$400,000 to $499,999

Distribution of rent paid by renters
![Distribution of rent paid by renters]()
- 2Less than $100
- 2$100 to $199
- 2$500 to $599
- 18$600 to $699
- 33$700 to $799
- 32$800 to $899
- 4$900 to $999
- 20$1,000 to $1,249
- 41$1,250 to $1,499
- 16$1,500 to $1,999

Median rent in 2022:
| Frog Hollow: | $848 |
| Atlanta: | $1,477 |
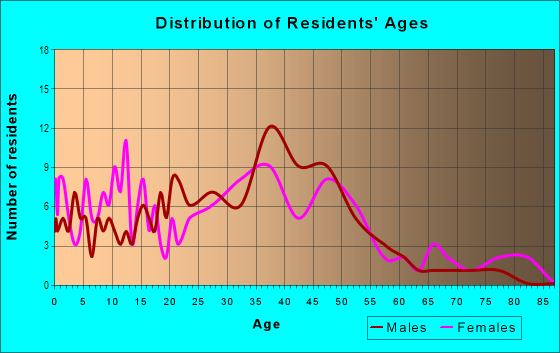
| Males: | 210 |
| Females: | 367 |
Males:
| This neighborhood: | 42.3 years |
| Whole city: | 33.7 years |
| This neighborhood: | 24.4 years |
| Whole city: | 34.3 years |
Average household size:
| Frog Hollow: | 2.5 people |
| Atlanta: | 2.0 people |
Percentage of family households:
| Frog Hollow: | 32.0% |
| Atlanta: | 31.6% |
| Here: | 17.9% |
| Atlanta: | 24.9% |
Percentage of married-couple families with children (among all households):
| Frog Hollow: | 14.7% |
| Atlanta: | 23.2% |
Percentage of single-mother households (among all households):
| Frog Hollow: | 7.0% |
| Atlanta: | 22.0% |
Percentage of never married males 15 years old and over:
Percentage of never married females 15 years old and over:
| Frog Hollow: | 16.7% |
| Atlanta: | 28.0% |
Percentage of never married females 15 years old and over:
| Frog Hollow: | 28.3% |
| city: | 26.3% |
Percentage of people that speak English not well or not at all:
| Frog Hollow: | 0.3% |
| Atlanta: | 1.0% |
Percentage of people born in this state:
Percentage of people born in another U.S. state:
Percentage of native residents but born outside the U.S.:
Percentage of foreign born residents:
| Here: | 57.7% |
| Atlanta: | 46.3% |
Percentage of people born in another U.S. state:
| Frog Hollow: | 32.2% |
| Atlanta: | 43.2% |
Percentage of native residents but born outside the U.S.:
| Here: | 2.4% |
| city: | 2.0% |
Percentage of foreign born residents:
| Here: | 7.7% |
| Atlanta: | 8.5% |
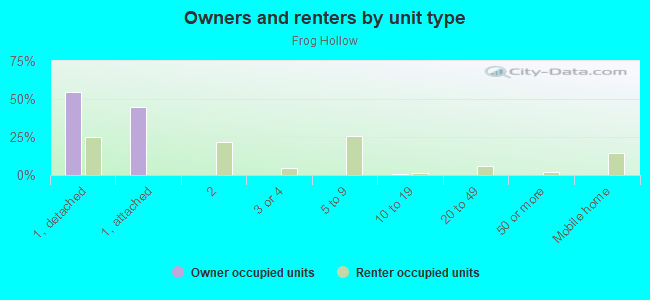
Owner-occupied
Renter-occupied

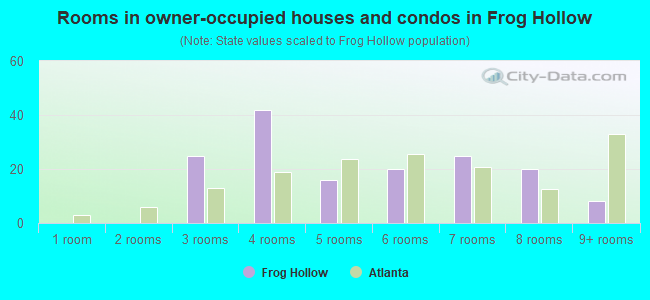
- Rooms in owner-occupied houses and condos in Frog Hollow
- 01 room
- 02 rooms
- 253 rooms
- 424 rooms
- 165 rooms
- 206 rooms
- 257 rooms
- 208 rooms
- 89+ rooms
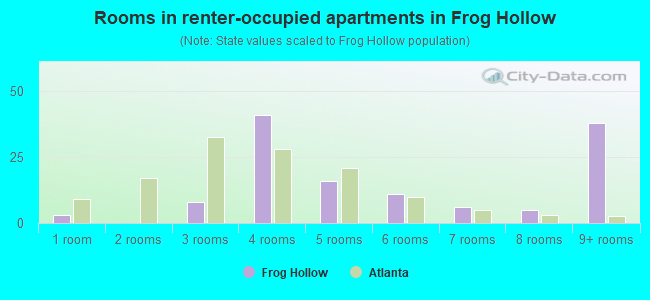
- Rooms in renter-occupied apartments in Frog Hollow
- 31 room
- 02 rooms
- 83 rooms
- 414 rooms
- 165 rooms
- 116 rooms
- 67 rooms
- 58 rooms
- 389+ rooms
Owner-occupied
Renter-occupied
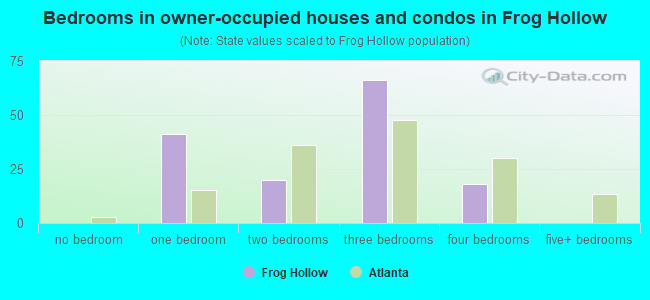
- Bedrooms in owner-occupied houses and condos in Frog Hollow
- 0no bedroom
- 411 bedroom
- 202 bedrooms
- 663 bedrooms
- 184 bedrooms
- 05+ bedrooms
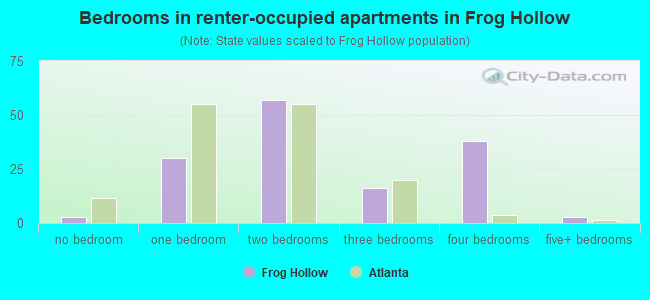
- Bedrooms in renter-occupied apartments in Frog Hollow
- 3no bedroom
- 301 bedroom
- 572 bedrooms
- 163 bedrooms
- 384 bedrooms
- 35+ bedrooms
Average number of cars or other vehicles available in houses/condos:
Average number of cars or other vehicles available in apartments:
| This neighborhood: | 1.4 |
| Atlanta: | 1.6 |
Average number of cars or other vehicles available in apartments:
| Here: | 1.0 |
| city: | 1.0 |
Percentage of units with a mortgage:
| Frog Hollow: | 68.2% |
| Atlanta: | 72.0% |
Average estimated value of detached houses in 2022 (60.7% of all units):
| Frog Hollow: | $250,991 |
| Atlanta: | $673,143 |
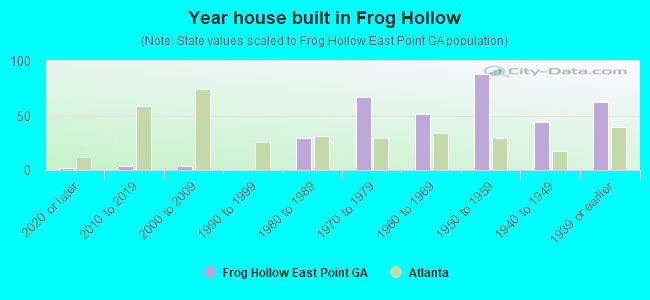
- Year house built in Frog Hollow
- 22020 or later
- 42010 to 2019
- 42000 to 2009
- 01990 to 1999
- 291980 to 1989
- 671970 to 1979
- 511960 to 1969
- 881950 to 1959
- 441940 to 1949
- 621939 or earlier
City-data.com crime index for city in 2020 (higher means more crime):
| City: | 140.2 |
| U.S. average: | 219.5 |
Travel time to work (commute)
![Travel time to work (commute)]()
- 12Less than 5 minutes
- 135 to 9 minutes
- 810 to 14 minutes
- 2015 to 19 minutes
- 3520 to 24 minutes
- 2325 to 29 minutes
- 3930 to 34 minutes
- 335 to 39 minutes
- 1240 to 44 minutes
- 2245 to 59 minutes
- 2160 to 89 minutes
- 490 or more minutes

Means of transportation to work
![Means of transportation to work]()
- 66.1%159Drove a car alone
- 7.5%18Carpooled
- 11.6%28Bus
- 12.5%30Subway or elevated rail
- 0.4%1Long-distance train or commuter rail
- 1.2%3Light rail, streetcar or trolley
- 1.7%4Taxi
- 1.7%4Motorcycle
- 6.7%16Walked
- 15.8%38Worked at home

Time leaving home to go to work
![Time leaving home to go to work]()
- 712:00 a.m. to 4:59 a.m.
- 35:00 a.m. to 5:29 a.m.
- 266:00 a.m. to 6:29 a.m.
- 366:30 a.m. to 6:59 a.m.
- 267:00 a.m. to 7:29 a.m.
- 97:30 a.m. to 7:59 a.m.
- 388:00 a.m. to 8:29 a.m.
- 158:30 a.m. to 8:59 a.m.
- 209:00 a.m. to 9:59 a.m.
- 1410:00 a.m. to 10:59 a.m.
- 311:00 a.m. to 11:59 a.m.
- 1112:00 p.m. to 3:59 p.m.
- 44:00 p.m. to 11:59 p.m.

Occupations of males:
- Percentage of males in management occupations (except farmers):
Here: 16.4% city: 16.5%
- Percentage of males in business and financial operations occupations:
Here: 1.7% city: 10.8%
- Percentage of males in computer and mathematical occupations:
Here: 7.1% city: 8.5%
- Percentage of males in architecture and engineering occupations:
Here: 2.8% city: 4.2%
- Percentage of males in community and social services occupations:
Here: 5.5% city: 0.8%
- Percentage of males in legal occupations:
Here: 3.9% city: 3.3%
- Percentage of males in education, training, and library occupations:
Here: 5.3% city: 5.1%
- Percentage of males in arts, design, entertainment, sports, and media occupations:
Here: 35.0% city: 4.8%
- Percentage of males in service occupations:
Here: 20.1% city: 11.5%
- Percentage of males in sales and office occupations:
Here: 7.7% city: 15.1%
- Percentage of males in construction, extraction, and maintenance occupations:
Here: 3.6% city: 2.4%
- Percentage of males in production occupations:
Here: 2.2% city: 1.9%
- Percentage of males in material moving occupations:
Here: 1.5% city: 4.3%
Occupations of females:
- Percentage of females in management occupations (except farmers):
Here: 46.5% city: 14.0%
- Percentage of females in business and financial operations occupations:
Here: 12.3% city: 10.8%
- Percentage of females in computer and mathematical occupations:
Here: 1.7% city: 3.2%
- Percentage of females in architecture and engineering occupations:
Here: 9.8% city: 1.4%
- Percentage of females in life, physical, and social science occupations:
Here: 5.5% city: 1.9%
- Percentage of females in community and social services occupations:
Here: 12.0% city: 2.5%
- Percentage of females in legal occupations:
Here: 17.2% city: 3.1%
- Percentage of females in education, training, and library occupations:
Here: 27.4% city: 8.9%
- Percentage of females in arts, design, entertainment, sports, and media occupations:
Here: 12.1% city: 4.9%
- Percentage of females in healthcare practitioners and technical occupations:
Here: 3.3% city: 7.6%
- Percentage of females in service occupations:
Here: 23.5% city: 13.9%
- Percentage of females in sales and office occupations:
Here: 14.6% city: 21.9%
- Percentage of females in production occupations:
Here: 7.0% city: 1.9%
- Percentage of females in material moving occupations:
Here: 2.5% city: 1.6%
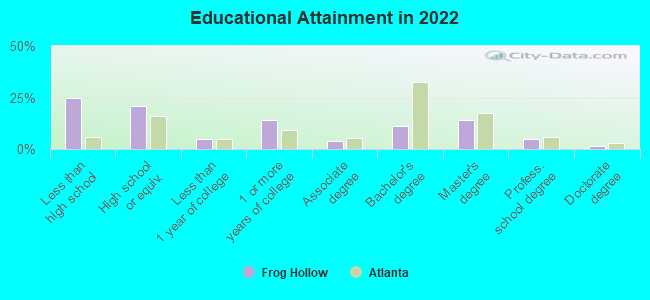
Education in this neighborhood (subdivision or community):
- Percentage of people 3 years and older in K-12 schools:
Frog Hollow: 40.5% Atlanta: 12.5%
- Percentage of people 3 years and older in undergraduate colleges:
Frog Hollow: 0.7% Atlanta: 8.9%
- Percentage of people 3 years and older in grad. or professional schools:
Frog Hollow: 5.9% Atlanta: 3.3%
- Percentage of students K-12 enrolled in private schools:
Frog Hollow: 0.4% Atlanta: 22.5%
Percentage of population below poverty level:
| Frog Hollow: | 20.5% |
| Atlanta: | 17.3% |
Median year owner moved in (as recorded in 2022):
Median year renter moved in (as recorded in 2022):
| Frog Hollow: | 2012 |
| Atlanta: | 2015 |
Median year renter moved in (as recorded in 2022):
| Frog Hollow: | 2016 |
| Atlanta: | 2020 |
Percentage of married-couple families with both working:
| Frog Hollow: | 80.1% |
| Atlanta: | 79.0% |
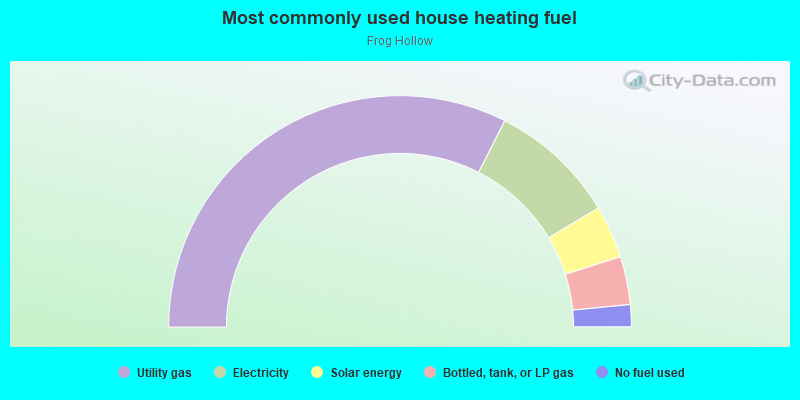
- 65.0%Utility gas
- 17.8%Electricity
- 7.4%Solar energy
- 6.7%Bottled, tank, or LP gas
- 3.1%No fuel used
Roads and streets:
Cheney St
Length: 0.70 miles
Directions: N-S, SW-NE
Address range: 2500 to 2911
Directions: N-S, SW-NE
Address range: 2500 to 2911
Church St
Length: 0.58 miles
Directions: N-S, SW-NE
Address range: 2644 to 2916
Directions: N-S, SW-NE
Address range: 2644 to 2916
Neely Ave
Length: 0.35 miles
Direction: SE-NW
Address range: 1600 to 1799
Direction: SE-NW
Address range: 1600 to 1799
W Ware Ave
Length: 0.33 miles
Direction: SE-NW
Address range: 1623 to 1771
Direction: SE-NW
Address range: 1623 to 1771
W Forrest Ave
Length: 0.33 miles
Directions: E-W, SE-NW
Address range: 1601 to 1745
Directions: E-W, SE-NW
Address range: 1601 to 1745
Thompson Ave
Length: 0.25 miles
Direction: E-W
Address range: 1684 to 1799
Direction: E-W
Address range: 1684 to 1799
Dorsey Ave
Length: 0.21 miles
Direction: E-W
Address range: 1700 to 1799
Direction: E-W
Address range: 1700 to 1799
Lester St
Length: 0.21 miles
Direction: SW-NE
Address range: 2554 to 2699
Direction: SW-NE
Address range: 2554 to 2699
Oak St
Length: 0.19 miles
Direction: SW-NE
Address range: 2560 to 2699
Direction: SW-NE
Address range: 2560 to 2699
Semmes St (Stanton St)
Length: 0.17 miles
Direction: N-S
Address range: 2650 to 2841
Direction: N-S
Address range: 2650 to 2841
E Washington Rd (Washington Ave)
Length: 0.13 miles
Direction: E-W
Address range: 1716 to 1774
Direction: E-W
Address range: 1716 to 1774
Linwood Ave
Length: 0.11 miles
Direction: E-W
Address range: 1686 to 1730
Direction: E-W
Address range: 1686 to 1730
W Cleveland Ave
Length: 0.11 miles
Direction: SE-NW
Address range: 1676 to 1799
Direction: SE-NW
Address range: 1676 to 1799
Norman Berry Dr (Norman Berry Ave)
Length: 0.01 miles
Direction: E-W
Direction: E-W