Friendly Homes neighborhood in Greensboro, North Carolina (NC), 27403 detailed profile
Settings
X


Business Search - 14 Million verified businesses
Area: 0.091 square miles
Population: 256
Population density:
| Friendly Homes: | 2,812 people per square mile |
| Greensboro: | 2,876 people per square mile |

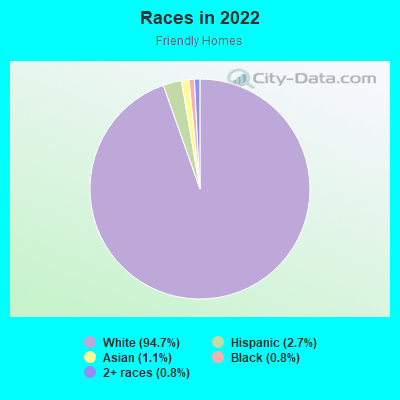
- 24894.7%White
- 72.7%Hispanic or Latino
- 31.1%Asian
- 20.8%Black
- 20.8%Two or more races
Median household income in 2022:
| Friendly Homes: | $84,644 |
| Greensboro: | $55,120 |
Distribution of median household income
![Distribution of median household income]()
- 2Less than $10,000
- 8$10,000 to $19,999
- 7$20,000 to $29,999
- 8$30,000 to $39,999
- 11$40,000 to $49,999
- 14$50,000 to $59,999
- 4$60,000 to $74,999
- 27$75,000 to $99,999
- 9$100,000 to $124,999
- 13$125,000 to $149,999
- 13$150,000 to $199,999
- 23$200,000 or more

Distribution of owner-occupied house/condo value
![Distribution of owner-occupied house/condo value]()
- 5$50,000 to $99,999
- 6$100,000 to $149,999
- 7$150,000 to $199,999
- 7$200,000 to $249,999
- 12$250,000 to $299,999
- 32$300,000 to $399,999
- 24$400,000 to $499,999
- 9$500,000 to $749,999
- 14$750,000 to $999,999
- 7$1,000,000 or more

Distribution of rent paid by renters
![Distribution of rent paid by renters]()
- 2$100 to $199
- 3$400 to $499
- 6$500 to $599
- 10$600 to $699
- 12$700 to $799
- 4$800 to $899
- 19$900 to $999
- 3$1,000 to $1,249
- 3$1,250 to $1,499
- 8$1,500 to $1,999

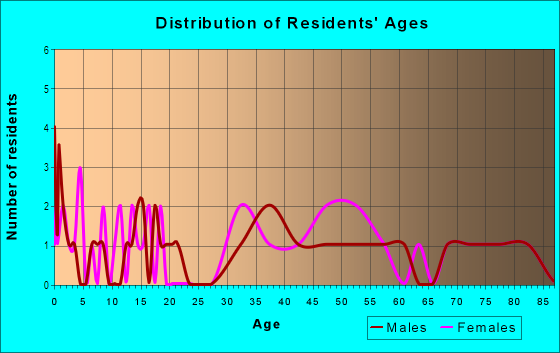
| Males: | 119 |
| Females: | 137 |
Males:
| This neighborhood: | 39.8 years |
| Whole city: | 32.4 years |
| This neighborhood: | 59.3 years |
| Whole city: | 35.3 years |
Average household size:
| Friendly Homes: | 2.1 people |
| Greensboro: | 2.3 people |
Percentage of family households:
| Friendly Homes: | 31.3% |
| Greensboro: | 43.6% |
| Here: | 42.3% |
| Greensboro: | 36.2% |
Percentage of married-couple families with children (among all households):
| Friendly Homes: | 33.6% |
| Greensboro: | 22.4% |
Percentage of single-mother households (among all households):
| Friendly Homes: | 7.3% |
| Greensboro: | 15.5% |
Percentage of never married males 15 years old and over:
Percentage of never married females 15 years old and over:
| Friendly Homes: | 16.7% |
| Greensboro: | 20.8% |
Percentage of never married females 15 years old and over:
| Friendly Homes: | 12.2% |
| city: | 23.9% |
Percentage of people that speak English not well or not at all:
| Friendly Homes: | 0.0% |
| Greensboro: | 2.7% |
Percentage of people born in this state:
Percentage of people born in another U.S. state:
Percentage of native residents but born outside the U.S.:
Percentage of foreign born residents:
| Here: | 48.3% |
| Greensboro: | 52.7% |
Percentage of people born in another U.S. state:
| Friendly Homes: | 43.3% |
| Greensboro: | 33.7% |
Percentage of native residents but born outside the U.S.:
| Here: | 3.4% |
| city: | 1.6% |
Percentage of foreign born residents:
| Here: | 5.0% |
| Greensboro: | 12.0% |
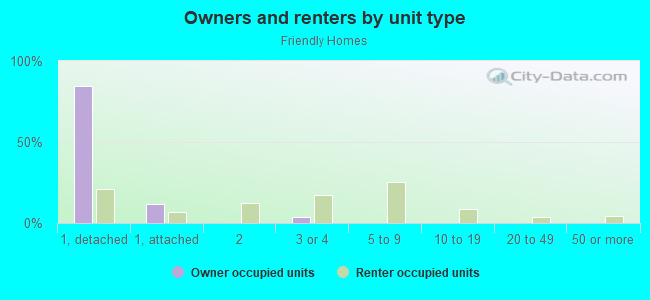
Owner-occupied
Renter-occupied

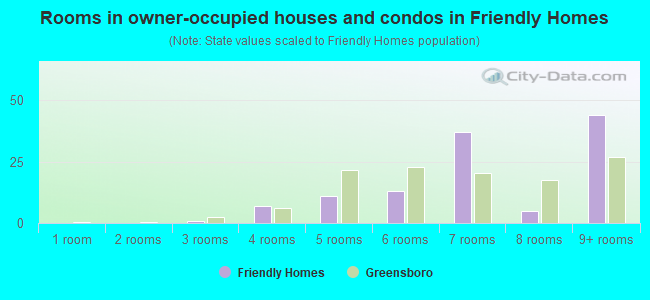
- Rooms in owner-occupied houses and condos in Friendly Homes
- 01 room
- 02 rooms
- 13 rooms
- 74 rooms
- 115 rooms
- 136 rooms
- 377 rooms
- 58 rooms
- 449+ rooms
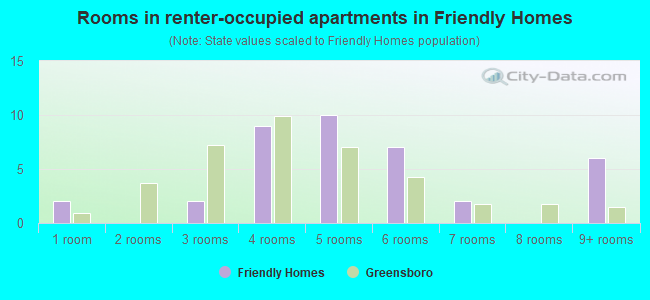
- Rooms in renter-occupied apartments in Friendly Homes
- 21 room
- 02 rooms
- 23 rooms
- 94 rooms
- 105 rooms
- 76 rooms
- 27 rooms
- 08 rooms
- 69+ rooms
Owner-occupied
Renter-occupied
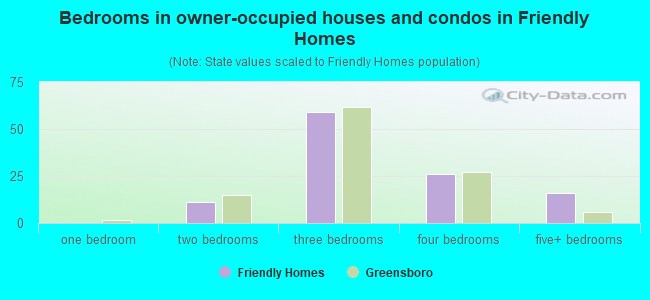
- Bedrooms in owner-occupied houses and condos in Friendly Homes
- 0no bedroom
- 01 bedroom
- 112 bedrooms
- 593 bedrooms
- 264 bedrooms
- 165+ bedrooms
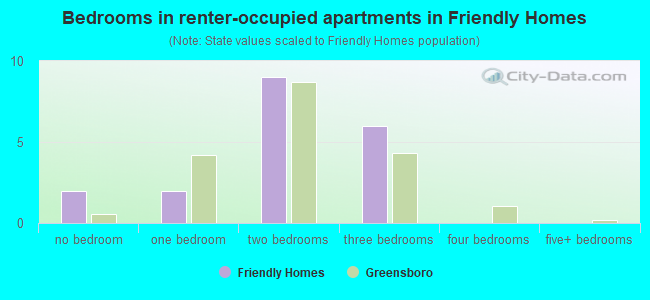
- Bedrooms in renter-occupied apartments in Friendly Homes
- 2no bedroom
- 21 bedroom
- 92 bedrooms
- 63 bedrooms
- 04 bedrooms
- 05+ bedrooms
Average number of cars or other vehicles available in houses/condos:
Average number of cars or other vehicles available in apartments:
| This neighborhood: | 0.7 |
| Greensboro: | 2.0 |
Average number of cars or other vehicles available in apartments:
| Here: | 6.0 |
| city: | 1.4 |
Percentage of units with a mortgage:
| Friendly Homes: | 67.6% |
| Greensboro: | 67.4% |
Housing prices:
- Average estimated value of detached houses in 2022 (88.2% of all units):
Friendly Homes: $490,603 Greensboro: $297,193
- Average estimated value of townhouses or other attached units in 2022 (10.9% of all units):
This neighborhood: $185,568 city: $222,694
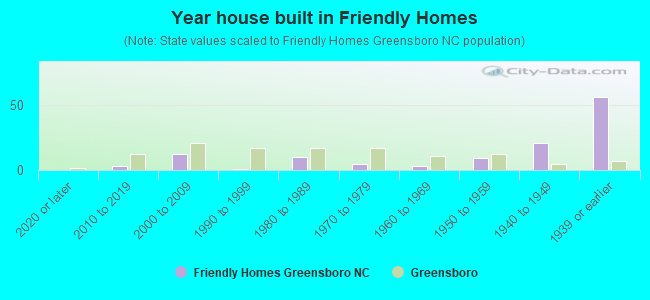
- Year house built in Friendly Homes
- 02020 or later
- 32010 to 2019
- 122000 to 2009
- 11990 to 1999
- 101980 to 1989
- 51970 to 1979
- 31960 to 1969
- 91950 to 1959
- 211940 to 1949
- 561939 or earlier
City-data.com crime index for city in 2020 (higher means more crime):
| City: | 435.6 |
| U.S. average: | 219.5 |
Travel time to work (commute)
![Travel time to work (commute)]()
- 9Less than 5 minutes
- 375 to 9 minutes
- 3310 to 14 minutes
- 1115 to 19 minutes
- 520 to 24 minutes
- 525 to 29 minutes
- 630 to 34 minutes
- 535 to 39 minutes
- 140 to 44 minutes
- 545 to 59 minutes
- 660 to 89 minutes
- 190 or more minutes

Means of transportation to work
![Means of transportation to work]()
- 43.9%42Drove a car alone
- 23.0%22Carpooled
- 5.2%5Bus
- 1.0%1Bicycle
- 3.1%3Walked
- 5.2%5Other means
- 21.9%21Worked at home

Time leaving home to go to work
![Time leaving home to go to work]()
- 65:30 a.m. to 5:59 a.m.
- 116:00 a.m. to 6:29 a.m.
- 16:30 a.m. to 6:59 a.m.
- 187:00 a.m. to 7:29 a.m.
- 197:30 a.m. to 7:59 a.m.
- 168:00 a.m. to 8:29 a.m.
- 188:30 a.m. to 8:59 a.m.
- 149:00 a.m. to 9:59 a.m.
- 110:00 a.m. to 10:59 a.m.
- 611:00 a.m. to 11:59 a.m.
- 1712:00 p.m. to 3:59 p.m.
- 14:00 p.m. to 11:59 p.m.

Occupations of males:
- Percentage of males in management occupations (except farmers):
Here: 36.0% city: 10.2%
- Percentage of males in business and financial operations occupations:
Here: 5.5% city: 4.8%
- Percentage of males in architecture and engineering occupations:
Here: 13.6% city: 3.1%
- Percentage of males in life, physical, and social science occupations:
Here: 6.2% city: 0.9%
- Percentage of males in community and social services occupations:
Here: 1.7% city: 1.4%
- Percentage of males in legal occupations:
Here: 16.3% city: 0.8%
- Percentage of males in education, training, and library occupations:
Here: 4.9% city: 4.0%
- Percentage of males in service occupations:
Here: 8.9% city: 14.3%
- Percentage of males in sales and office occupations:
Here: 8.3% city: 17.1%
- Percentage of males in production occupations:
Here: 2.8% city: 7.5%
- Percentage of males in transportation occupations:
Here: 3.4% city: 6.8%
Occupations of females:
- Percentage of females in management occupations (except farmers):
Here: 24.4% city: 7.8%
- Percentage of females in business and financial operations occupations:
Here: 6.0% city: 5.5%
- Percentage of females in life, physical, and social science occupations:
Here: 3.7% city: 1.0%
- Percentage of females in community and social services occupations:
Here: 2.2% city: 3.2%
- Percentage of females in legal occupations:
Here: 8.1% city: 0.7%
- Percentage of females in education, training, and library occupations:
Here: 25.2% city: 10.3%
- Percentage of females in healthcare practitioners and technical occupations:
Here: 13.6% city: 8.6%
- Percentage of females in sales and office occupations:
Here: 18.6% city: 29.0%
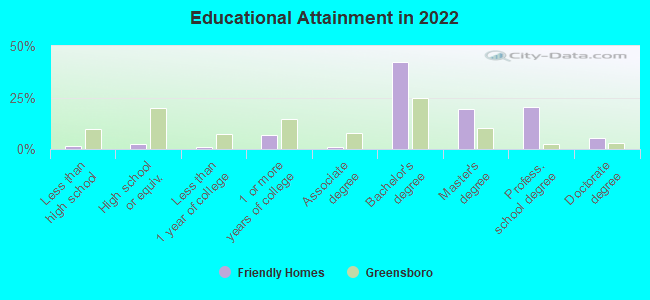
Education in this neighborhood (subdivision or community):
- Percentage of people 3 years and older in K-12 schools:
Friendly Homes: 23.8% Greensboro: 17.6%
- Percentage of people 3 years and older in undergraduate colleges:
Friendly Homes: 1.6% Greensboro: 11.2%
- Percentage of people 3 years and older in grad. or professional schools:
Friendly Homes: 2.7% Greensboro: 2.6%
- Percentage of students K-12 enrolled in private schools:
Friendly Homes: 4.9% Greensboro: 13.3%
Percentage of population below poverty level:
| Friendly Homes: | 10.6% |
| Greensboro: | 21.9% |
Median year owner moved in (as recorded in 2022):
| Friendly Homes: | 2006 |
| Greensboro: | 2010 |
Percentage of married-couple families with both working:
| Friendly Homes: | 47.3% |
| Greensboro: | 70.9% |
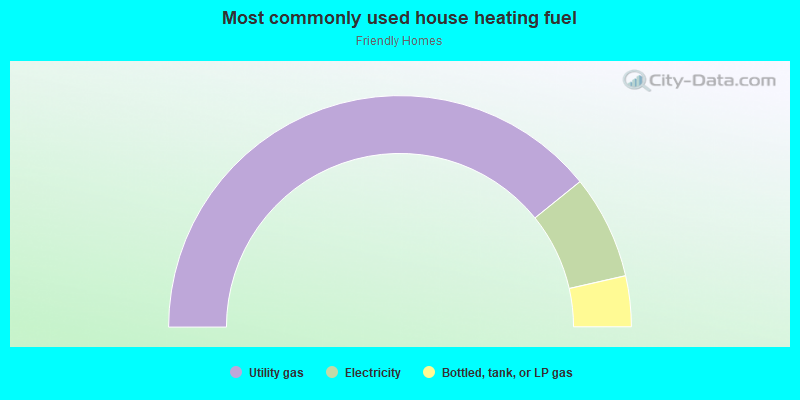
- 78.3%Utility gas
- 14.5%Electricity
- 7.1%Bottled, tank, or LP gas
Roads and streets:
W Greenway Dr N
Length: 0.34 miles
Directions: E-W, N-S, SW-NE
Address range: 500 to 799
Directions: E-W, N-S, SW-NE
Address range: 500 to 799
Mimosa Dr
Length: 0.30 miles
Directions: E-W, N-S, SE-NW
Address range: 1920 to 2299
Directions: E-W, N-S, SE-NW
Address range: 1920 to 2299
Candlewood Dr
Length: 0.25 miles
Directions: E-W, SW-NE
Address range: 600 to 699
Directions: E-W, SW-NE
Address range: 600 to 699
Whittier Dr
Length: 0.24 miles
Directions: N-S, SE-NW, SW-NE
Address range: 500 to 699
Directions: N-S, SE-NW, SW-NE
Address range: 500 to 699
Villa Dr
Length: 0.20 miles
Directions: E-W, N-S, SE-NW
Address range: 2100 to 2209
Directions: E-W, N-S, SE-NW
Address range: 2100 to 2209
Briarwood Dr
Length: 0.19 miles
Directions: E-W, SE-NW
Address range: 2100 to 2399
Directions: E-W, SE-NW
Address range: 2100 to 2399
Catalina Dr
Length: 0.18 miles
Directions: E-W, SW-NE
Address range: 600 to 699
Directions: E-W, SW-NE
Address range: 600 to 699
W Friendly Ave
Length: 0.18 miles
Directions: E-W, SE-NW
Address range: 1908 to 2199
Directions: E-W, SE-NW
Address range: 1908 to 2199
Shawnee Rd
Length: 0.15 miles
Direction: E-W
Address range: 600 to 699
Direction: E-W
Address range: 600 to 699