Foxboro Downs (Fox Downs) neighborhood in Hercules, California (CA), 94547 detailed profile
Settings
X


Business Search - 14 Million verified businesses
Area: 0.043 square miles
Population: 115
Population density:
| Foxboro Downs (Fox Downs): | 2,697 people per square mile |
| Hercules: | 4,020 people per square mile |

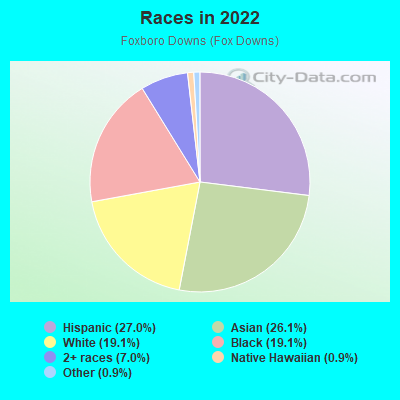
- 3127.0%Hispanic or Latino
- 3026.1%Asian
- 2219.1%White
- 2219.1%Black
- 87.0%Two or more races
- 10.9%Native Hawaiian and Other
Pacific Islander - 10.9%Some other race
Median household income in 2022:
| Foxboro Downs (Fox Downs): | $106,388 |
| Hercules: | $125,880 |
Distribution of median household income
![Distribution of median household income]()
- 5Less than $10,000
- 5$10,000 to $19,999
- 2$20,000 to $29,999
- 2$30,000 to $39,999
- 3$40,000 to $49,999
- 5$50,000 to $59,999
- 2$60,000 to $74,999
- 7$75,000 to $99,999
- 7$100,000 to $124,999
- 4$125,000 to $149,999
- 6$150,000 to $199,999
- 8$200,000 or more

Distribution of owner-occupied house/condo value
![Distribution of owner-occupied house/condo value]()
- 6Less than $50,000
- 3$50,000 to $99,999
- 2$100,000 to $149,999
- 3$300,000 to $399,999
- 9$400,000 to $499,999
- 17$500,000 to $749,999
- 2$750,000 to $999,999
- 3$1,000,000 or more

Distribution of rent paid by renters
![Distribution of rent paid by renters]()
- 2$700 to $799
- 1$1,000 to $1,249
- 1$1,250 to $1,499
- 2$1,500 to $1,999
- 45$2,000 or more

Median rent in 2022:
| Foxboro Downs (Fox Downs): | $2,605 |
| Hercules: | $2,001 |
| Males: | 57 |
| Females: | 58 |
Males:
| This neighborhood: | 43.9 years |
| Whole city: | 42.1 years |
| This neighborhood: | 45.6 years |
| Whole city: | 43.0 years |
Average household size:
| Foxboro Downs (Fox Downs): | 2.8 people |
| Hercules: | 2.9 people |
Percentage of family households:
| Foxboro Downs (Fox Downs): | 47.9% |
| Hercules: | 45.9% |
| Here: | 56.4% |
| Hercules: | 55.9% |
Percentage of married-couple families with children (among all households):
| Foxboro Downs (Fox Downs): | 39.7% |
| Hercules: | 28.8% |
Percentage of single-mother households (among all households):
| Foxboro Downs (Fox Downs): | 10.6% |
| Hercules: | 5.2% |
Percentage of never married males 15 years old and over:
Percentage of never married females 15 years old and over:
| Foxboro Downs (Fox Downs): | 12.6% |
| Hercules: | 14.8% |
Percentage of never married females 15 years old and over:
| Foxboro Downs (Fox Downs): | 16.3% |
| city: | 16.1% |
Percentage of people that speak English not well or not at all:
| Foxboro Downs (Fox Downs): | 3.5% |
| Hercules: | 4.2% |
Percentage of people born in this state:
Percentage of people born in another U.S. state:
Percentage of native residents but born outside the U.S.:
Percentage of foreign born residents:
| Here: | 54.9% |
| Hercules: | 53.9% |
Percentage of people born in another U.S. state:
| Foxboro Downs (Fox Downs): | 8.1% |
| Hercules: | 9.6% |
Percentage of native residents but born outside the U.S.:
| Here: | 6.3% |
| city: | 4.2% |
Percentage of foreign born residents:
| Here: | 30.8% |
| Hercules: | 32.3% |
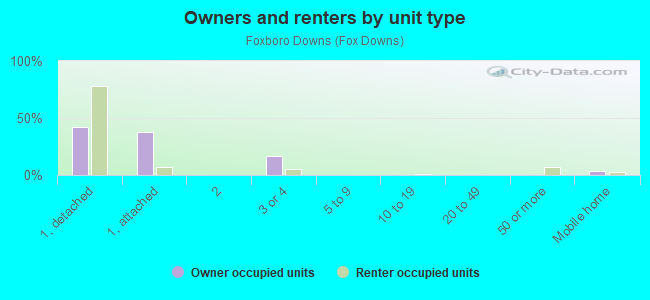
Owner-occupied
Renter-occupied

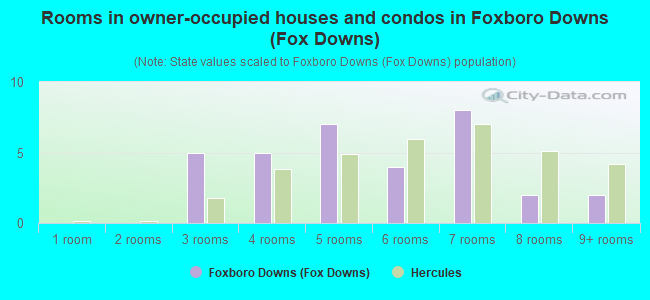
- Rooms in owner-occupied houses and condos in Foxboro Downs <
> - 01 room
- 02 rooms
- 53 rooms
- 54 rooms
- 75 rooms
- 46 rooms
- 87 rooms
- 28 rooms
- 29+ rooms
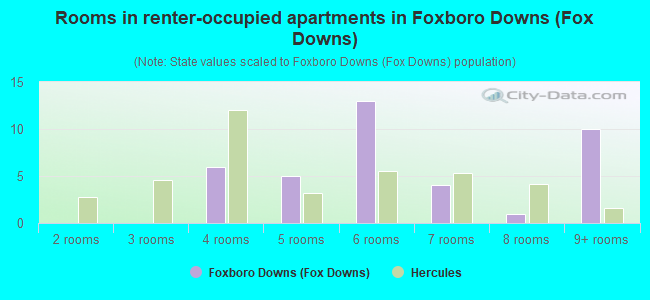
- Rooms in renter-occupied apartments in Foxboro Downs <
> - 01 room
- 02 rooms
- 03 rooms
- 64 rooms
- 55 rooms
- 136 rooms
- 47 rooms
- 18 rooms
- 109+ rooms
Owner-occupied
Renter-occupied
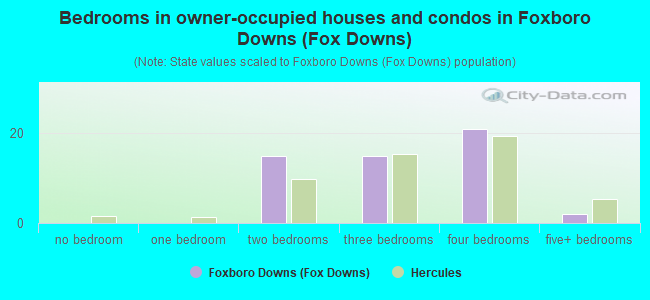
- Bedrooms in owner-occupied houses and condos in Foxboro Downs <
> - 0no bedroom
- 01 bedroom
- 152 bedrooms
- 153 bedrooms
- 214 bedrooms
- 25+ bedrooms
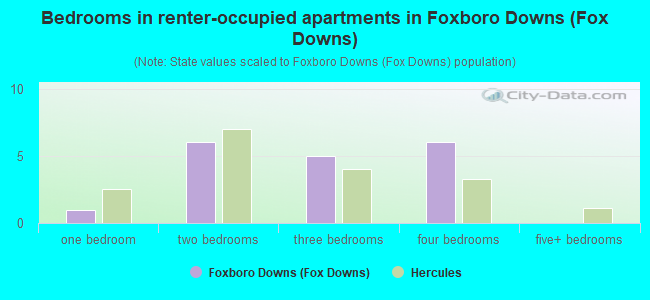
- Bedrooms in renter-occupied apartments in Foxboro Downs <
> - 0no bedroom
- 11 bedroom
- 62 bedrooms
- 53 bedrooms
- 64 bedrooms
- 05+ bedrooms
Average number of cars or other vehicles available in houses/condos:
Average number of cars or other vehicles available in apartments:
| This neighborhood: | 2.1 |
| Hercules: | 2.2 |
Average number of cars or other vehicles available in apartments:
| Here: | 2.0 |
| city: | 1.9 |
Percentage of units with a mortgage:
| Foxboro Downs (Fox Downs): | 71.8% |
| Hercules: | 80.1% |
Housing prices:
- Average estimated value of detached houses in 2022 (34.7% of all units):
Foxboro Downs (Fox Downs): $1,542,392 California: $988,808
- Average estimated value of townhouses or other attached units in 2022 (36.7% of all units):
This neighborhood: $285,336 California: $838,546
- Average estimated '22 value of housing units in 3-to-4-unit structures (16.3% of all units):
Foxboro Downs (Fox Downs): $143,115 California: $824,253
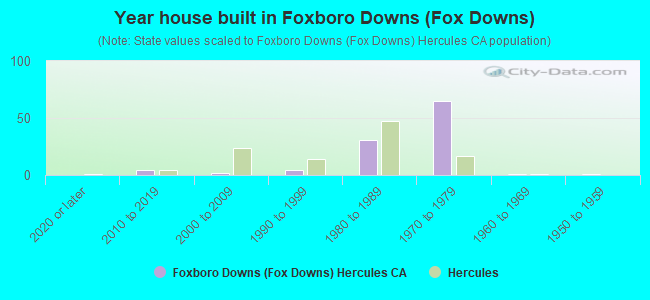
- Year house built in Foxboro Downs <
> - 02020 or later
- 42010 to 2019
- 22000 to 2009
- 41990 to 1999
- 311980 to 1989
- 651970 to 1979
- 11960 to 1969
- 11950 to 1959
- 01940 to 1949
- 01939 or earlier
City-data.com crime index for city in 2020 (higher means more crime):
| City: | 77.5 |
| U.S. average: | 219.5 |
Travel time to work (commute)
![Travel time to work (commute)]()
- 1Less than 5 minutes
- 45 to 9 minutes
- 210 to 14 minutes
- 315 to 19 minutes
- 1120 to 24 minutes
- 125 to 29 minutes
- 730 to 34 minutes
- 235 to 39 minutes
- 240 to 44 minutes
- 1245 to 59 minutes
- 1260 to 89 minutes
- 590 or more minutes

Means of transportation to work
![Means of transportation to work]()
- 69.4%37Drove a car alone
- 7.5%4Carpooled
- 3.8%2Bus
- 5.6%3Subway or elevated rail
- 3.8%2Other means
- 9.4%5Worked at home

Time leaving home to go to work
![Time leaving home to go to work]()
- 512:00 a.m. to 4:59 a.m.
- 25:00 a.m. to 5:29 a.m.
- 35:30 a.m. to 5:59 a.m.
- 86:00 a.m. to 6:29 a.m.
- 66:30 a.m. to 6:59 a.m.
- 57:00 a.m. to 7:29 a.m.
- 47:30 a.m. to 7:59 a.m.
- 88:00 a.m. to 8:29 a.m.
- 48:30 a.m. to 8:59 a.m.
- 29:00 a.m. to 9:59 a.m.
- 110:00 a.m. to 10:59 a.m.
- 712:00 p.m. to 3:59 p.m.
- 24:00 p.m. to 11:59 p.m.

Occupations of males:
- Percentage of males in management occupations (except farmers):
Here: 9.7% city: 11.6%
- Percentage of males in computer and mathematical occupations:
Here: 3.6% city: 9.5%
- Percentage of males in architecture and engineering occupations:
Here: 4.2% city: 3.1%
- Percentage of males in life, physical, and social science occupations:
Here: 2.0% city: 2.9%
- Percentage of males in education, training, and library occupations:
Here: 2.4% city: 2.6%
- Percentage of males in arts, design, entertainment, sports, and media occupations:
Here: 5.2% city: 3.1%
- Percentage of males in service occupations:
Here: 6.7% city: 8.8%
- Percentage of males in sales and office occupations:
Here: 20.1% city: 20.8%
- Percentage of males in construction, extraction, and maintenance occupations:
Here: 15.2% city: 5.4%
- Percentage of males in production occupations:
Here: 19.2% city: 5.0%
- Percentage of males in transportation occupations:
Here: 18.9% city: 7.1%
Occupations of females:
- Percentage of females in management occupations (except farmers):
Here: 5.5% city: 11.6%
- Percentage of females in business and financial operations occupations:
Here: 17.0% city: 8.6%
- Percentage of females in computer and mathematical occupations:
Here: 4.5% city: 2.2%
- Percentage of females in architecture and engineering occupations:
Here: 5.2% city: 1.7%
- Percentage of females in life, physical, and social science occupations:
Here: 2.6% city: 2.2%
- Percentage of females in community and social services occupations:
Here: 19.4% city: 4.7%
- Percentage of females in education, training, and library occupations:
Here: 6.1% city: 6.0%
- Percentage of females in arts, design, entertainment, sports, and media occupations:
Here: 1.8% city: 1.4%
- Percentage of females in healthcare practitioners and technical occupations:
Here: 22.6% city: 14.5%
- Percentage of females in service occupations:
Here: 11.3% city: 14.7%
- Percentage of females in sales and office occupations:
Here: 10.8% city: 29.1%
- Percentage of females in transportation occupations:
Here: 1.4% city: 0.3%
Percentage of people 16-64 in Armed Forces:
| Foxboro Downs (Fox Downs): | 0.3% |
| Hercules: | 0.1% |
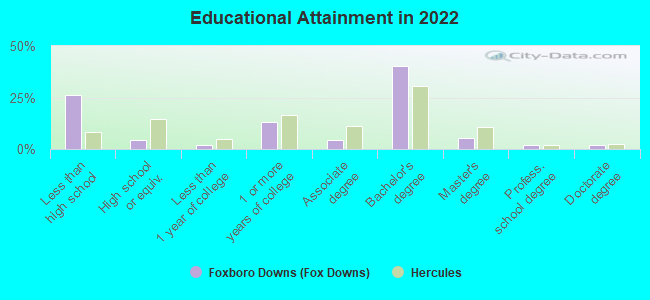
Education in this neighborhood (subdivision or community):
- Percentage of people 3 years and older in K-12 schools:
Foxboro Downs (Fox Downs): 14.0% Hercules: 15.4%
- Percentage of people 3 years and older in undergraduate colleges:
Foxboro Downs (Fox Downs): 11.4% Hercules: 6.7%
- Percentage of people 3 years and older in grad. or professional schools:
Foxboro Downs (Fox Downs): 3.5% Hercules: 1.4%
- Percentage of students K-12 enrolled in private schools:
Foxboro Downs (Fox Downs): 31.2% Hercules: 18.3%
Percentage of population below poverty level:
| Foxboro Downs (Fox Downs): | 3.1% |
| Hercules: | 4.7% |
Median year owner moved in (as recorded in 2022):
Median year renter moved in (as recorded in 2022):
| Foxboro Downs (Fox Downs): | 2003 |
| Hercules: | 2006 |
Median year renter moved in (as recorded in 2022):
| Foxboro Downs (Fox Downs): | 2014 |
| Hercules: | 2015 |
Percentage of married-couple families with both working:
| Foxboro Downs (Fox Downs): | 156.4% |
| Hercules: | 77.0% |
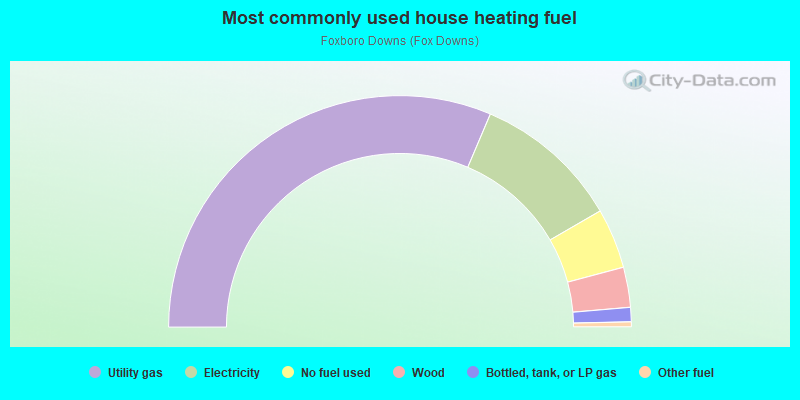
- 62.8%Utility gas
- 20.5%Electricity
- 8.4%No fuel used
- 5.6%Wood
- 2.0%Bottled, tank, or LP gas
- 0.7%Other fuel
Roads and streets:
Willow Ave
Length: 0.37 miles
Directions: E-W, SE-NW
Directions: E-W, SE-NW
Chelsea
Length: 0.26 miles
Directions: E-W, N-S, SE-NW, SW-NE
Address range: 1001 to 1399
Directions: E-W, N-S, SE-NW, SW-NE
Address range: 1001 to 1399
Bristol
Length: 0.24 miles
Directions: E-W, N-S, SE-NW, SW-NE
Address range: 101 to 599
Directions: E-W, N-S, SE-NW, SW-NE
Address range: 101 to 599
Dover
Length: 0.07 miles
Directions: E-W, N-S, SE-NW
Address range: 800 to 998
Directions: E-W, N-S, SE-NW
Address range: 800 to 998
Weymouth
Length: 0.06 miles
Direction: SW-NE
Address range: 300 to 416
Direction: SW-NE
Address range: 300 to 416
Canterbury
Length: 0.05 miles
Direction: SW-NE
Direction: SW-NE
Windsor
Length: 0.05 miles
Direction: SW-NE
Address range: 600 to 718
Direction: SW-NE
Address range: 600 to 718
Cambridge
Length: 0.04 miles
Direction: SW-NE
Direction: SW-NE
Viewpoint Blvd (Viewpointe Blvd)
Length: 0.01 miles
Directions: E-W, SW-NE
Address range: 700 to 703
Directions: E-W, SW-NE
Address range: 700 to 703