Fountain Greens neighborhood in Boulder, Colorado (CO), 80301 detailed profile
Settings
X


Business Search - 14 Million verified businesses
Area: 0.120 square miles
Population: 179
Population density:
| Fountain Greens: | 1,494 people per square mile |
| Boulder: | 4,328 people per square mile |

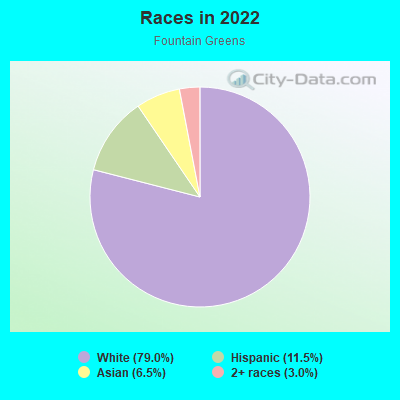
- 15879.0%White
- 2311.5%Hispanic or Latino
- 136.5%Asian
- 63.0%Two or more races
Distribution of median household income
![Distribution of median household income]()
- 7Less than $10,000
- 11$10,000 to $19,999
- 3$20,000 to $29,999
- 14$30,000 to $39,999
- 3$40,000 to $49,999
- 3$50,000 to $59,999
- 5$60,000 to $74,999
- 9$75,000 to $99,999
- 9$100,000 to $124,999
- 15$125,000 to $149,999
- 5$150,000 to $199,999
- 35$200,000 or more

Distribution of owner-occupied house/condo value
![Distribution of owner-occupied house/condo value]()
- 3$250,000 to $299,999
- 5$300,000 to $399,999
- 6$400,000 to $499,999
- 11$500,000 to $749,999
- 36$750,000 to $999,999
- 22$1,000,000 or more

Distribution of rent paid by renters
![Distribution of rent paid by renters]()
- 5$1,000 to $1,249
- 2$1,250 to $1,499
- 4$1,500 to $1,999
- 13$2,000 or more

Median rent in 2022:
| Fountain Greens: | $3,125 |
| Boulder: | $1,700 |
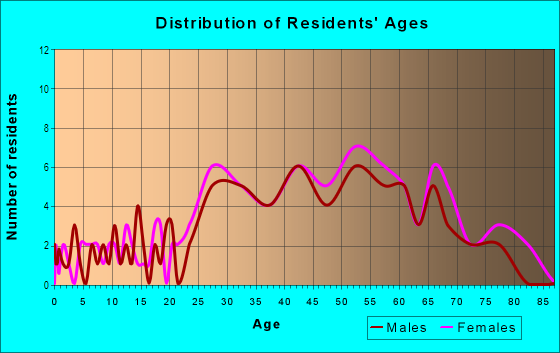
| Males: | 78 |
| Females: | 100 |
Males:
| This neighborhood: | 53.6 years |
| Whole city: | 28.3 years |
| This neighborhood: | 53.5 years |
| Whole city: | 29.2 years |
Average household size:
| Fountain Greens: | 2.1 people |
| Boulder: | 2.1 people |
Percentage of family households:
| Fountain Greens: | 37.7% |
| Boulder: | 26.9% |
| Here: | 65.2% |
| Boulder: | 30.4% |
Percentage of married-couple families with children (among all households):
| Fountain Greens: | 47.0% |
| Boulder: | 32.8% |
Percentage of single-mother households (among all households):
| Fountain Greens: | 5.6% |
| Boulder: | 6.3% |
Percentage of never married males 15 years old and over:
Percentage of never married females 15 years old and over:
| Fountain Greens: | 5.9% |
| Boulder: | 32.7% |
Percentage of never married females 15 years old and over:
| Fountain Greens: | 11.9% |
| city: | 28.3% |
Percentage of people that speak English not well or not at all:
| Fountain Greens: | 0.0% |
| Boulder: | 1.0% |
Percentage of people born in this state:
Percentage of people born in another U.S. state:
Percentage of native residents but born outside the U.S.:
Percentage of foreign born residents:
| Here: | 19.2% |
| Boulder: | 28.3% |
Percentage of people born in another U.S. state:
| Fountain Greens: | 70.2% |
| Boulder: | 60.5% |
Percentage of native residents but born outside the U.S.:
| Here: | 1.0% |
| city: | 2.1% |
Percentage of foreign born residents:
| Here: | 9.5% |
| Boulder: | 9.1% |
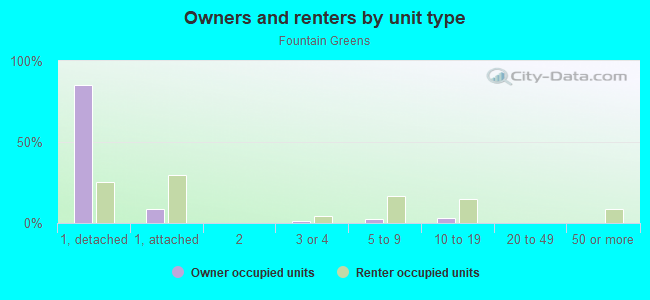
Owner-occupied
Renter-occupied

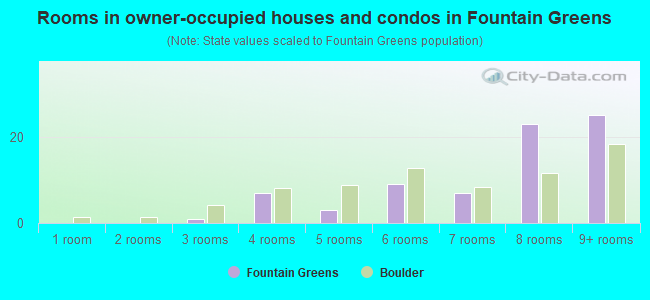
- Rooms in owner-occupied houses and condos in Fountain Greens
- 01 room
- 02 rooms
- 13 rooms
- 74 rooms
- 35 rooms
- 96 rooms
- 77 rooms
- 238 rooms
- 259+ rooms
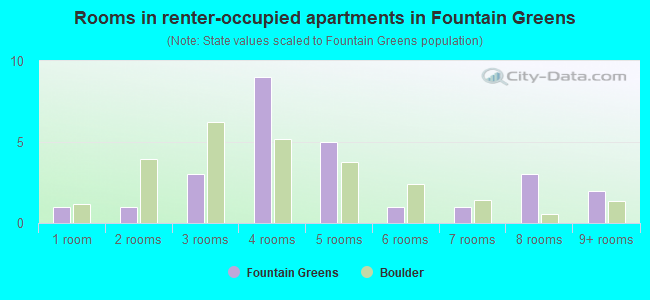
- Rooms in renter-occupied apartments in Fountain Greens
- 11 room
- 12 rooms
- 33 rooms
- 94 rooms
- 55 rooms
- 16 rooms
- 17 rooms
- 38 rooms
- 29+ rooms
Owner-occupied
Renter-occupied
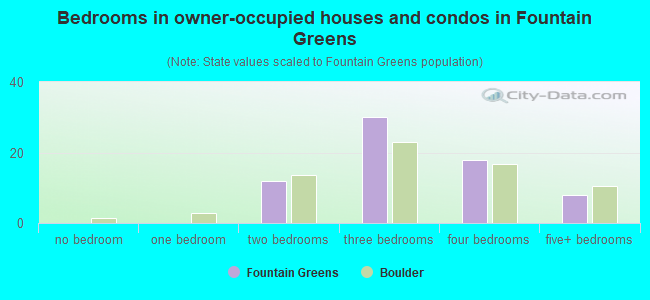
- Bedrooms in owner-occupied houses and condos in Fountain Greens
- 0no bedroom
- 01 bedroom
- 122 bedrooms
- 303 bedrooms
- 184 bedrooms
- 85+ bedrooms
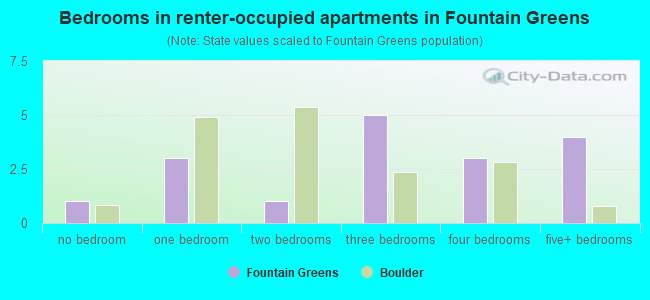
- Bedrooms in renter-occupied apartments in Fountain Greens
- 1no bedroom
- 31 bedroom
- 12 bedrooms
- 53 bedrooms
- 34 bedrooms
- 45+ bedrooms
Average number of cars or other vehicles available in houses/condos:
Average number of cars or other vehicles available in apartments:
| This neighborhood: | 2.1 |
| Boulder: | 1.8 |
Average number of cars or other vehicles available in apartments:
| Here: | 1.2 |
| city: | 1.6 |
Percentage of units with a mortgage:
| Fountain Greens: | 62.5% |
| Boulder: | 60.5% |
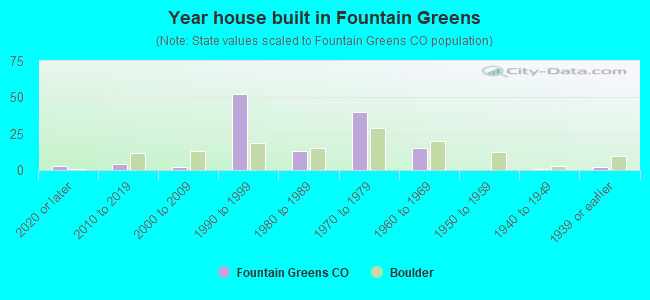
- Year house built in Fountain Greens
- 32020 or later
- 42010 to 2019
- 22000 to 2009
- 521990 to 1999
- 131980 to 1989
- 401970 to 1979
- 151960 to 1969
- 01950 to 1959
- 11940 to 1949
- 21939 or earlier
City-data.com crime index for city in 2020 (higher means more crime):
| City: | 275.1 |
| U.S. average: | 219.5 |
Travel time to work (commute)
![Travel time to work (commute)]()
- 105 to 9 minutes
- 2710 to 14 minutes
- 2915 to 19 minutes
- 1720 to 24 minutes
- 425 to 29 minutes
- 2130 to 34 minutes
- 345 to 59 minutes
- 1260 to 89 minutes
- 590 or more minutes

Means of transportation to work
![Means of transportation to work]()
- 55.1%41Drove a car alone
- 4.0%3Bus
- 1.3%1Taxi
- 2.7%2Bicycle
- 4.0%3Walked
- 39.0%29Worked at home

Time leaving home to go to work
![Time leaving home to go to work]()
- 55:00 a.m. to 5:29 a.m.
- 35:30 a.m. to 5:59 a.m.
- 76:00 a.m. to 6:29 a.m.
- 16:30 a.m. to 6:59 a.m.
- 117:00 a.m. to 7:29 a.m.
- 407:30 a.m. to 7:59 a.m.
- 158:00 a.m. to 8:29 a.m.
- 328:30 a.m. to 8:59 a.m.
- 79:00 a.m. to 9:59 a.m.
- 210:00 a.m. to 10:59 a.m.
- 211:00 a.m. to 11:59 a.m.
- 1312:00 p.m. to 3:59 p.m.
- 14:00 p.m. to 11:59 p.m.

Occupations of males:
- Percentage of males in management occupations (except farmers):
Here: 21.4% city: 12.9%
- Percentage of males in business and financial operations occupations:
Here: 15.2% city: 7.6%
- Percentage of males in computer and mathematical occupations:
Here: 48.6% city: 10.0%
- Percentage of males in architecture and engineering occupations:
Here: 52.8% city: 6.1%
- Percentage of males in life, physical, and social science occupations:
Here: 13.3% city: 6.1%
- Percentage of males in education, training, and library occupations:
Here: 1.5% city: 8.1%
- Percentage of males in arts, design, entertainment, sports, and media occupations:
Here: 13.9% city: 3.3%
- Percentage of males in service occupations:
Here: 18.0% city: 14.4%
- Percentage of males in sales and office occupations:
Here: 45.6% city: 14.5%
- Percentage of males in construction, extraction, and maintenance occupations:
Here: 3.7% city: 2.8%
- Percentage of males in production occupations:
Here: 5.3% city: 2.3%
- Percentage of males in material moving occupations:
Here: 6.3% city: 2.4%
Occupations of females:
- Percentage of females in management occupations (except farmers):
Here: 4.5% city: 8.8%
- Percentage of females in business and financial operations occupations:
Here: 28.5% city: 6.4%
- Percentage of females in computer and mathematical occupations:
Here: 9.3% city: 4.6%
- Percentage of females in architecture and engineering occupations:
Here: 4.1% city: 1.9%
- Percentage of females in life, physical, and social science occupations:
Here: 15.6% city: 4.7%
- Percentage of females in community and social services occupations:
Here: 3.6% city: 2.1%
- Percentage of females in legal occupations:
Here: 20.2% city: 1.4%
- Percentage of females in education, training, and library occupations:
Here: 15.0% city: 13.1%
- Percentage of females in arts, design, entertainment, sports, and media occupations:
Here: 4.3% city: 5.5%
- Percentage of females in healthcare practitioners and technical occupations:
Here: 8.6% city: 7.2%
- Percentage of females in service occupations:
Here: 23.5% city: 20.9%
- Percentage of females in sales and office occupations:
Here: 34.5% city: 19.4%
- Percentage of females in production occupations:
Here: 4.9% city: 0.6%
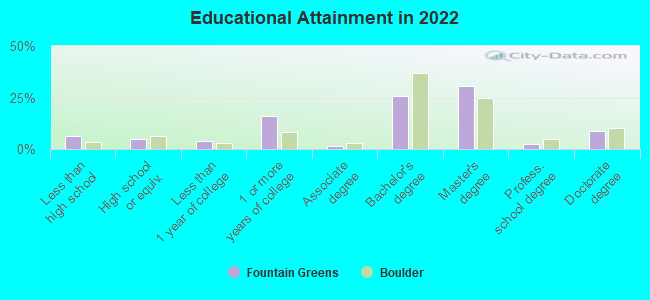
Education in this neighborhood (subdivision or community):
- Percentage of people 3 years and older in K-12 schools:
Fountain Greens: 23.2% Boulder: 8.8%
- Percentage of people 3 years and older in undergraduate colleges:
Fountain Greens: 2.8% Boulder: 28.2%
- Percentage of people 3 years and older in grad. or professional schools:
Fountain Greens: 2.8% Boulder: 6.1%
- Percentage of students K-12 enrolled in private schools:
Fountain Greens: 17.1% Boulder: 8.5%
Percentage of population below poverty level:
| Fountain Greens: | 4.6% |
| Boulder: | 24.1% |
Median year owner moved in (as recorded in 2022):
Median year renter moved in (as recorded in 2022):
| Fountain Greens: | 2005 |
| Boulder: | 2012 |
Median year renter moved in (as recorded in 2022):
| Fountain Greens: | 2020 |
| Boulder: | 2022 |
Percentage of married-couple families with both working:
| Fountain Greens: | 92.8% |
| Boulder: | 76.2% |
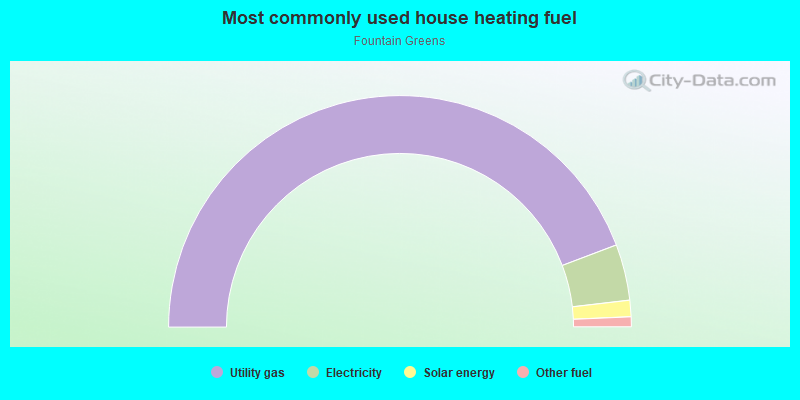
- 88.4%Utility gas
- 7.8%Electricity
- 2.3%Solar energy
- 1.4%Other fuel
Roads and streets:
Cedarwood Cir
Length: 0.43 miles
Directions: E-W, N-S, SE-NW, SW-NE
Address range: 7100 to 7207
Directions: E-W, N-S, SE-NW, SW-NE
Address range: 7100 to 7207
Buckingham Rd
Length: 0.41 miles
Directions: E-W, N-S, SE-NW
Address range: 7301 to 7349
Directions: E-W, N-S, SE-NW
Address range: 7301 to 7349
Singing Hills Dr
Length: 0.30 miles
Directions: E-W, N-S, SW-NE
Address range: 7400 to 7499
Directions: E-W, N-S, SW-NE
Address range: 7400 to 7499
Clubhouse Rd
Length: 0.29 miles
Directions: N-S, SE-NW, SW-NE
Address range: 5100 to 5182
Directions: N-S, SE-NW, SW-NE
Address range: 5100 to 5182
Coventry Ct
Length: 0.24 miles
Directions: E-W, N-S, SE-NW, SW-NE
Address range: 5000 to 5199
Directions: E-W, N-S, SE-NW, SW-NE
Address range: 5000 to 5199
Four Rivers Rd
Length: 0.23 miles
Directions: E-W, SE-NW
Address range: 7117 to 7299
Directions: E-W, SE-NW
Address range: 7117 to 7299
Buckingham Ct
Length: 0.21 miles
Directions: E-W, N-S, SE-NW, SW-NE
Address range: 7300 to 7399
Directions: E-W, N-S, SE-NW, SW-NE
Address range: 7300 to 7399
Windsor Dr
Length: 0.17 miles
Directions: E-W, N-S, SE-NW, SW-NE
Address range: 7300 to 7399
Directions: E-W, N-S, SE-NW, SW-NE
Address range: 7300 to 7399
Poston Way
Length: 0.16 miles
Directions: E-W, N-S, SE-NW
Address range: 7310 to 7368
Directions: E-W, N-S, SE-NW
Address range: 7310 to 7368
Singing Hills Ct
Length: 0.11 miles
Directions: E-W, SE-NW
Address range: 7400 to 7499
Directions: E-W, SE-NW
Address range: 7400 to 7499
Spy Glass Ct
Length: 0.08 miles
Directions: E-W, N-S
Address range: 7419 to 7489
Directions: E-W, N-S
Address range: 7419 to 7489
Siena Way
Length: 0.07 miles
Directions: E-W, SW-NE
Address range: 7200 to 7299
Directions: E-W, SW-NE
Address range: 7200 to 7299
Singing Hills Way
Length: 0.05 miles
Direction: SW-NE
Direction: SW-NE