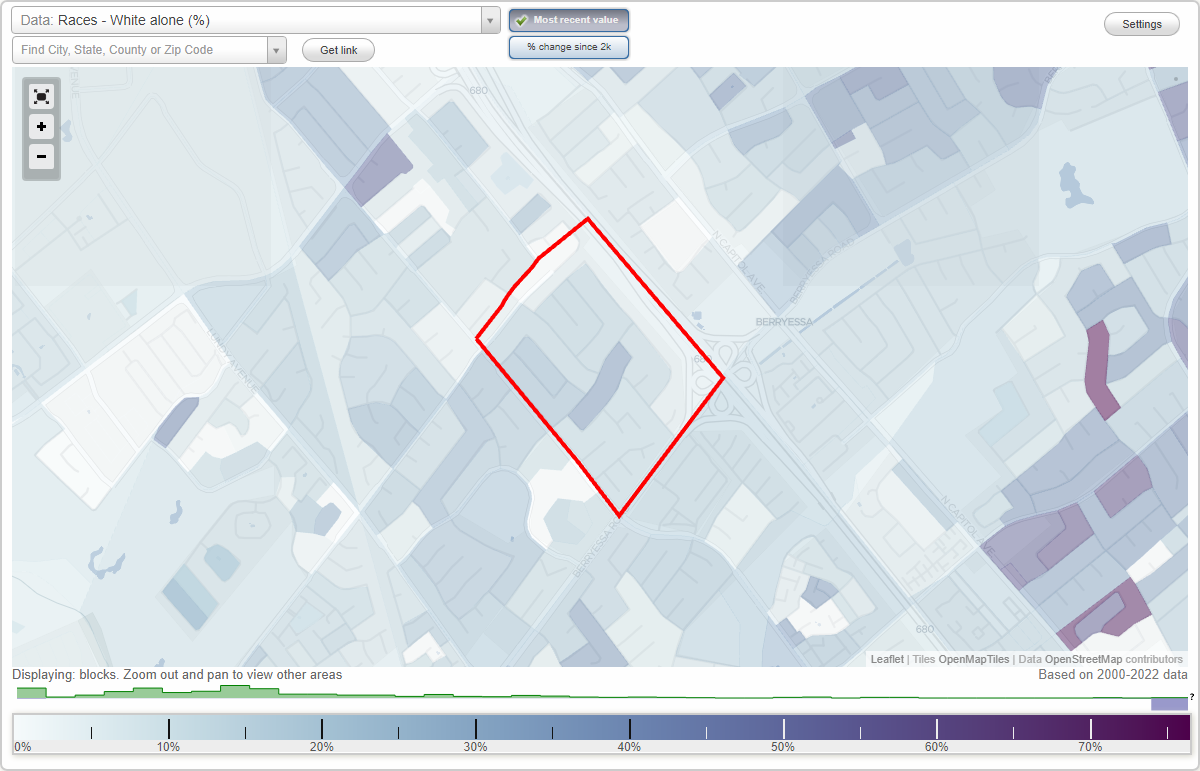
Flickinger South neighborhood in San Jose, California (CA), 95131 detailed profile
Settings
X

Business Search - 14 Million verified businesses
Area: 0.203 square miles
Population: 3,473
Population density:
| Flickinger South: | 17,073 people per square mile |
| San Jose: | 5,554 people per square mile |

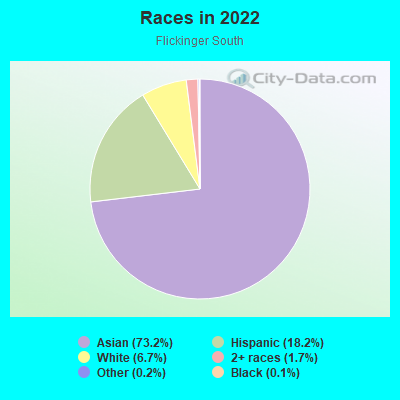
- 2,54673.2%Asian
- 63218.2%Hispanic or Latino
- 2326.7%White
- 591.7%Two or more races
- 60.2%Some other race
- 50.1%Black
Median household income in 2022:
| Flickinger South: | $166,798 |
| San Jose: | $133,835 |
Distribution of median household income
![Distribution of median household income]()
- 11Less than $10,000
- 21$10,000 to $19,999
- 67$20,000 to $29,999
- 22$30,000 to $39,999
- 21$40,000 to $49,999
- 25$50,000 to $59,999
- 45$60,000 to $74,999
- 104$75,000 to $99,999
- 42$100,000 to $124,999
- 86$125,000 to $149,999
- 165$150,000 to $199,999
- 410$200,000 or more

Distribution of owner-occupied house/condo value
![Distribution of owner-occupied house/condo value]()
- 41Less than $50,000
- 28$50,000 to $99,999
- 8$150,000 to $199,999
- 6$300,000 to $399,999
- 7$400,000 to $499,999
- 71$500,000 to $749,999
- 85$750,000 to $999,999
- 444$1,000,000 or more

Distribution of rent paid by renters
![Distribution of rent paid by renters]()
- 6$500 to $599
- 29$1,250 to $1,499
- 60$1,500 to $1,999
- 262$2,000 or more

Median rent in 2022:
| Flickinger South: | $2,854 |
| San Jose: | $2,001 |
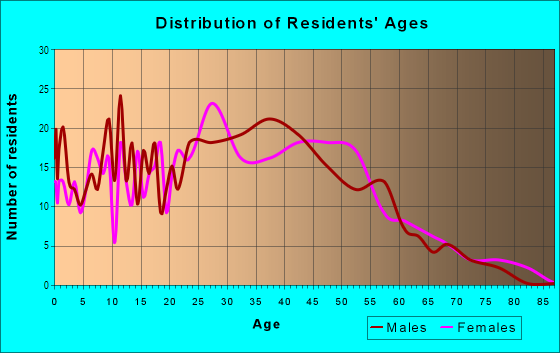
| Males: | 1,796 |
| Females: | 1,676 |
Males:
| This neighborhood: | 36.3 years |
| Whole city: | 37.6 years |
| This neighborhood: | 41.0 years |
| Whole city: | 39.1 years |
Average household size:
| Flickinger South: | 3.5 people |
| San Jose: | 2.9 people |
Percentage of family households:
| Flickinger South: | 62.4% |
| San Jose: | 49.9% |
| Here: | 77.8% |
| San Jose: | 53.0% |
Percentage of married-couple families with children (among all households):
| Flickinger South: | 27.0% |
| San Jose: | 25.8% |
Percentage of single-mother households (among all households):
| Flickinger South: | 1.8% |
| San Jose: | 5.2% |
Percentage of never married males 15 years old and over:
Percentage of never married females 15 years old and over:
| Flickinger South: | 21.3% |
| San Jose: | 20.9% |
Percentage of never married females 15 years old and over:
| Flickinger South: | 11.7% |
| city: | 16.7% |
Percentage of people that speak English not well or not at all:
| Flickinger South: | 18.4% |
| San Jose: | 11.4% |
Percentage of people born in this state:
Percentage of people born in another U.S. state:
Percentage of native residents but born outside the U.S.:
Percentage of foreign born residents:
| Here: | 36.6% |
| San Jose: | 46.1% |
Percentage of people born in another U.S. state:
| Flickinger South: | 5.3% |
| San Jose: | 10.4% |
Percentage of native residents but born outside the U.S.:
| Here: | 3.0% |
| city: | 1.7% |
Percentage of foreign born residents:
| Here: | 55.1% |
| San Jose: | 41.8% |
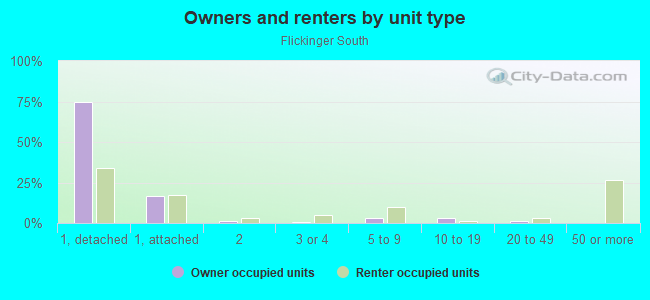
Owner-occupied
Renter-occupied

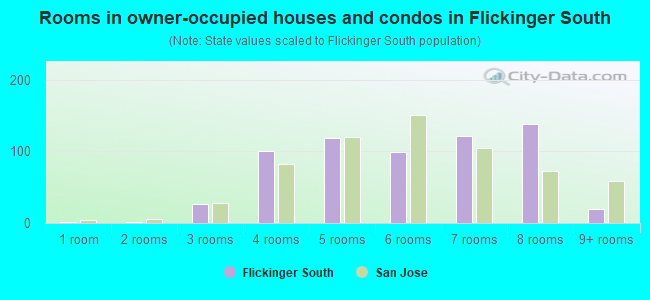
- Rooms in owner-occupied houses and condos in Flickinger South
- 21 room
- 22 rooms
- 263 rooms
- 1004 rooms
- 1195 rooms
- 996 rooms
- 1227 rooms
- 1398 rooms
- 209+ rooms
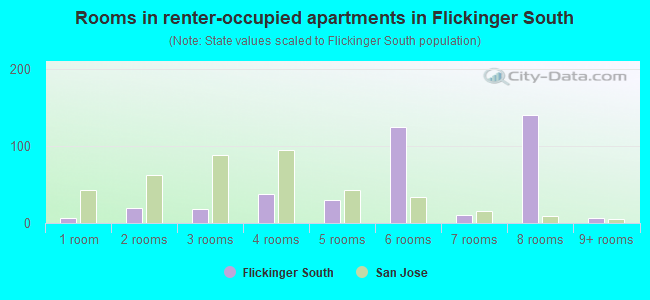
- Rooms in renter-occupied apartments in Flickinger South
- 61 room
- 202 rooms
- 183 rooms
- 374 rooms
- 305 rooms
- 1256 rooms
- 117 rooms
- 1408 rooms
- 79+ rooms
Owner-occupied
Renter-occupied
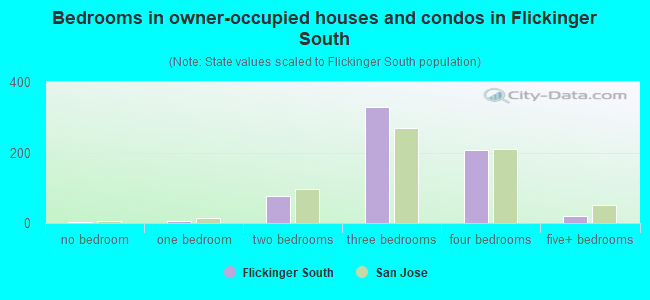
- Bedrooms in owner-occupied houses and condos in Flickinger South
- 2no bedroom
- 61 bedroom
- 782 bedrooms
- 3303 bedrooms
- 2084 bedrooms
- 215+ bedrooms
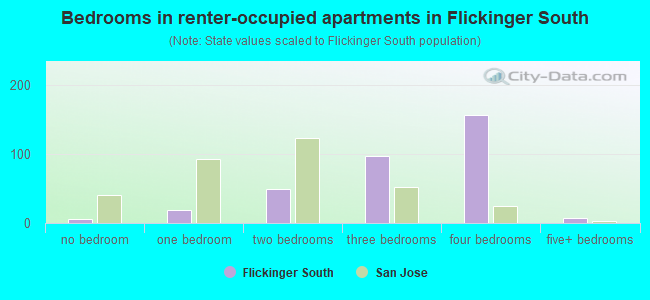
- Bedrooms in renter-occupied apartments in Flickinger South
- 6no bedroom
- 191 bedroom
- 492 bedrooms
- 983 bedrooms
- 1574 bedrooms
- 75+ bedrooms
Average number of cars or other vehicles available in houses/condos:
Average number of cars or other vehicles available in apartments:
| This neighborhood: | 2.2 |
| San Jose: | 2.3 |
Average number of cars or other vehicles available in apartments:
| Here: | 3.5 |
| city: | 1.6 |
Percentage of units with a mortgage:
| Flickinger South: | 72.3% |
| San Jose: | 66.9% |
Housing prices:
- Average estimated value of detached houses in 2022 (68.9% of all units):
Flickinger South: $1,228,700 San Jose: $1,532,815
- Average estimated value of townhouses or other attached units in 2022 (23.9% of all units):
This neighborhood: $759,768 city: $1,024,857
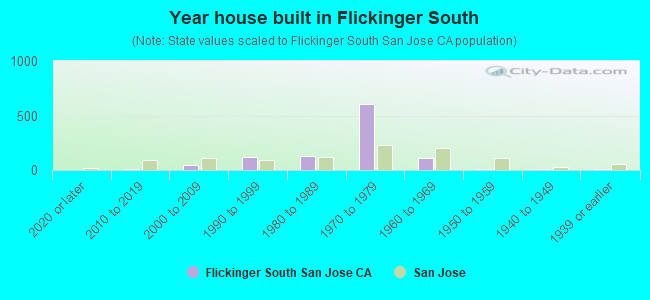
- Year house built in Flickinger South
- 02020 or later
- 72010 to 2019
- 422000 to 2009
- 1231990 to 1999
- 1331980 to 1989
- 6061970 to 1979
- 1141960 to 1969
- 81950 to 1959
- 71940 to 1949
- 61939 or earlier
City-data.com crime index for city in 2020 (higher means more crime):
| City: | 268.4 |
| U.S. average: | 219.5 |
Travel time to work (commute)
![Travel time to work (commute)]()
- 11Less than 5 minutes
- 335 to 9 minutes
- 9510 to 14 minutes
- 22515 to 19 minutes
- 22620 to 24 minutes
- 9725 to 29 minutes
- 14430 to 34 minutes
- 3035 to 39 minutes
- 6140 to 44 minutes
- 10845 to 59 minutes
- 3260 to 89 minutes
- 6590 or more minutes

Means of transportation to work
![Means of transportation to work]()
- 65.6%1,267Drove a car alone
- 12.1%234Carpooled
- 3.0%57Bus
- 0.3%6Subway or elevated rail
- 1.9%37Light rail, streetcar or trolley
- 1.0%19Motorcycle
- 2.8%55Walked
- 5.7%110Other means
- 16.3%314Worked at home

Time leaving home to go to work
![Time leaving home to go to work]()
- 5612:00 a.m. to 4:59 a.m.
- 225:00 a.m. to 5:29 a.m.
- 295:30 a.m. to 5:59 a.m.
- 746:00 a.m. to 6:29 a.m.
- 796:30 a.m. to 6:59 a.m.
- 1027:00 a.m. to 7:29 a.m.
- 1987:30 a.m. to 7:59 a.m.
- 1038:00 a.m. to 8:29 a.m.
- 678:30 a.m. to 8:59 a.m.
- 1589:00 a.m. to 9:59 a.m.
- 6710:00 a.m. to 10:59 a.m.
- 4011:00 a.m. to 11:59 a.m.
- 7212:00 p.m. to 3:59 p.m.
- 304:00 p.m. to 11:59 p.m.

Occupations of males:
- Percentage of males in management occupations (except farmers):
Here: 8.4% city: 13.0%
- Percentage of males in business and financial operations occupations:
Here: 5.3% city: 4.6%
- Percentage of males in computer and mathematical occupations:
Here: 17.2% city: 13.6%
- Percentage of males in architecture and engineering occupations:
Here: 9.7% city: 10.2%
- Percentage of males in life, physical, and social science occupations:
Here: 1.1% city: 1.1%
- Percentage of males in education, training, and library occupations:
Here: 1.4% city: 2.8%
- Percentage of males in healthcare practitioners and technical occupations:
Here: 3.2% city: 2.0%
- Percentage of males in service occupations:
Here: 17.2% city: 12.7%
- Percentage of males in sales and office occupations:
Here: 9.1% city: 12.8%
- Percentage of males in construction, extraction, and maintenance occupations:
Here: 5.9% city: 7.8%
- Percentage of males in production occupations:
Here: 3.9% city: 5.5%
- Percentage of males in transportation occupations:
Here: 6.4% city: 3.6%
- Percentage of males in material moving occupations:
Here: 3.7% city: 3.1%
Occupations of females:
- Percentage of females in management occupations (except farmers):
Here: 12.7% city: 11.0%
- Percentage of females in business and financial operations occupations:
Here: 1.6% city: 8.6%
- Percentage of females in computer and mathematical occupations:
Here: 14.6% city: 5.4%
- Percentage of females in architecture and engineering occupations:
Here: 4.2% city: 2.8%
- Percentage of females in life, physical, and social science occupations:
Here: 3.4% city: 1.7%
- Percentage of females in education, training, and library occupations:
Here: 5.4% city: 8.1%
- Percentage of females in healthcare practitioners and technical occupations:
Here: 5.6% city: 6.8%
- Percentage of females in service occupations:
Here: 15.8% city: 21.7%
- Percentage of females in sales and office occupations:
Here: 26.8% city: 22.0%
- Percentage of females in production occupations:
Here: 9.5% city: 4.0%
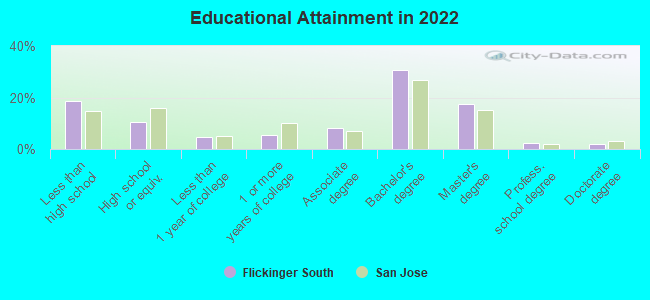
Education in this neighborhood (subdivision or community):
- Percentage of people 3 years and older in K-12 schools:
Flickinger South: 14.8% San Jose: 16.1%
- Percentage of people 3 years and older in undergraduate colleges:
Flickinger South: 7.7% San Jose: 6.5%
- Percentage of people 3 years and older in grad. or professional schools:
Flickinger South: 2.9% San Jose: 2.0%
- Percentage of students K-12 enrolled in private schools:
Flickinger South: 31.6% San Jose: 14.9%
Percentage of population below poverty level:
| Flickinger South: | 3.2% |
| San Jose: | 9.0% |
Median year owner moved in (as recorded in 2022):
Median year renter moved in (as recorded in 2022):
| Flickinger South: | 2001 |
| San Jose: | 2008 |
Median year renter moved in (as recorded in 2022):
| Flickinger South: | 2016 |
| San Jose: | 2020 |
Percentage of married-couple families with both working:
| Flickinger South: | 92.9% |
| San Jose: | 72.5% |
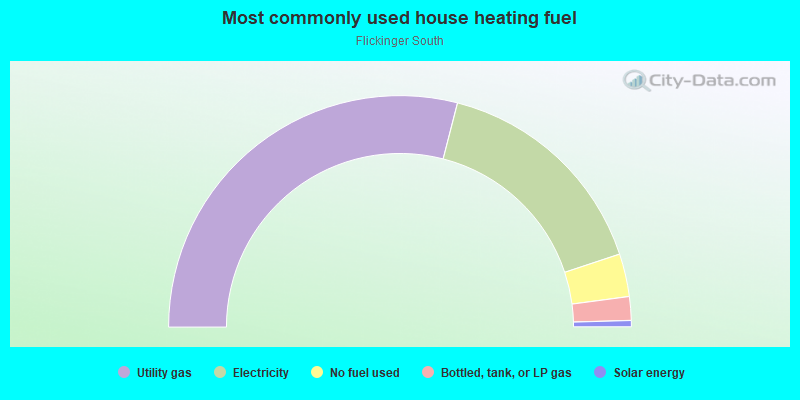
- 58.0%Utility gas
- 31.8%Electricity
- 6.0%No fuel used
- 3.3%Bottled, tank, or LP gas
- 0.9%Solar energy
Limited-access highways (interstate or state) in this neighborhood:
I- 680 (Sinclair Fwy)
Length: 0.53 miles
Direction: SE-NW
Direction: SE-NW
Roads and streets:
Tofts Dr
Length: 0.47 miles
Directions: E-W, N-S, SE-NW, SW-NE
Address range: 1100 to 1399
Directions: E-W, N-S, SE-NW, SW-NE
Address range: 1100 to 1399
Charger Dr
Length: 0.34 miles
Directions: E-W, N-S, SE-NW, SW-NE
Address range: 2000 to 2299
Directions: E-W, N-S, SE-NW, SW-NE
Address range: 2000 to 2299
Hikido Dr
Length: 0.30 miles
Directions: N-S, SW-NE
Address range: 2100 to 2299
Directions: N-S, SW-NE
Address range: 2100 to 2299
Tourney Dr
Length: 0.29 miles
Directions: E-W, SE-NW
Address range: 1200 to 1399
Directions: E-W, SE-NW
Address range: 1200 to 1399
Turrett Dr
Length: 0.28 miles
Directions: E-W, SE-NW, SW-NE
Address range: 1200 to 1415
Directions: E-W, SE-NW, SW-NE
Address range: 1200 to 1415
Aberford Dr
Length: 0.27 miles
Directions: N-S, SE-NW, SW-NE
Address range: 1200 to 1399
Directions: N-S, SE-NW, SW-NE
Address range: 1200 to 1399
Berryessa Rd
Length: 0.25 miles
Direction: SW-NE
Address range: 12938 to 13199
Direction: SW-NE
Address range: 12938 to 13199
Pembroke Dr
Length: 0.22 miles
Directions: E-W, SE-NW
Address range: 1100 to 1299
Directions: E-W, SE-NW
Address range: 1100 to 1299
Sierra Rd
Length: 0.22 miles
Directions: N-S, SW-NE
Address range: 2090 to 2299
Directions: N-S, SW-NE
Address range: 2090 to 2299
Mich Bluff Dr
Length: 0.22 miles
Directions: E-W, SE-NW, SW-NE
Address range: 1200 to 1399
Directions: E-W, SE-NW, SW-NE
Address range: 1200 to 1399
Ramish Dr
Length: 0.19 miles
Directions: E-W, SW-NE
Address range: 2100 to 2299
Directions: E-W, SW-NE
Address range: 2100 to 2299
Jonesport Ave
Length: 0.17 miles
Directions: E-W, SW-NE
Address range: 2066 to 2299
Directions: E-W, SW-NE
Address range: 2066 to 2299
Chertsey Ct
Length: 0.10 miles
Direction: SE-NW
Address range: 1300 to 1399
Direction: SE-NW
Address range: 1300 to 1399
Best Ct
Length: 0.09 miles
Directions: E-W, SE-NW, SW-NE
Address range: 2100 to 2299
Directions: E-W, SE-NW, SW-NE
Address range: 2100 to 2299
Cardona Way
Length: 0.08 miles
Direction: SE-NW
Address range: 1200 to 1299
Direction: SE-NW
Address range: 1200 to 1299
Oakbluff Ct
Length: 0.06 miles
Direction: SE-NW
Address range: 1100 to 1199
Direction: SE-NW
Address range: 1100 to 1199
Jonesport Ct
Length: 0.05 miles
Direction: SE-NW
Address range: 1100 to 1199
Direction: SE-NW
Address range: 1100 to 1199
Belthorn Ct
Length: 0.05 miles
Direction: SW-NE
Address range: 2200 to 2299
Direction: SW-NE
Address range: 2200 to 2299
Wigan Ct
Length: 0.05 miles
Directions: N-S, SW-NE
Address range: 2200 to 2299
Directions: N-S, SW-NE
Address range: 2200 to 2299
Talesfore Ct
Length: 0.02 miles
Directions: N-S, SE-NW
Address range: 1100 to 1199
Directions: N-S, SE-NW
Address range: 1100 to 1199
Woodranch Rd
Length: 0.02 miles
Directions: N-S, SE-NW
Directions: N-S, SE-NW