Fisher Park neighborhood in Greensboro, North Carolina (NC), 27401 detailed profile
Settings
X


Business Search - 14 Million verified businesses
Area: 0.336 square miles
Population: 1,541
Population density:
| Fisher Park: | 4,581 people per square mile |
| Greensboro: | 2,876 people per square mile |

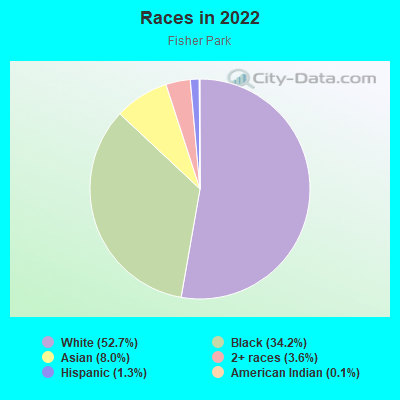
- 81352.7%White
- 52734.2%Black
- 1248.0%Asian
- 563.6%Two or more races
- 201.3%Hispanic or Latino
- 20.1%American Indian
Median household income in 2022:
| Fisher Park: | $36,094 |
| Greensboro: | $55,120 |
Distribution of median household income
![Distribution of median household income]()
- 110Less than $10,000
- 136$10,000 to $19,999
- 167$20,000 to $29,999
- 56$30,000 to $39,999
- 48$40,000 to $49,999
- 30$50,000 to $59,999
- 30$60,000 to $74,999
- 48$75,000 to $99,999
- 59$100,000 to $124,999
- 24$125,000 to $149,999
- 125$150,000 to $199,999
- 58$200,000 or more

Distribution of owner-occupied house/condo value
![Distribution of owner-occupied house/condo value]()
- 8$50,000 to $99,999
- 8$100,000 to $149,999
- 16$150,000 to $199,999
- 24$200,000 to $249,999
- 22$250,000 to $299,999
- 61$300,000 to $399,999
- 49$400,000 to $499,999
- 47$500,000 to $749,999
- 13$750,000 to $999,999
- 20$1,000,000 or more

Distribution of rent paid by renters
![Distribution of rent paid by renters]()
- 2$100 to $199
- 51$400 to $499
- 93$500 to $599
- 192$600 to $699
- 62$700 to $799
- 80$800 to $899
- 33$900 to $999
- 79$1,000 to $1,249
- 62$1,500 to $1,999

Median rent in 2022:
| Fisher Park: | $695 |
| Greensboro: | $915 |
| Males: | 673 |
| Females: | 868 |
Males:
| This neighborhood: | 35.9 years |
| Whole city: | 32.4 years |
| This neighborhood: | 34.7 years |
| Whole city: | 35.3 years |
Average household size:
| Fisher Park: | 1.7 people |
| Greensboro: | 2.3 people |
Percentage of family households:
| Fisher Park: | 34.1% |
| Greensboro: | 43.6% |
| Here: | 31.4% |
| Greensboro: | 36.2% |
Percentage of married-couple families with children (among all households):
| Fisher Park: | 37.9% |
| Greensboro: | 22.4% |
Percentage of single-mother households (among all households):
| Fisher Park: | 19.5% |
| Greensboro: | 15.5% |
Percentage of never married males 15 years old and over:
Percentage of never married females 15 years old and over:
| Fisher Park: | 17.4% |
| Greensboro: | 20.8% |
Percentage of never married females 15 years old and over:
| Fisher Park: | 14.7% |
| city: | 23.9% |
Percentage of people that speak English not well or not at all:
| Fisher Park: | 0.2% |
| Greensboro: | 2.7% |
Percentage of people born in this state:
Percentage of people born in another U.S. state:
Percentage of native residents but born outside the U.S.:
Percentage of foreign born residents:
| Here: | 43.9% |
| Greensboro: | 52.7% |
Percentage of people born in another U.S. state:
| Fisher Park: | 43.6% |
| Greensboro: | 33.7% |
Percentage of native residents but born outside the U.S.:
| Here: | 0.9% |
| city: | 1.6% |
Percentage of foreign born residents:
| Here: | 11.6% |
| Greensboro: | 12.0% |
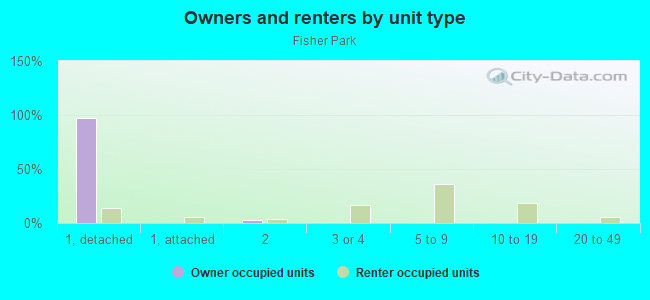
Owner-occupied
Renter-occupied

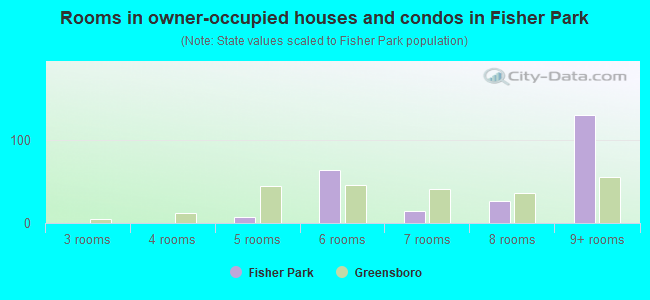
- Rooms in owner-occupied houses and condos in Fisher Park
- 01 room
- 02 rooms
- 03 rooms
- 04 rooms
- 75 rooms
- 646 rooms
- 147 rooms
- 268 rooms
- 1309+ rooms
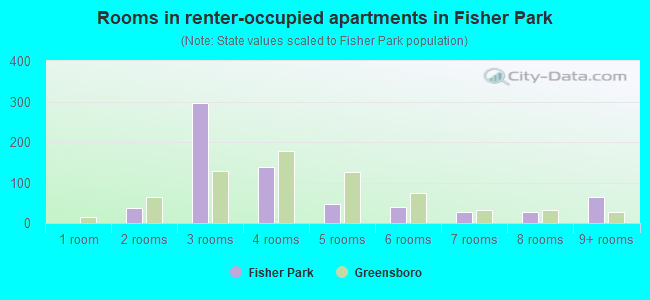
- Rooms in renter-occupied apartments in Fisher Park
- 01 room
- 372 rooms
- 2973 rooms
- 1384 rooms
- 485 rooms
- 406 rooms
- 287 rooms
- 268 rooms
- 649+ rooms
Owner-occupied
Renter-occupied
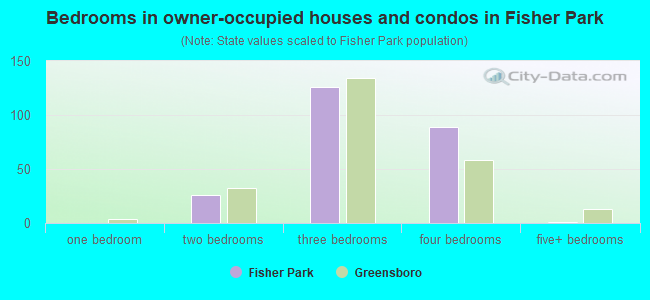
- Bedrooms in owner-occupied houses and condos in Fisher Park
- 0no bedroom
- 01 bedroom
- 262 bedrooms
- 1263 bedrooms
- 894 bedrooms
- 15+ bedrooms
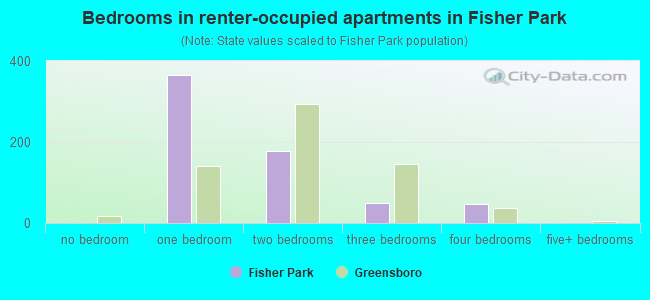
- Bedrooms in renter-occupied apartments in Fisher Park
- 0no bedroom
- 3651 bedroom
- 1782 bedrooms
- 503 bedrooms
- 474 bedrooms
- 05+ bedrooms
Average number of cars or other vehicles available in houses/condos:
Average number of cars or other vehicles available in apartments:
| This neighborhood: | 1.9 |
| Greensboro: | 2.0 |
Average number of cars or other vehicles available in apartments:
| Here: | 1.0 |
| city: | 1.4 |
Percentage of units with a mortgage:
| Fisher Park: | 65.3% |
| Greensboro: | 67.4% |
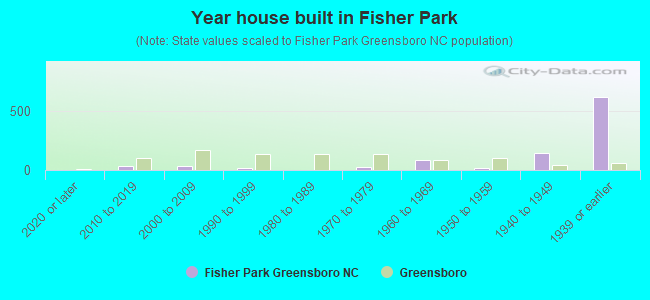
- Year house built in Fisher Park
- 02020 or later
- 352010 to 2019
- 342000 to 2009
- 171990 to 1999
- 31980 to 1989
- 281970 to 1979
- 871960 to 1969
- 141950 to 1959
- 1431940 to 1949
- 6191939 or earlier
City-data.com crime index for city in 2020 (higher means more crime):
| City: | 435.6 |
| U.S. average: | 219.5 |
Travel time to work (commute)
![Travel time to work (commute)]()
- 40Less than 5 minutes
- 915 to 9 minutes
- 15210 to 14 minutes
- 10115 to 19 minutes
- 6020 to 24 minutes
- 5125 to 29 minutes
- 1330 to 34 minutes
- 3545 to 59 minutes
- 2960 to 89 minutes

Means of transportation to work
![Means of transportation to work]()
- 52.3%437Drove a car alone
- 3.9%33Carpooled
- 2.8%23Bus
- 9.1%76Motorcycle
- 8.9%74Bicycle
- 8.9%74Walked
- 13.9%116Worked at home

Time leaving home to go to work
![Time leaving home to go to work]()
- 912:00 a.m. to 4:59 a.m.
- 15:00 a.m. to 5:29 a.m.
- 136:00 a.m. to 6:29 a.m.
- 686:30 a.m. to 6:59 a.m.
- 937:00 a.m. to 7:29 a.m.
- 1597:30 a.m. to 7:59 a.m.
- 1048:00 a.m. to 8:29 a.m.
- 48:30 a.m. to 8:59 a.m.
- 209:00 a.m. to 9:59 a.m.
- 1210:00 a.m. to 10:59 a.m.
- 2011:00 a.m. to 11:59 a.m.
- 3912:00 p.m. to 3:59 p.m.
- 104:00 p.m. to 11:59 p.m.

Occupations of males:
- Percentage of males in management occupations (except farmers):
Here: 5.9% city: 10.2%
- Percentage of males in business and financial operations occupations:
Here: 1.7% city: 4.8%
- Percentage of males in computer and mathematical occupations:
Here: 18.8% city: 3.9%
- Percentage of males in architecture and engineering occupations:
Here: 3.6% city: 3.1%
- Percentage of males in life, physical, and social science occupations:
Here: 8.3% city: 0.9%
- Percentage of males in community and social services occupations:
Here: 3.0% city: 1.4%
- Percentage of males in education, training, and library occupations:
Here: 18.2% city: 4.0%
- Percentage of males in arts, design, entertainment, sports, and media occupations:
Here: 13.2% city: 1.5%
- Percentage of males in healthcare practitioners and technical occupations:
Here: 1.3% city: 3.1%
- Percentage of males in service occupations:
Here: 5.9% city: 14.3%
- Percentage of males in sales and office occupations:
Here: 14.9% city: 17.1%
- Percentage of males in transportation occupations:
Here: 5.3% city: 6.8%
- Percentage of males in material moving occupations:
Here: 6.1% city: 9.6%
Occupations of females:
- Percentage of females in management occupations (except farmers):
Here: 14.4% city: 7.8%
- Percentage of females in business and financial operations occupations:
Here: 5.7% city: 5.5%
- Percentage of females in community and social services occupations:
Here: 1.9% city: 3.2%
- Percentage of females in education, training, and library occupations:
Here: 17.5% city: 10.3%
- Percentage of females in arts, design, entertainment, sports, and media occupations:
Here: 5.2% city: 1.8%
- Percentage of females in healthcare practitioners and technical occupations:
Here: 6.6% city: 8.6%
- Percentage of females in service occupations:
Here: 11.1% city: 19.4%
- Percentage of females in sales and office occupations:
Here: 25.5% city: 29.0%
- Percentage of females in construction, extraction, and maintenance occupations:
Here: 9.7% city: 0.5%
- Percentage of females in production occupations:
Here: 2.6% city: 5.2%
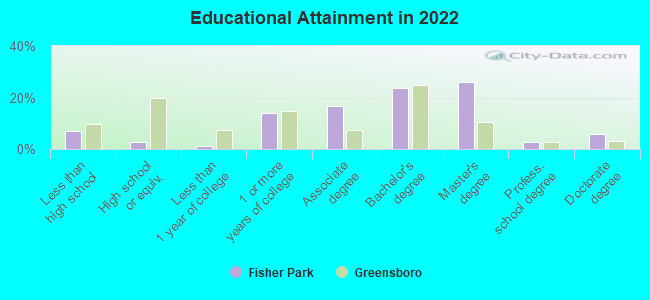
Education in this neighborhood (subdivision or community):
- Percentage of people 3 years and older in K-12 schools:
Fisher Park: 8.9% Greensboro: 17.6%
- Percentage of people 3 years and older in undergraduate colleges:
Fisher Park: 7.7% Greensboro: 11.2%
- Percentage of people 3 years and older in grad. or professional schools:
Fisher Park: 9.6% Greensboro: 2.6%
- Percentage of students K-12 enrolled in private schools:
Fisher Park: 5.3% Greensboro: 13.3%
Percentage of population below poverty level:
| Fisher Park: | 27.1% |
| Greensboro: | 21.9% |
Median year owner moved in (as recorded in 2022):
Median year renter moved in (as recorded in 2022):
| Fisher Park: | 2014 |
| Greensboro: | 2010 |
Median year renter moved in (as recorded in 2022):
| Fisher Park: | 2018 |
| Greensboro: | 2020 |
Percentage of married-couple families with both working:
| Fisher Park: | 81.6% |
| Greensboro: | 70.9% |
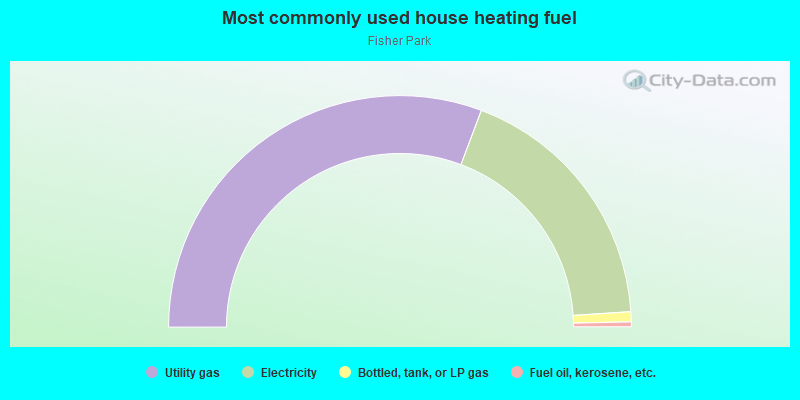
- 61.4%Utility gas
- 36.4%Electricity
- 1.4%Bottled, tank, or LP gas
- 0.7%Fuel oil, kerosene, etc.
Highways in this neighborhood:
E Wendover Ave (US Hwy 220, US Hwy 421)
Length: 0.25 miles
Direction: E-W
Direction: E-W
W Wendover Ave (US Hwy 220, US Hwy 421)
Length: 0.17 miles
Direction: E-W
Address range: 101 to 299
Direction: E-W
Address range: 101 to 299
Roads and streets:
N Elm St
Length: 0.64 miles
Direction: N-S
Address range: 500 to 1091
Direction: N-S
Address range: 500 to 1091
N Church St
Length: 0.60 miles
Direction: N-S
Address range: 434 to 919
Direction: N-S
Address range: 434 to 919
Fisher Park Cir
Length: 0.52 miles
Directions: E-W, N-S, SE-NW, SW-NE
Address range: 300 to 399
Directions: E-W, N-S, SE-NW, SW-NE
Address range: 300 to 399
Magnolia St
Length: 0.51 miles
Direction: N-S
Address range: 600 to 1199
Direction: N-S
Address range: 600 to 1199
N Eugene St
Length: 0.49 miles
Directions: N-S, SW-NE
Address range: 600 to 1099
Directions: N-S, SW-NE
Address range: 600 to 1099
W Bessemer Ave
Length: 0.42 miles
Directions: E-W, N-S, SW-NE
Address range: 100 to 499
Directions: E-W, N-S, SW-NE
Address range: 100 to 499
Olive St
Length: 0.31 miles
Direction: N-S
Address range: 800 to 1099
Direction: N-S
Address range: 800 to 1099
E Bessemer Ave
Length: 0.30 miles
Direction: E-W
Address range: 100 to 499
Direction: E-W
Address range: 100 to 499
Florence St
Length: 0.30 miles
Directions: E-W, SE-NW, SW-NE
Address range: 200 to 399
Directions: E-W, SE-NW, SW-NE
Address range: 200 to 399
E Hendrix St
Length: 0.29 miles
Directions: E-W, SW-NE
Address range: 100 to 399
Directions: E-W, SW-NE
Address range: 100 to 399
Simpson St
Length: 0.28 miles
Direction: N-S
Address range: 600 to 899
Direction: N-S
Address range: 600 to 899
W Fisher Ave
Length: 0.27 miles
Direction: E-W
Address range: 100 to 399
Direction: E-W
Address range: 100 to 399
S Park Dr
Length: 0.26 miles
Directions: E-W, SE-NW
Directions: E-W, SE-NW
Carolina St
Length: 0.25 miles
Direction: N-S
Address range: 900 to 1091
Direction: N-S
Address range: 900 to 1091
N Park Dr
Length: 0.25 miles
Directions: E-W, SE-NW
Address range: 101 to 299
Directions: E-W, SE-NW
Address range: 101 to 299
N Greene St
Length: 0.22 miles
Direction: N-S
Address range: 600 to 799
Direction: N-S
Address range: 600 to 799
E Fisher Ave
Length: 0.22 miles
Direction: E-W
Address range: 100 to 299
Direction: E-W
Address range: 100 to 299
Victoria St
Length: 0.19 miles
Direction: E-W
Address range: 200 to 499
Direction: E-W
Address range: 200 to 499
Isabel St
Length: 0.18 miles
Directions: E-W, SE-NW
Address range: 200 to 399
Directions: E-W, SE-NW
Address range: 200 to 399
Parkway Ave
Length: 0.16 miles
Direction: SE-NW
Address range: 300 to 399
Direction: SE-NW
Address range: 300 to 399
Leftwich St
Length: 0.15 miles
Direction: E-W
Address range: 200 to 299
Direction: E-W
Address range: 200 to 299
Cherry St
Length: 0.13 miles
Direction: N-S
Address range: 900 to 985
Direction: N-S
Address range: 900 to 985
Virginia St
Length: 0.13 miles
Direction: N-S
Address range: 1100 to 1191
Direction: N-S
Address range: 1100 to 1191
Wharton St
Length: 0.11 miles
Direction: N-S
Address range: 1000 to 1099
Direction: N-S
Address range: 1000 to 1099
E Smith St
Length: 0.09 miles
Direction: E-W
Address range: 100 to 147
Direction: E-W
Address range: 100 to 147
W Smith St
Length: 0.09 miles
Direction: E-W
Address range: 100 to 199
Direction: E-W
Address range: 100 to 199
W Hendrix St
Length: 0.09 miles
Direction: E-W
Address range: 100 to 199
Direction: E-W
Address range: 100 to 199
Cleveland St
Length: 0.08 miles
Direction: E-W
Address range: 300 to 399
Direction: E-W
Address range: 300 to 399
Zev Pl
Length: 0.06 miles
Direction: E-W
Address range: 400 to 499
Direction: E-W
Address range: 400 to 499
Battleground Ave
Length: 0.05 miles
Direction: SE-NW
Address range: 500 to 599
Direction: SE-NW
Address range: 500 to 599
Magnolia Ct
Length: 0.05 miles
Directions: E-W, SE-NW, SW-NE
Address range: 1 to 99
Directions: E-W, SE-NW, SW-NE
Address range: 1 to 99