Fish neighborhood in San Mateo, California (CA), 94404 detailed profile
Settings
X

Business Search - 14 Million verified businesses
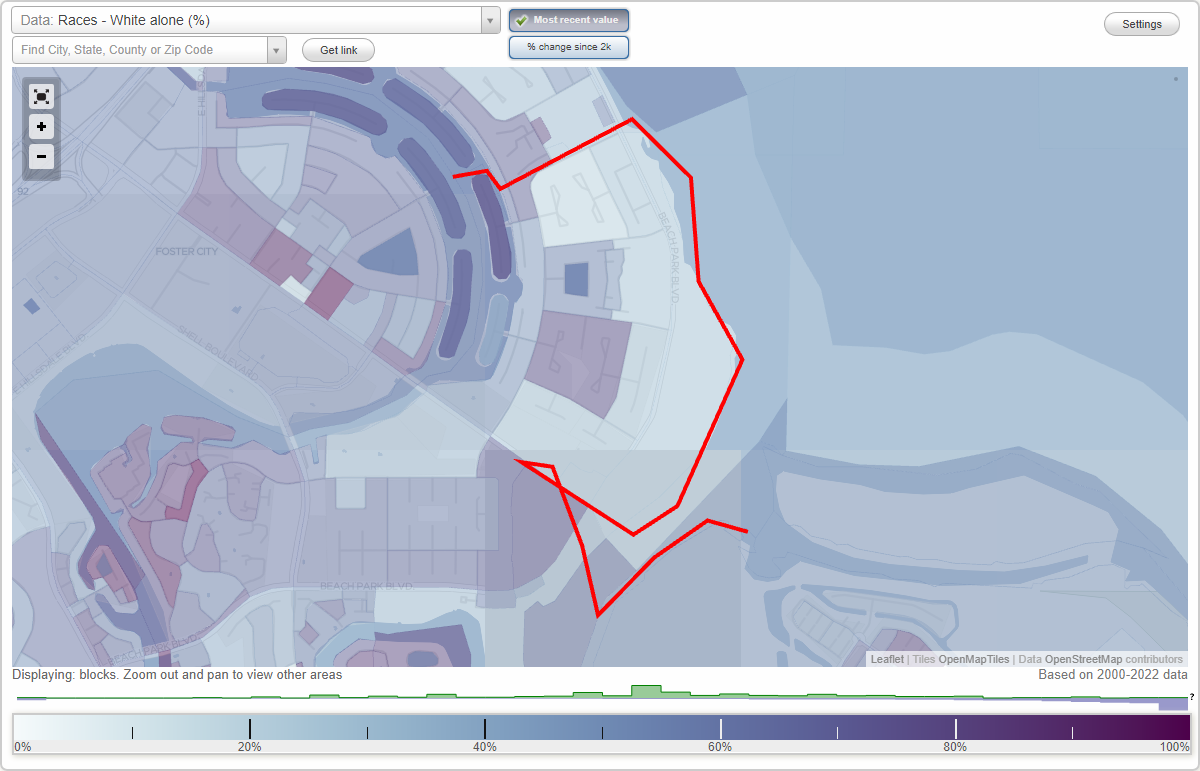
Area: 0.456 square miles
Population: 1,377
Population density:
| Fish: | 3,019 people per square mile |
| San Mateo: | 8,266 people per square mile |

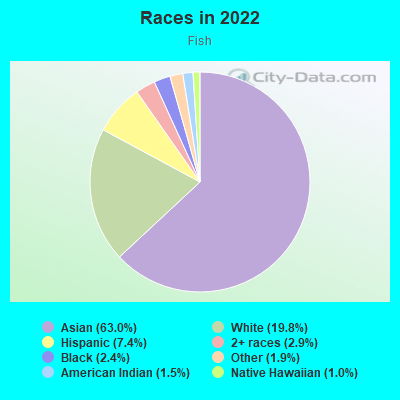
- 90563.0%Asian
- 28519.8%White
- 1077.4%Hispanic or Latino
- 422.9%Two or more races
- 342.4%Black
- 281.9%Some other race
- 211.5%American Indian
- 151.0%Native Hawaiian and Other
Pacific Islander
Median household income in 2022:
| Fish: | $201,159 |
| San Mateo: | $159,275 |
Distribution of median household income
![Distribution of median household income]()
- 19Less than $10,000
- 622$10,000 to $19,999
- 18$20,000 to $29,999
- 28$30,000 to $39,999
- 19$40,000 to $49,999
- 9$50,000 to $59,999
- 23$60,000 to $74,999
- 23$75,000 to $99,999
- 38$100,000 to $124,999
- 29$125,000 to $149,999
- 100$150,000 to $199,999
- 240$200,000 or more

Distribution of owner-occupied house/condo value
![Distribution of owner-occupied house/condo value]()
- 17Less than $50,000
- 14$150,000 to $199,999
- 5$200,000 to $249,999
- 8$250,000 to $299,999
- 22$500,000 to $749,999
- 9$750,000 to $999,999
- 324$1,000,000 or more

Distribution of rent paid by renters
![Distribution of rent paid by renters]()
- 102$900 to $999
- 22$1,000 to $1,249
- 12$1,250 to $1,499
- 27$1,500 to $1,999
- 127$2,000 or more

Median rent in 2022:
| Fish: | $3,187 |
| San Mateo: | $2,001 |
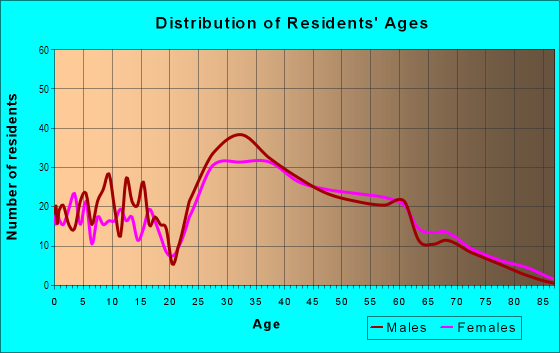
| Males: | 613 |
| Females: | 764 |
Males:
| This neighborhood: | 38.1 years |
| Whole city: | 37.8 years |
| This neighborhood: | 38.7 years |
| Whole city: | 40.5 years |
Average household size:
| Fish: | 6.5 people |
| San Mateo: | 2.6 people |
Percentage of family households:
| Fish: | 45.0% |
| San Mateo: | 41.3% |
| Here: | 71.1% |
| San Mateo: | 48.9% |
Percentage of married-couple families with children (among all households):
| Fish: | 33.7% |
| San Mateo: | 29.2% |
Percentage of single-mother households (among all households):
| Fish: | 1.8% |
| San Mateo: | 5.8% |
Percentage of never married males 15 years old and over:
Percentage of never married females 15 years old and over:
| Fish: | 8.3% |
| San Mateo: | 18.2% |
Percentage of never married females 15 years old and over:
| Fish: | 11.9% |
| city: | 17.0% |
Percentage of people that speak English not well or not at all:
| Fish: | 2.8% |
| San Mateo: | 6.3% |
Percentage of people born in this state:
Percentage of people born in another U.S. state:
Percentage of native residents but born outside the U.S.:
Percentage of foreign born residents:
| Here: | 36.8% |
| San Mateo: | 48.0% |
Percentage of people born in another U.S. state:
| Fish: | 14.6% |
| San Mateo: | 14.4% |
Percentage of native residents but born outside the U.S.:
| Here: | 0.7% |
| city: | 1.1% |
Percentage of foreign born residents:
| Here: | 47.9% |
| San Mateo: | 36.5% |
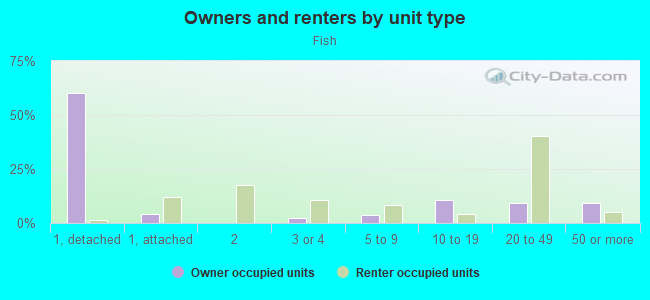
Owner-occupied
Renter-occupied

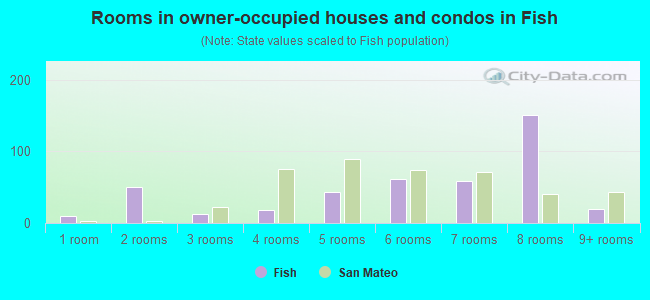
- Rooms in owner-occupied houses and condos in Fish
- 101 room
- 502 rooms
- 133 rooms
- 184 rooms
- 435 rooms
- 616 rooms
- 597 rooms
- 1518 rooms
- 199+ rooms
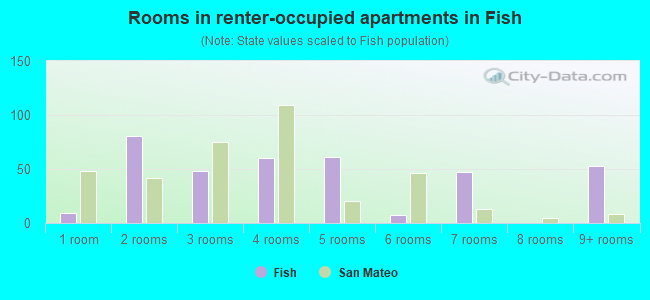
- Rooms in renter-occupied apartments in Fish
- 91 room
- 812 rooms
- 483 rooms
- 604 rooms
- 615 rooms
- 76 rooms
- 477 rooms
- 08 rooms
- 539+ rooms
Owner-occupied
Renter-occupied
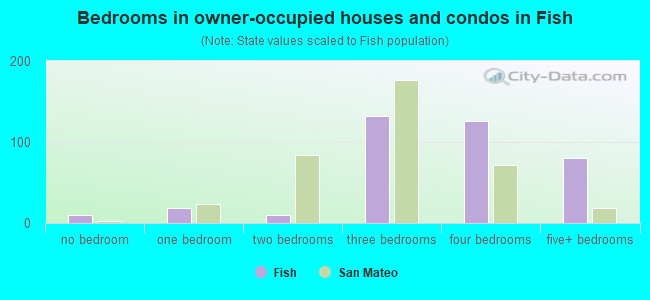
- Bedrooms in owner-occupied houses and condos in Fish
- 10no bedroom
- 191 bedroom
- 102 bedrooms
- 1323 bedrooms
- 1264 bedrooms
- 805+ bedrooms
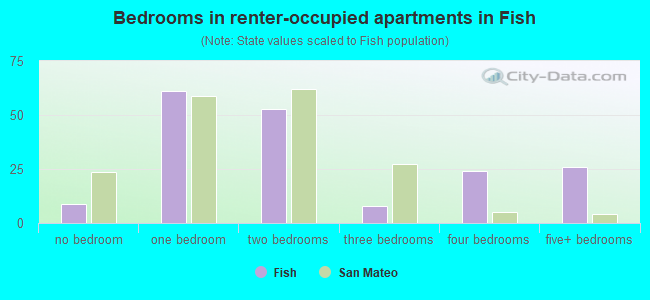
- Bedrooms in renter-occupied apartments in Fish
- 9no bedroom
- 611 bedroom
- 532 bedrooms
- 83 bedrooms
- 244 bedrooms
- 265+ bedrooms
Average number of cars or other vehicles available in houses/condos:
Average number of cars or other vehicles available in apartments:
| This neighborhood: | 2.3 |
| San Mateo: | 2.0 |
Average number of cars or other vehicles available in apartments:
| Here: | 1.4 |
| city: | 1.4 |
Percentage of units with a mortgage:
| Fish: | 78.5% |
| San Mateo: | 70.1% |
Housing prices:
- Average estimated value of detached houses in 2022 (66.4% of all units):
Fish: $3,858,253 California: $988,808
- Average estimated value of townhouses or other attached units in 2022 (4.8% of all units):
This neighborhood: $100,372 California: $838,546
- Average estimated '22 value of housing units in 5-or-more-unit structures (4.1% of all units):
Fish: $117,602 California: $730,996
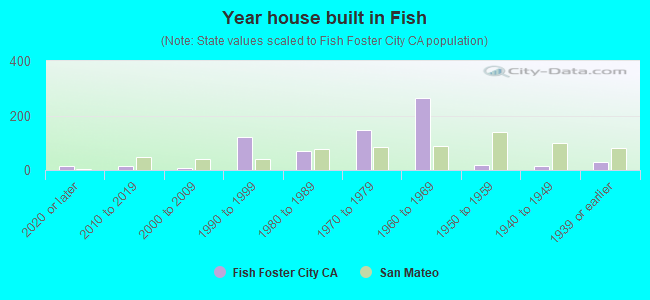
- Year house built in Fish
- 132020 or later
- 132010 to 2019
- 82000 to 2009
- 1211990 to 1999
- 701980 to 1989
- 1481970 to 1979
- 2641960 to 1969
- 201950 to 1959
- 131940 to 1949
- 311939 or earlier
City-data.com crime index for city in 2020 (higher means more crime):
| City: | 202.6 |
| U.S. average: | 219.5 |
Travel time to work (commute)
![Travel time to work (commute)]()
- 4Less than 5 minutes
- 445 to 9 minutes
- 7410 to 14 minutes
- 6115 to 19 minutes
- 5820 to 24 minutes
- 3225 to 29 minutes
- 8530 to 34 minutes
- 3935 to 39 minutes
- 2340 to 44 minutes
- 6445 to 59 minutes
- 3160 to 89 minutes
- 990 or more minutes

Means of transportation to work
![Means of transportation to work]()
- 62.3%421Drove a car alone
- 10.2%69Carpooled
- 1.5%10Bus
- 1.2%8Subway or elevated rail
- 1.0%7Long-distance train or commuter rail
- 3.7%25Taxi
- 1.0%7Motorcycle
- 1.5%10Bicycle
- 0.9%6Walked
- 1.2%8Other means
- 23.5%159Worked at home

Time leaving home to go to work
![Time leaving home to go to work]()
- 1412:00 a.m. to 4:59 a.m.
- 35:00 a.m. to 5:29 a.m.
- 195:30 a.m. to 5:59 a.m.
- 146:00 a.m. to 6:29 a.m.
- 426:30 a.m. to 6:59 a.m.
- 517:00 a.m. to 7:29 a.m.
- 977:30 a.m. to 7:59 a.m.
- 1008:00 a.m. to 8:29 a.m.
- 558:30 a.m. to 8:59 a.m.
- 899:00 a.m. to 9:59 a.m.
- 4010:00 a.m. to 10:59 a.m.
- 911:00 a.m. to 11:59 a.m.
- 4012:00 p.m. to 3:59 p.m.
- 114:00 p.m. to 11:59 p.m.

Occupations of males:
- Percentage of males in management occupations (except farmers):
Here: 20.4% city: 17.3%
- Percentage of males in business and financial operations occupations:
Here: 5.1% city: 5.6%
- Percentage of males in computer and mathematical occupations:
Here: 31.0% city: 15.5%
- Percentage of males in architecture and engineering occupations:
Here: 8.3% city: 4.6%
- Percentage of males in life, physical, and social science occupations:
Here: 6.1% city: 2.6%
- Percentage of males in community and social services occupations:
Here: 2.1% city: 1.2%
- Percentage of males in education, training, and library occupations:
Here: 3.8% city: 3.1%
- Percentage of males in healthcare practitioners and technical occupations:
Here: 1.9% city: 3.6%
- Percentage of males in service occupations:
Here: 9.7% city: 11.1%
- Percentage of males in sales and office occupations:
Here: 7.3% city: 12.6%
- Percentage of males in material moving occupations:
Here: 2.8% city: 2.3%
Occupations of females:
- Percentage of females in management occupations (except farmers):
Here: 14.5% city: 15.9%
- Percentage of females in business and financial operations occupations:
Here: 31.3% city: 11.0%
- Percentage of females in computer and mathematical occupations:
Here: 10.3% city: 6.6%
- Percentage of females in architecture and engineering occupations:
Here: 1.8% city: 1.6%
- Percentage of females in life, physical, and social science occupations:
Here: 7.8% city: 3.9%
- Percentage of females in education, training, and library occupations:
Here: 2.4% city: 6.9%
- Percentage of females in healthcare practitioners and technical occupations:
Here: 8.1% city: 8.3%
- Percentage of females in service occupations:
Here: 3.1% city: 16.0%
- Percentage of females in sales and office occupations:
Here: 10.8% city: 19.6%
- Percentage of females in production occupations:
Here: 6.8% city: 1.6%
- Percentage of females in transportation occupations:
Here: 2.8% city: 0.8%
Percentage of people 16-64 in Armed Forces:
| Fish: | 0.1% |
| San Mateo: | 0.0% |
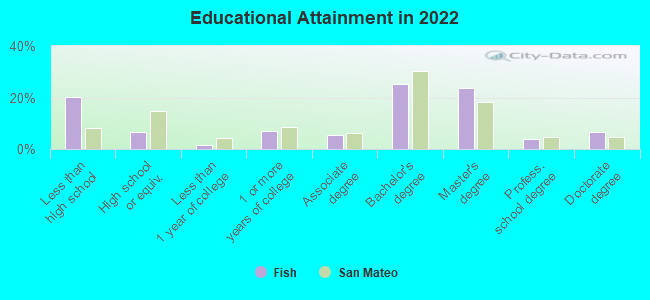
Education in this neighborhood (subdivision or community):
- Percentage of people 3 years and older in K-12 schools:
Fish: 16.1% San Mateo: 15.7%
- Percentage of people 3 years and older in undergraduate colleges:
Fish: 1.3% San Mateo: 4.9%
- Percentage of people 3 years and older in grad. or professional schools:
Fish: 1.5% San Mateo: 1.2%
- Percentage of students K-12 enrolled in private schools:
Fish: 60.8% San Mateo: 18.6%
Percentage of population below poverty level:
| Fish: | 3.2% |
| San Mateo: | 8.3% |
Percentage of married-couple families with both working:
| Fish: | 80.6% |
| San Mateo: | 66.4% |
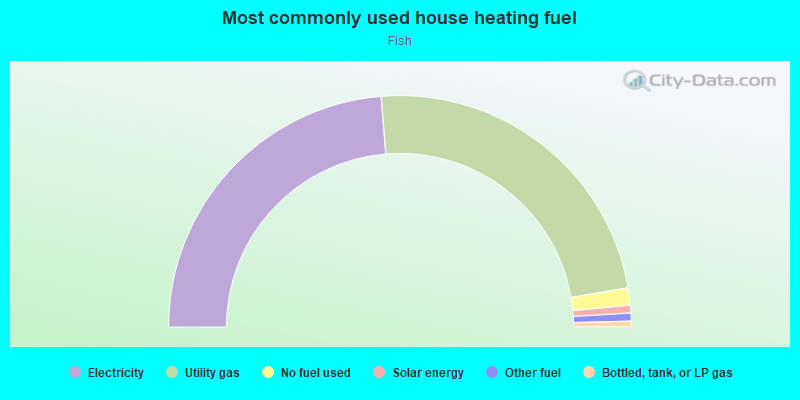
- 47.4%Electricity
- 47.2%Utility gas
- 2.4%No fuel used
- 1.1%Solar energy
- 1.1%Other fuel
- 0.8%Bottled, tank, or LP gas
Roads and streets:
Beach Park Blvd
Length: 1.00 miles
Directions: N-S, SE-NW, SW-NE
Address range: 1100 to 1495
Directions: N-S, SE-NW, SW-NE
Address range: 1100 to 1495
Marlin Ave
Length: 0.94 miles
Directions: E-W, N-S, SW-NE
Address range: 700 to 1499
Directions: E-W, N-S, SW-NE
Address range: 700 to 1499
Swordfish St
Length: 0.38 miles
Direction: E-W
Address range: 1200 to 1499
Direction: E-W
Address range: 1200 to 1499
Halibut St
Length: 0.37 miles
Directions: E-W, SE-NW
Address range: 1300 to 1499
Directions: E-W, SE-NW
Address range: 1300 to 1499
Tarpon St
Length: 0.37 miles
Direction: E-W
Address range: 1300 to 1499
Direction: E-W
Address range: 1300 to 1499
Pompano Cir
Length: 0.34 miles
Directions: E-W, N-S, SE-NW, SW-NE
Address range: 300 to 399
Directions: E-W, N-S, SE-NW, SW-NE
Address range: 300 to 399
Foster City Blvd
Length: 0.33 miles
Direction: SE-NW
Address range: 1100 to 1199
Direction: SE-NW
Address range: 1100 to 1199
Bonita Ln
Length: 0.27 miles
Directions: E-W, N-S, SW-NE
Address range: 100 to 298
Directions: E-W, N-S, SW-NE
Address range: 100 to 298
Moonsail Ln
Length: 0.25 miles
Directions: E-W, SE-NW, SW-NE
Address range: 1229 to 1299
Directions: E-W, SE-NW, SW-NE
Address range: 1229 to 1299
Bowfin St
Length: 0.25 miles
Directions: N-S, SW-NE
Address range: 300 to 399
Directions: N-S, SW-NE
Address range: 300 to 399
Haddock St
Length: 0.25 miles
Directions: N-S, SW-NE
Address range: 836 to 999
Directions: N-S, SW-NE
Address range: 836 to 999
Ribbon St
Length: 0.24 miles
Directions: N-S, SE-NW
Address range: 1200 to 1399
Directions: N-S, SE-NW
Address range: 1200 to 1399
Albacore Ln
Length: 0.23 miles
Directions: E-W, N-S
Address range: 100 to 299
Directions: E-W, N-S
Address range: 100 to 299
Dolphin Isle
Length: 0.21 miles
Directions: N-S, SE-NW
Address range: 300 to 399
Directions: N-S, SE-NW
Address range: 300 to 399
Bluefish Ct
Length: 0.20 miles
Directions: E-W, N-S, SE-NW
Address range: 2 to 399
Directions: E-W, N-S, SE-NW
Address range: 2 to 399
Surfperch St
Length: 0.19 miles
Direction: E-W
Address range: 800 to 999
Direction: E-W
Address range: 800 to 999
Cod St
Length: 0.19 miles
Direction: E-W
Address range: 850 to 999
Direction: E-W
Address range: 850 to 999
Menhaden Ct
Length: 0.16 miles
Directions: N-S, SW-NE
Address range: 300 to 399
Directions: N-S, SW-NE
Address range: 300 to 399
Grunion Ct
Length: 0.14 miles
Directions: E-W, SE-NW, SW-NE
Address range: 2 to 399
Directions: E-W, SE-NW, SW-NE
Address range: 2 to 399
Mullet Ct
Length: 0.14 miles
Directions: N-S, SW-NE
Address range: 300 to 399
Directions: N-S, SW-NE
Address range: 300 to 399
Sailfish Isle
Length: 0.13 miles
Directions: N-S, SW-NE
Address range: 300 to 399
Directions: N-S, SW-NE
Address range: 300 to 399
Bramble Ct
Length: 0.12 miles
Directions: SE-NW, SW-NE
Address range: 300 to 399
Directions: SE-NW, SW-NE
Address range: 300 to 399
Shad Ct
Length: 0.10 miles
Direction: N-S
Address range: 300 to 399
Direction: N-S
Address range: 300 to 399
Sunfish Ct
Length: 0.10 miles
Directions: N-S, SW-NE
Address range: 300 to 399
Directions: N-S, SW-NE
Address range: 300 to 399
Flying Fish St
Length: 0.10 miles
Direction: N-S
Address range: 1100 to 1199
Direction: N-S
Address range: 1100 to 1199
Sea Horse Ct
Length: 0.08 miles
Direction: N-S
Address range: 300 to 399
Direction: N-S
Address range: 300 to 399