Farnam neighborhood in San Jose, California (CA), 95124 detailed profile
Settings
X

Business Search - 14 Million verified businesses
Area: 0.165 square miles
Population: 1,359
Population density:
| Farnam: | 8,235 people per square mile |
| San Jose: | 5,554 people per square mile |

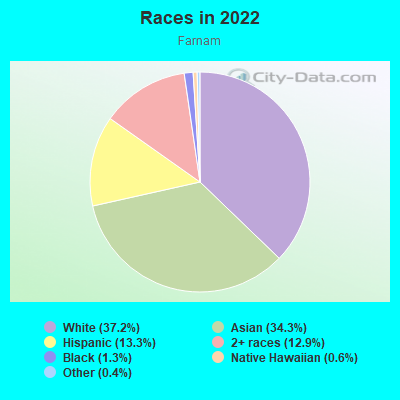
- 50637.2%White
- 46734.3%Asian
- 18113.3%Hispanic or Latino
- 17612.9%Two or more races
- 181.3%Black
- 80.6%Native Hawaiian and Other
Pacific Islander - 50.4%Some other race
Median household income in 2022:
| Farnam: | $134,375 |
| San Jose: | $133,835 |
Distribution of median household income
![Distribution of median household income]()
- 39Less than $10,000
- 38$10,000 to $19,999
- 18$20,000 to $29,999
- 62$30,000 to $39,999
- 34$40,000 to $49,999
- 15$50,000 to $59,999
- 27$60,000 to $74,999
- 41$75,000 to $99,999
- 36$100,000 to $124,999
- 29$125,000 to $149,999
- 53$150,000 to $199,999
- 170$200,000 or more

Distribution of owner-occupied house/condo value
![Distribution of owner-occupied house/condo value]()
- 3$50,000 to $99,999
- 3$300,000 to $399,999
- 10$500,000 to $749,999
- 21$750,000 to $999,999
- 266$1,000,000 or more

Distribution of rent paid by renters
![Distribution of rent paid by renters]()
- 13$300 to $399
- 3$700 to $799
- 2$900 to $999
- 21$1,000 to $1,249
- 26$1,250 to $1,499
- 47$1,500 to $1,999
- 141$2,000 or more

Median rent in 2022:
| Farnam: | $2,548 |
| San Jose: | $2,001 |
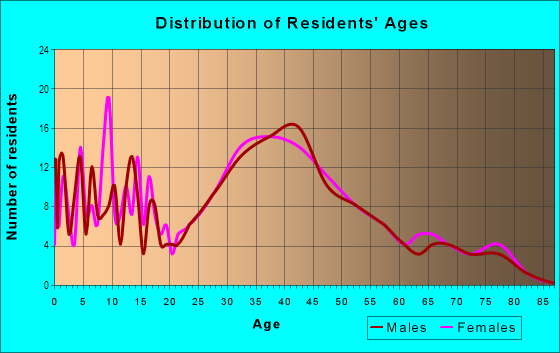
| Males: | 662 |
| Females: | 697 |
Males:
| This neighborhood: | 33.2 years |
| Whole city: | 37.6 years |
| This neighborhood: | 35.5 years |
| Whole city: | 39.1 years |
Average household size:
| Farnam: | 2.8 people |
| San Jose: | 2.9 people |
Percentage of family households:
| Farnam: | 63.7% |
| San Jose: | 49.9% |
| Here: | 45.2% |
| San Jose: | 53.0% |
Percentage of married-couple families with children (among all households):
| Farnam: | 15.2% |
| San Jose: | 25.8% |
Percentage of single-mother households (among all households):
| Farnam: | 19.9% |
| San Jose: | 5.2% |
Percentage of never married males 15 years old and over:
Percentage of never married females 15 years old and over:
| Farnam: | 22.5% |
| San Jose: | 20.9% |
Percentage of never married females 15 years old and over:
| Farnam: | 7.9% |
| city: | 16.7% |
Percentage of people that speak English not well or not at all:
| Farnam: | 0.0% |
| San Jose: | 11.4% |
Percentage of people born in this state:
Percentage of people born in another U.S. state:
Percentage of native residents but born outside the U.S.:
Percentage of foreign born residents:
| Here: | 57.4% |
| San Jose: | 46.1% |
Percentage of people born in another U.S. state:
| Farnam: | 19.2% |
| San Jose: | 10.4% |
Percentage of native residents but born outside the U.S.:
| Here: | 0.8% |
| city: | 1.7% |
Percentage of foreign born residents:
| Here: | 22.6% |
| San Jose: | 41.8% |
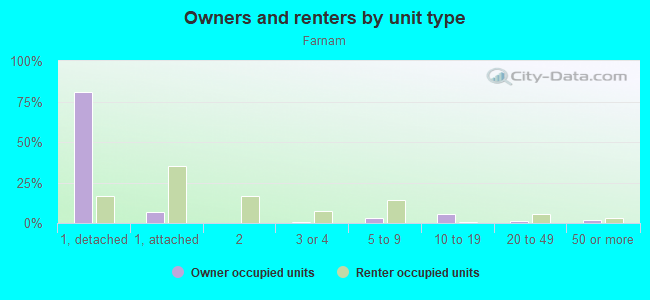
Owner-occupied
Renter-occupied

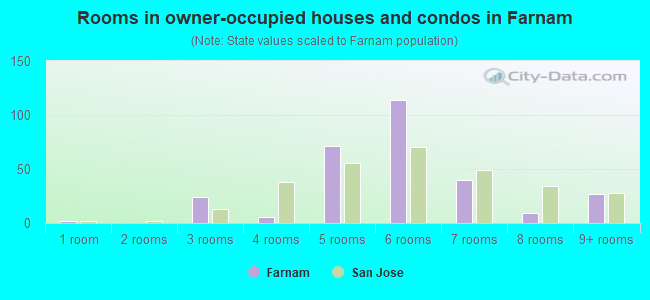
- Rooms in owner-occupied houses and condos in Farnam
- 21 room
- 02 rooms
- 243 rooms
- 64 rooms
- 715 rooms
- 1146 rooms
- 407 rooms
- 98 rooms
- 279+ rooms
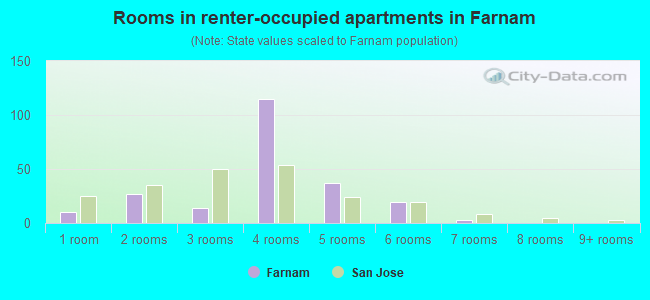
- Rooms in renter-occupied apartments in Farnam
- 101 room
- 272 rooms
- 143 rooms
- 1154 rooms
- 375 rooms
- 196 rooms
- 37 rooms
- 08 rooms
- 09+ rooms
Owner-occupied
Renter-occupied
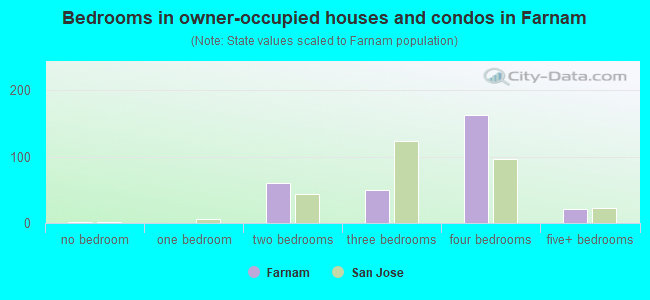
- Bedrooms in owner-occupied houses and condos in Farnam
- 2no bedroom
- 01 bedroom
- 602 bedrooms
- 503 bedrooms
- 1634 bedrooms
- 215+ bedrooms
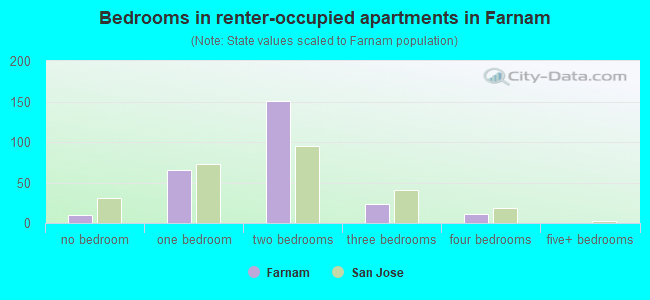
- Bedrooms in renter-occupied apartments in Farnam
- 10no bedroom
- 651 bedroom
- 1512 bedrooms
- 243 bedrooms
- 114 bedrooms
- 05+ bedrooms
Average number of cars or other vehicles available in houses/condos:
Average number of cars or other vehicles available in apartments:
| This neighborhood: | 2.1 |
| San Jose: | 2.3 |
Average number of cars or other vehicles available in apartments:
| Here: | 1.7 |
| city: | 1.6 |
Percentage of units with a mortgage:
| Farnam: | 76.7% |
| San Jose: | 66.9% |
Housing prices:
- Average estimated value of detached houses in 2022 (60.7% of all units):
Farnam: $1,558,582 San Jose: $1,532,815
- Average estimated value of townhouses or other attached units in 2022 (21.0% of all units):
This neighborhood: $5,845,250 city: $1,024,857
- Average estimated '22 value of housing units in 5-or-more-unit structures (1.4% of all units):
Farnam: $776,360 San Jose: $791,954
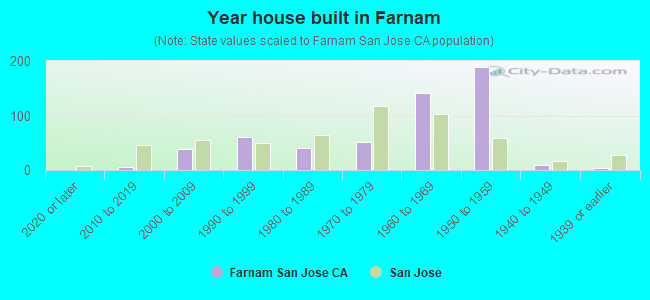
- Year house built in Farnam
- 02020 or later
- 62010 to 2019
- 382000 to 2009
- 611990 to 1999
- 401980 to 1989
- 521970 to 1979
- 1421960 to 1969
- 1891950 to 1959
- 101940 to 1949
- 31939 or earlier
City-data.com crime index for city in 2020 (higher means more crime):
| City: | 268.4 |
| U.S. average: | 219.5 |
Travel time to work (commute)
![Travel time to work (commute)]()
- 9Less than 5 minutes
- 585 to 9 minutes
- 8910 to 14 minutes
- 16115 to 19 minutes
- 9720 to 24 minutes
- 3625 to 29 minutes
- 12930 to 34 minutes
- 1935 to 39 minutes
- 2140 to 44 minutes
- 4445 to 59 minutes
- 4260 to 89 minutes
- 1690 or more minutes

Means of transportation to work
![Means of transportation to work]()
- 68.0%416Drove a car alone
- 4.7%29Carpooled
- 0.8%5Bus
- 0.8%5Long-distance train or commuter rail
- 1.1%7Motorcycle
- 1.0%6Bicycle
- 0.5%3Walked
- 5.2%32Other means
- 20.3%124Worked at home

Time leaving home to go to work
![Time leaving home to go to work]()
- 2912:00 a.m. to 4:59 a.m.
- 135:00 a.m. to 5:29 a.m.
- 175:30 a.m. to 5:59 a.m.
- 136:00 a.m. to 6:29 a.m.
- 286:30 a.m. to 6:59 a.m.
- 737:00 a.m. to 7:29 a.m.
- 767:30 a.m. to 7:59 a.m.
- 1498:00 a.m. to 8:29 a.m.
- 818:30 a.m. to 8:59 a.m.
- 979:00 a.m. to 9:59 a.m.
- 4910:00 a.m. to 10:59 a.m.
- 1211:00 a.m. to 11:59 a.m.
- 6312:00 p.m. to 3:59 p.m.
- 484:00 p.m. to 11:59 p.m.

Occupations of males:
- Percentage of males in management occupations (except farmers):
Here: 9.4% city: 13.0%
- Percentage of males in business and financial operations occupations:
Here: 3.5% city: 4.6%
- Percentage of males in computer and mathematical occupations:
Here: 23.0% city: 13.6%
- Percentage of males in architecture and engineering occupations:
Here: 2.1% city: 10.2%
- Percentage of males in life, physical, and social science occupations:
Here: 2.7% city: 1.1%
- Percentage of males in legal occupations:
Here: 1.5% city: 0.8%
- Percentage of males in education, training, and library occupations:
Here: 3.1% city: 2.8%
- Percentage of males in arts, design, entertainment, sports, and media occupations:
Here: 5.1% city: 1.8%
- Percentage of males in healthcare practitioners and technical occupations:
Here: 3.5% city: 2.0%
- Percentage of males in service occupations:
Here: 12.7% city: 12.7%
- Percentage of males in sales and office occupations:
Here: 30.2% city: 12.8%
- Percentage of males in construction, extraction, and maintenance occupations:
Here: 1.6% city: 7.8%
- Percentage of males in production occupations:
Here: 1.4% city: 5.5%
- Percentage of males in transportation occupations:
Here: 1.8% city: 3.6%
Occupations of females:
- Percentage of females in management occupations (except farmers):
Here: 22.7% city: 11.0%
- Percentage of females in business and financial operations occupations:
Here: 6.4% city: 8.6%
- Percentage of females in computer and mathematical occupations:
Here: 7.4% city: 5.4%
- Percentage of females in architecture and engineering occupations:
Here: 3.9% city: 2.8%
- Percentage of females in community and social services occupations:
Here: 1.8% city: 1.8%
- Percentage of females in legal occupations:
Here: 1.5% city: 1.3%
- Percentage of females in education, training, and library occupations:
Here: 6.4% city: 8.1%
- Percentage of females in arts, design, entertainment, sports, and media occupations:
Here: 1.9% city: 2.0%
- Percentage of females in healthcare practitioners and technical occupations:
Here: 25.0% city: 6.8%
- Percentage of females in service occupations:
Here: 11.9% city: 21.7%
- Percentage of females in sales and office occupations:
Here: 9.7% city: 22.0%
- Percentage of females in production occupations:
Here: 7.0% city: 4.0%
- Percentage of females in transportation occupations:
Here: 2.5% city: 0.7%
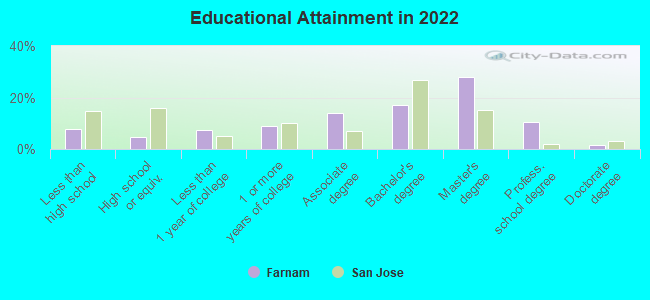
Education in this neighborhood (subdivision or community):
- Percentage of people 3 years and older in K-12 schools:
Farnam: 23.7% San Jose: 16.1%
- Percentage of people 3 years and older in undergraduate colleges:
Farnam: 6.1% San Jose: 6.5%
- Percentage of people 3 years and older in grad. or professional schools:
Farnam: 1.4% San Jose: 2.0%
- Percentage of students K-12 enrolled in private schools:
Farnam: 9.5% San Jose: 14.9%
Percentage of population below poverty level:
| Farnam: | 6.3% |
| San Jose: | 9.0% |
Median year owner moved in (as recorded in 2022):
Median year renter moved in (as recorded in 2022):
| Farnam: | 2011 |
| San Jose: | 2008 |
Median year renter moved in (as recorded in 2022):
| Farnam: | 2015 |
| San Jose: | 2020 |
Percentage of married-couple families with both working:
| Farnam: | 90.6% |
| San Jose: | 72.5% |
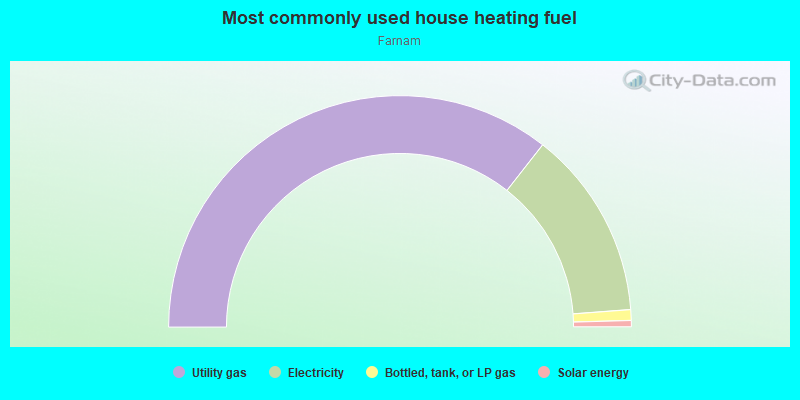
- 71.1%Utility gas
- 26.4%Electricity
- 1.5%Bottled, tank, or LP gas
- 0.9%Solar energy
Roads and streets:
Sunrise Dr
Length: 0.42 miles
Directions: E-W, SE-NW
Address range: 2200 to 2399
Directions: E-W, SE-NW
Address range: 2200 to 2399
Stratford Dr
Length: 0.38 miles
Directions: E-W, SE-NW
Address range: 2240 to 2399
Directions: E-W, SE-NW
Address range: 2240 to 2399
Starbright Dr
Length: 0.35 miles
Directions: E-W, SE-NW
Address range: 2200 to 2399
Directions: E-W, SE-NW
Address range: 2200 to 2399
May Ln
Length: 0.27 miles
Directions: E-W, N-S, SE-NW, SW-NE
Address range: 3400 to 3699
Directions: E-W, N-S, SE-NW, SW-NE
Address range: 3400 to 3699
Woodard Rd
Length: 0.25 miles
Direction: E-W
Address range: 2280 to 15899
Direction: E-W
Address range: 2280 to 15899
Calico Ave
Length: 0.24 miles
Directions: N-S, SW-NE
Address range: 3300 to 3638
Directions: N-S, SW-NE
Address range: 3300 to 3638
Camden Ave
Length: 0.19 miles
Direction: SE-NW
Address range: 2100 to 15399
Direction: SE-NW
Address range: 2100 to 15399
Mount Davidson Dr
Length: 0.19 miles
Direction: E-W
Address range: 2200 to 2381
Direction: E-W
Address range: 2200 to 2381
Nova Scotia Ave
Length: 0.16 miles
Directions: N-S, SW-NE
Address range: 3400 to 9550
Directions: N-S, SW-NE
Address range: 3400 to 9550
Starview Dr
Length: 0.15 miles
Directions: N-S, SW-NE
Address range: 3700 to 3949
Directions: N-S, SW-NE
Address range: 3700 to 3949
Shelley Ave
Length: 0.14 miles
Direction: E-W
Address range: 2200 to 2399
Direction: E-W
Address range: 2200 to 2399
Twilight Dr
Length: 0.14 miles
Directions: N-S, SW-NE
Address range: 3700 to 3949
Directions: N-S, SW-NE
Address range: 3700 to 3949
Wine Grower Way
Length: 0.10 miles
Direction: E-W
Direction: E-W
Wine Cask Way
Length: 0.09 miles
Direction: N-S
Address range: 3400 to 3498
Direction: N-S
Address range: 3400 to 3498
Calvin Ave
Length: 0.07 miles
Directions: N-S, SW-NE
Address range: 3200 to 3299
Directions: N-S, SW-NE
Address range: 3200 to 3299
McCoppin Park Ct
Length: 0.05 miles
Directions: E-W, N-S
Address range: 3500 to 3599
Directions: E-W, N-S
Address range: 3500 to 3599
Lapridge Ln
Length: 0.05 miles
Directions: N-S, SW-NE
Address range: 3400 to 3499
Directions: N-S, SW-NE
Address range: 3400 to 3499
Wine Cork Way
Length: 0.05 miles
Direction: N-S
Address range: 3400 to 3499
Direction: N-S
Address range: 3400 to 3499
Wine Barrel Way
Length: 0.05 miles
Direction: N-S
Address range: 3400 to 3499
Direction: N-S
Address range: 3400 to 3499
Wine Maker Way
Length: 0.04 miles
Direction: N-S
Address range: 2200 to 3499
Direction: N-S
Address range: 2200 to 3499
Ida Way
Length: 0.03 miles
Direction: E-W
Direction: E-W
Mount Davidson Ct
Length: 0.03 miles
Directions: N-S, SW-NE
Address range: 3500 to 3908
Directions: N-S, SW-NE
Address range: 3500 to 3908
Calvelli Ct
Length: 0.03 miles
Direction: N-S
Address range: 3500 to 3599
Direction: N-S
Address range: 3500 to 3599