Evergreen Park neighborhood in Palo Alto, California (CA), 94301, 94306 detailed profile
Settings
X

Business Search - 14 Million verified businesses
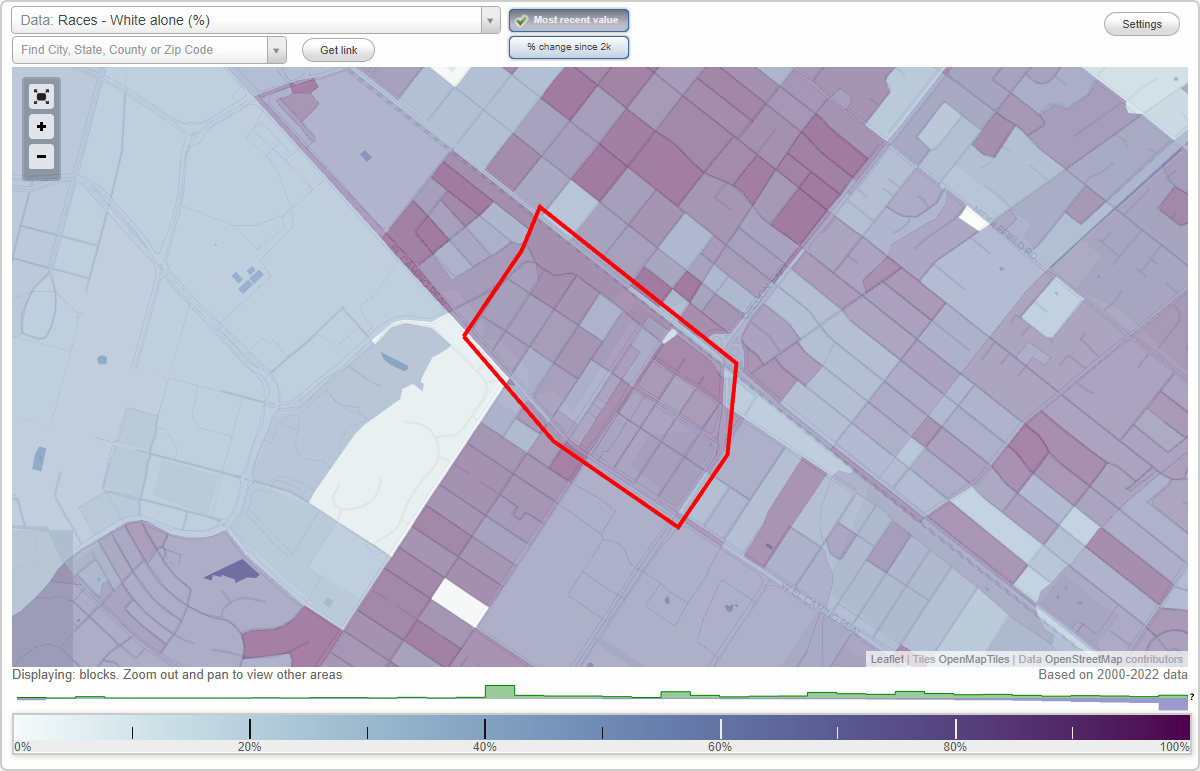
Area: 0.255 square miles
Population: 1,367
Population density:
| Evergreen Park: | 5,365 people per square mile |
| Palo Alto: | 2,789 people per square mile |

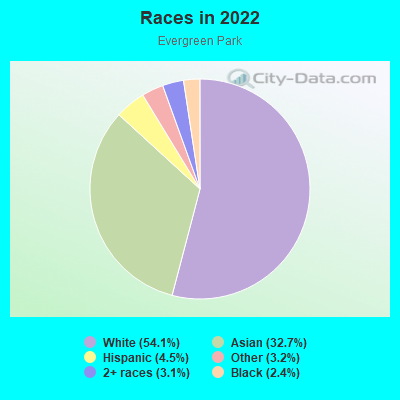
- 79454.1%White
- 47932.7%Asian
- 664.5%Hispanic or Latino
- 473.2%Some other race
- 463.1%Two or more races
- 352.4%Black
Median household income in 2022:
| Evergreen Park: | $218,872 |
| Palo Alto: | $179,707 |
Distribution of median household income
![Distribution of median household income]()
- 26Less than $10,000
- 35$10,000 to $19,999
- 45$20,000 to $29,999
- 31$30,000 to $39,999
- 36$40,000 to $49,999
- 17$50,000 to $59,999
- 22$60,000 to $74,999
- 42$75,000 to $99,999
- 19$100,000 to $124,999
- 55$125,000 to $149,999
- 46$150,000 to $199,999
- 350$200,000 or more

Distribution of owner-occupied house/condo value
![Distribution of owner-occupied house/condo value]()
- 12Less than $50,000
- 17$50,000 to $99,999
- 8$150,000 to $199,999
- 7$400,000 to $499,999
- 15$500,000 to $749,999
- 38$750,000 to $999,999
- 354$1,000,000 or more

Distribution of rent paid by renters
![Distribution of rent paid by renters]()
- 11$800 to $899
- 20$1,250 to $1,499
- 17$1,500 to $1,999
- 232$2,000 or more

Median rent in 2022:
| Evergreen Park: | $3,248 |
| Palo Alto: | $2,001 |
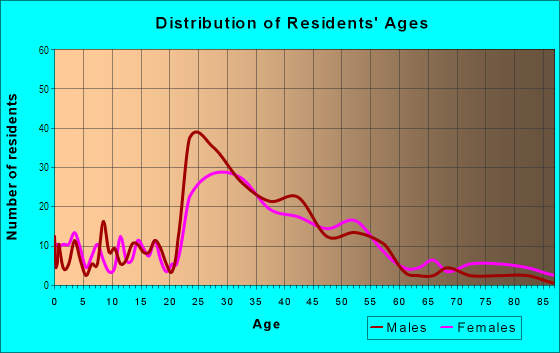
| Males: | 654 |
| Females: | 712 |
Males:
| This neighborhood: | 46.8 years |
| Whole city: | 47.1 years |
| This neighborhood: | 46.6 years |
| Whole city: | 48.1 years |
Average household size:
| Evergreen Park: | 2.6 people |
| Palo Alto: | 2.3 people |
Percentage of family households:
| Evergreen Park: | 52.0% |
| Palo Alto: | 42.2% |
| Here: | 64.9% |
| Palo Alto: | 52.1% |
Percentage of married-couple families with children (among all households):
| Evergreen Park: | 32.0% |
| Palo Alto: | 37.5% |
Percentage of single-mother households (among all households):
| Evergreen Park: | 5.5% |
| Palo Alto: | 3.5% |
Percentage of never married males 15 years old and over:
Percentage of never married females 15 years old and over:
| Evergreen Park: | 7.6% |
| Palo Alto: | 17.4% |
Percentage of never married females 15 years old and over:
| Evergreen Park: | 11.3% |
| city: | 11.8% |
Percentage of people that speak English not well or not at all:
| Evergreen Park: | 0.9% |
| Palo Alto: | 3.7% |
Percentage of people born in this state:
Percentage of people born in another U.S. state:
Percentage of native residents but born outside the U.S.:
Percentage of foreign born residents:
| Here: | 33.2% |
| Palo Alto: | 36.4% |
Percentage of people born in another U.S. state:
| Evergreen Park: | 25.9% |
| Palo Alto: | 28.3% |
Percentage of native residents but born outside the U.S.:
| Here: | 1.6% |
| city: | 3.7% |
Percentage of foreign born residents:
| Here: | 39.3% |
| Palo Alto: | 31.6% |
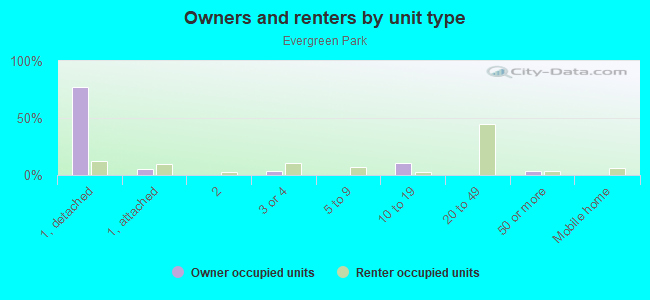
Owner-occupied
Renter-occupied

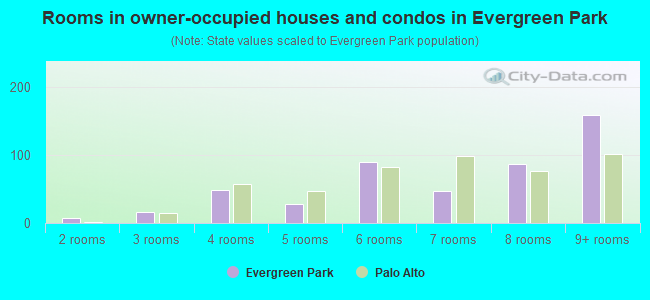
- Rooms in owner-occupied houses and condos in Evergreen Park
- 01 room
- 82 rooms
- 163 rooms
- 484 rooms
- 285 rooms
- 906 rooms
- 477 rooms
- 878 rooms
- 1599+ rooms
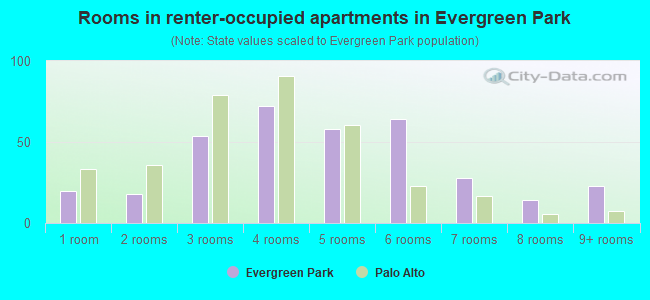
- Rooms in renter-occupied apartments in Evergreen Park
- 201 room
- 182 rooms
- 543 rooms
- 724 rooms
- 585 rooms
- 646 rooms
- 287 rooms
- 148 rooms
- 239+ rooms
Owner-occupied
Renter-occupied
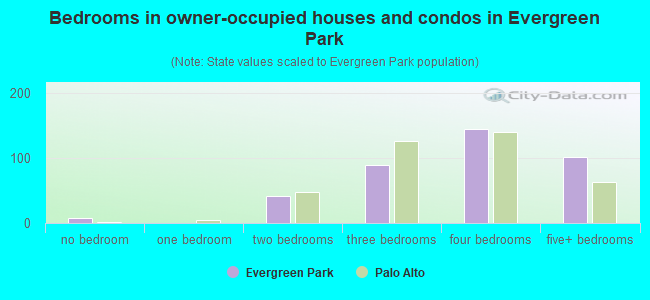
- Bedrooms in owner-occupied houses and condos in Evergreen Park
- 8no bedroom
- 01 bedroom
- 422 bedrooms
- 893 bedrooms
- 1454 bedrooms
- 1025+ bedrooms
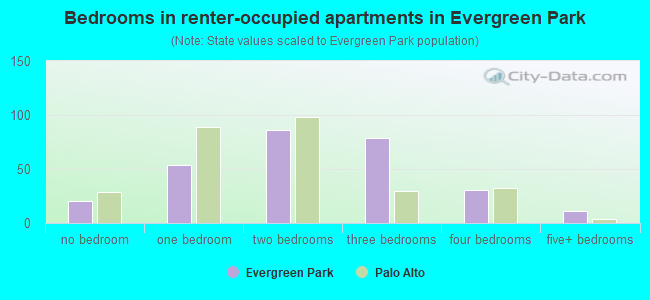
- Bedrooms in renter-occupied apartments in Evergreen Park
- 20no bedroom
- 541 bedroom
- 862 bedrooms
- 793 bedrooms
- 314 bedrooms
- 115+ bedrooms
Average number of cars or other vehicles available in houses/condos:
Average number of cars or other vehicles available in apartments:
| This neighborhood: | 2.1 |
| Palo Alto: | 2.1 |
Average number of cars or other vehicles available in apartments:
| Here: | 1.4 |
| city: | 1.1 |
Percentage of units with a mortgage:
| Evergreen Park: | 46.9% |
| Palo Alto: | 58.3% |
Average estimated value of detached houses in 2022 (68.6% of all units):
| Evergreen Park: | $3,334,924 |
| California: | $988,808 |
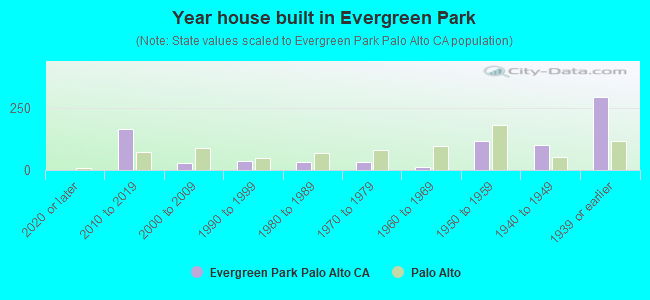
- Year house built in Evergreen Park
- 02020 or later
- 1652010 to 2019
- 272000 to 2009
- 371990 to 1999
- 311980 to 1989
- 311970 to 1979
- 141960 to 1969
- 1161950 to 1959
- 1021940 to 1949
- 2951939 or earlier
City-data.com crime index for city in 2020 (higher means more crime):
| City: | 180.8 |
| U.S. average: | 219.5 |
Travel time to work (commute)
![Travel time to work (commute)]()
- 9Less than 5 minutes
- 505 to 9 minutes
- 18510 to 14 minutes
- 21015 to 19 minutes
- 28720 to 24 minutes
- 8125 to 29 minutes
- 19130 to 34 minutes
- 2035 to 39 minutes
- 4840 to 44 minutes
- 7345 to 59 minutes
- 2660 to 89 minutes
- 2190 or more minutes

Means of transportation to work
![Means of transportation to work]()
- 63.8%445Drove a car alone
- 5.0%35Carpooled
- 8.6%60Bus
- 7.6%53Long-distance train or commuter rail
- 1.9%13Taxi
- 7.6%53Bicycle
- 4.2%29Walked
- 0.9%6Other means
- 19.5%136Worked at home

Time leaving home to go to work
![Time leaving home to go to work]()
- 5112:00 a.m. to 4:59 a.m.
- 75:00 a.m. to 5:29 a.m.
- 425:30 a.m. to 5:59 a.m.
- 646:00 a.m. to 6:29 a.m.
- 476:30 a.m. to 6:59 a.m.
- 867:00 a.m. to 7:29 a.m.
- 1107:30 a.m. to 7:59 a.m.
- 2198:00 a.m. to 8:29 a.m.
- 1318:30 a.m. to 8:59 a.m.
- 3159:00 a.m. to 9:59 a.m.
- 5910:00 a.m. to 10:59 a.m.
- 1411:00 a.m. to 11:59 a.m.
- 6112:00 p.m. to 3:59 p.m.
- 614:00 p.m. to 11:59 p.m.

Occupations of males:
- Percentage of males in management occupations (except farmers):
Here: 25.6% city: 19.1%
- Percentage of males in business and financial operations occupations:
Here: 11.5% city: 7.0%
- Percentage of males in computer and mathematical occupations:
Here: 12.0% city: 22.2%
- Percentage of males in architecture and engineering occupations:
Here: 8.8% city: 10.1%
- Percentage of males in life, physical, and social science occupations:
Here: 3.5% city: 6.4%
- Percentage of males in community and social services occupations:
Here: 1.0% city: 0.8%
- Percentage of males in education, training, and library occupations:
Here: 3.8% city: 7.2%
- Percentage of males in arts, design, entertainment, sports, and media occupations:
Here: 3.8% city: 3.2%
- Percentage of males in healthcare practitioners and technical occupations:
Here: 9.1% city: 4.6%
- Percentage of males in service occupations:
Here: 1.5% city: 4.5%
- Percentage of males in sales and office occupations:
Here: 6.2% city: 5.7%
- Percentage of males in construction, extraction, and maintenance occupations:
Here: 2.2% city: 1.7%
- Percentage of males in production occupations:
Here: 3.2% city: 1.4%
- Percentage of males in transportation occupations:
Here: 3.3% city: 0.9%
Occupations of females:
- Percentage of females in management occupations (except farmers):
Here: 26.3% city: 19.0%
- Percentage of females in business and financial operations occupations:
Here: 2.5% city: 8.3%
- Percentage of females in computer and mathematical occupations:
Here: 8.2% city: 8.6%
- Percentage of females in architecture and engineering occupations:
Here: 6.6% city: 4.0%
- Percentage of females in life, physical, and social science occupations:
Here: 8.0% city: 6.8%
- Percentage of females in community and social services occupations:
Here: 2.3% city: 1.3%
- Percentage of females in legal occupations:
Here: 10.6% city: 4.8%
- Percentage of females in education, training, and library occupations:
Here: 8.4% city: 12.9%
- Percentage of females in arts, design, entertainment, sports, and media occupations:
Here: 6.8% city: 4.3%
- Percentage of females in healthcare practitioners and technical occupations:
Here: 9.7% city: 8.7%
- Percentage of females in service occupations:
Here: 5.7% city: 8.4%
- Percentage of females in sales and office occupations:
Here: 4.8% city: 11.7%
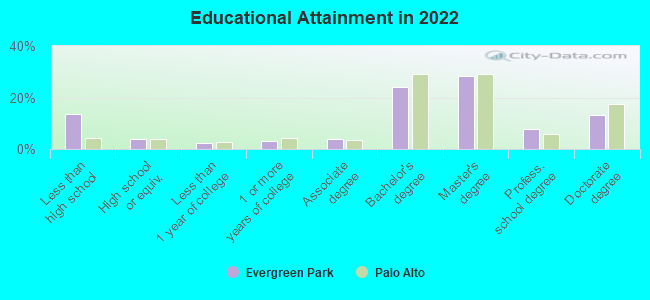
Education in this neighborhood (subdivision or community):
- Percentage of people 3 years and older in K-12 schools:
Evergreen Park: 27.1% Palo Alto: 14.2%
- Percentage of people 3 years and older in undergraduate colleges:
Evergreen Park: 1.8% Palo Alto: 2.4%
- Percentage of people 3 years and older in grad. or professional schools:
Evergreen Park: 6.0% Palo Alto: 2.8%
- Percentage of students K-12 enrolled in private schools:
Evergreen Park: 39.5% Palo Alto: 22.1%
Percentage of population below poverty level:
| Evergreen Park: | 3.0% |
| Palo Alto: | 4.5% |
Median year owner moved in (as recorded in 2022):
Median year renter moved in (as recorded in 2022):
| Evergreen Park: | 2003 |
| Palo Alto: | 2001 |
Median year renter moved in (as recorded in 2022):
| Evergreen Park: | 2019 |
| Palo Alto: | 2019 |
Percentage of married-couple families with both working:
| Evergreen Park: | 76.3% |
| Palo Alto: | 68.5% |
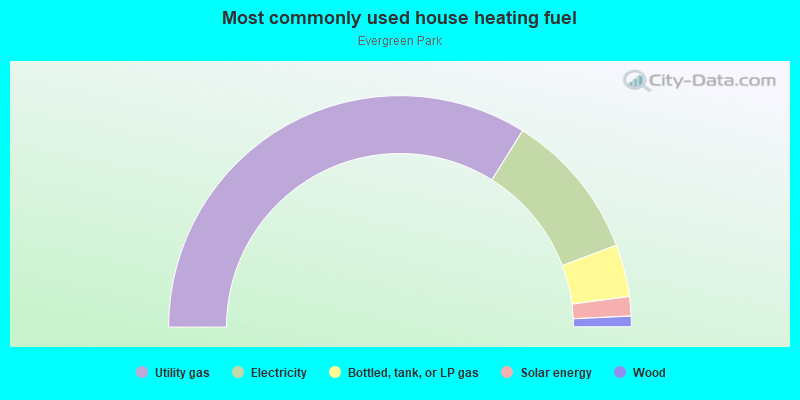
- 67.8%Utility gas
- 20.7%Electricity
- 7.3%Bottled, tank, or LP gas
- 2.7%Solar energy
- 1.5%Wood
Highways in this neighborhood:
el Camino Real (State Hwy 82)
Length: 0.75 miles
Directions: N-S, SE-NW, SW-NE
Address range: 1800 to 2799
Directions: N-S, SE-NW, SW-NE
Address range: 1800 to 2799
Roads and streets:
Birch St
Length: 0.79 miles
Directions: E-W, N-S, SE-NW, SW-NE
Address range: 1800 to 2799
Directions: E-W, N-S, SE-NW, SW-NE
Address range: 1800 to 2799
Park Blvd
Length: 0.77 miles
Directions: E-W, SE-NW, SW-NE
Address range: 1812 to 2739
Directions: E-W, SE-NW, SW-NE
Address range: 1812 to 2739
Alma St
Length: 0.64 miles
Directions: E-W, SE-NW
Address range: 1800 to 2399
Directions: E-W, SE-NW
Address range: 1800 to 2399
Ash St
Length: 0.62 miles
Direction: SE-NW
Address range: 1800 to 2799
Direction: SE-NW
Address range: 1800 to 2799
Oregon Expy (Page Mill Rd)
Length: 0.42 miles
Directions: N-S, SW-NE
Address range: 100 to 499
Directions: N-S, SW-NE
Address range: 100 to 499
S California Ave
Length: 0.38 miles
Direction: SW-NE
Address range: 100 to 499
Direction: SW-NE
Address range: 100 to 499
Sheridan Ave
Length: 0.38 miles
Directions: E-W, N-S, SE-NW, SW-NE
Address range: 100 to 499
Directions: E-W, N-S, SE-NW, SW-NE
Address range: 100 to 499
Cambridge Ave
Length: 0.35 miles
Direction: SW-NE
Address range: 100 to 499
Direction: SW-NE
Address range: 100 to 499
College Ave
Length: 0.34 miles
Direction: SW-NE
Address range: 200 to 499
Direction: SW-NE
Address range: 200 to 499
Sherman Ave
Length: 0.34 miles
Direction: SW-NE
Address range: 100 to 499
Direction: SW-NE
Address range: 100 to 499
Grant Ave
Length: 0.32 miles
Direction: SW-NE
Address range: 100 to 499
Direction: SW-NE
Address range: 100 to 499
Oxford Ave
Length: 0.32 miles
Direction: SW-NE
Address range: 200 to 499
Direction: SW-NE
Address range: 200 to 499
Stanford Ave
Length: 0.31 miles
Direction: SW-NE
Address range: 200 to 499
Direction: SW-NE
Address range: 200 to 499
New Mayfield Ln
Length: 0.27 miles
Directions: SE-NW, SW-NE
Address range: 200 to 499
Directions: SE-NW, SW-NE
Address range: 200 to 499
Leland Ave
Length: 0.26 miles
Directions: N-S, SW-NE
Address range: 200 to 499
Directions: N-S, SW-NE
Address range: 200 to 499
Jacaranda Ln
Length: 0.21 miles
Directions: E-W, SW-NE
Address range: 300 to 499
Directions: E-W, SW-NE
Address range: 300 to 499
Park Ave
Length: 0.04 miles
Direction: SW-NE
Address range: 100 to 126
Direction: SW-NE
Address range: 100 to 126
Palo Alto Sq
Length: 0.03 miles
Direction: SW-NE
Address range: 1 to 6
Direction: SW-NE
Address range: 1 to 6
Railroad features:
Union Pacific RR
Length: 0.55 miles
Direction: SE-NW
Direction: SE-NW